World Bank data for 2023 show a wide spread in grants and other revenue as a percentage of government revenue. The country-and-economy file contains 217 rows after aggregate groups are excluded, but only 102 have a usable observation for 2023; 115 remain source-missing. Among the reported values, the median is 17.38% and the unweighted mean is 22.28%. Somalia records the highest share at 90.67%, followed by Kiribati at 80.37% and the United Arab Emirates at 79.39%. The United States is the lowest reported observation at 2.60%. Missing entries are not treated as zero.
The indicator requires a careful reading because it is broader than a measure of foreign aid. In the World Bank metadata, grants are transfers receivable by government units from other government units or international organizations that are not taxes, subsidies, or social contributions. “Other revenue” covers revenue other than taxes, social contributions, and grants, including property income, sales of goods and services, and miscellaneous receipts. A value of 70% therefore does not mean that 70% of a government’s revenue came from foreign grants. It describes a combined non-tax revenue category relative to total revenue.
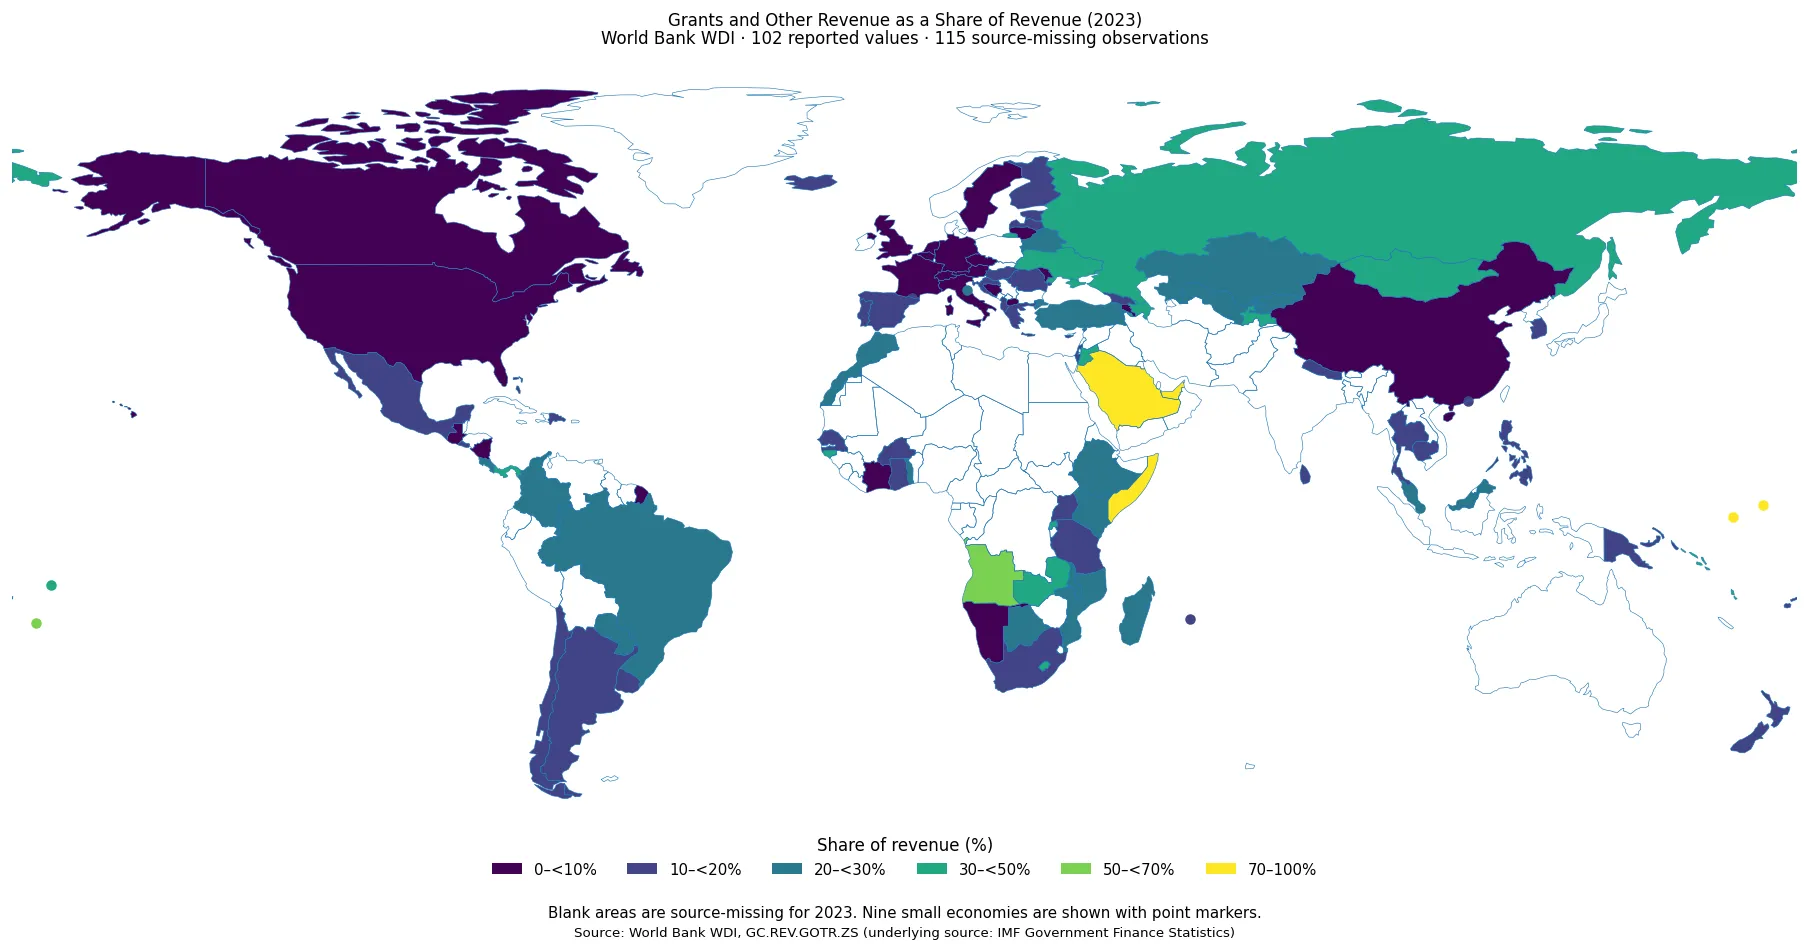
Table of Contents
Most reported economies are below 30%, despite several very high values
The middle half of the 102 observations lies between 10.72% and 27.13%, with a median of 17.38%. Twenty-two economies are below 10%, another 39 are from 10% to under 20%, and 20 are from 20% to under 30%. That means 81 of the 102 reported observations are below 30%. Fourteen fall between 30% and 50%, two between 50% and 70%, and only five are at 70% or more. The map therefore contains a broad central band and a relatively small high-end tail.
The mean of 22.28% is higher than the median because the upper observations pull the average upward. The 90th percentile is 42.38% and the 95th percentile is 56.98%. Only seven reported economies exceed 50%. Those statistics matter because a simple average can overstate what is typical when a few governments have unusually large non-tax, grant, property-income, or service-sale components. For a cross-country reading, the median and the shape of the distribution are more informative than the mean alone.
| Economy | Grants and other revenue (% of revenue) |
|---|---|
| Somalia, Fed. Rep. | 90.67% |
| Kiribati | 80.37% |
| United Arab Emirates | 79.39% |
| Naoero | 74.69% |
| Saudi Arabia | 70.58% |
| Angola | 57.02% |
| Tonga | 56.24% |
| Vanuatu | 49.28% |
| Ukraine | 47.80% |
| Solomon Islands | 42.44% |
The top of the table spans the Pacific, Middle East, Africa, and Eastern Europe
Somalia leads the 2023 observations at 90.67%. Kiribati is next at 80.37%, the United Arab Emirates at 79.39%, Nauru at 74.69%, and Saudi Arabia at 70.58%. Angola records 57.02%, Tonga 56.24%, Vanuatu 49.28%, Ukraine 47.80%, and Solomon Islands 42.44%. The ten highest observations do not form a single continental bloc; they appear in several very different fiscal and institutional settings.
That diversity is a warning against attaching one explanation to every high value. Grants can matter, but other revenue also includes property income, sales of government goods and services, and miscellaneous receipts. A small island economy with licensing or public-asset income can reach a high percentage for a reason that differs from a country receiving large intergovernmental transfers. The indicator identifies where the combined share is large; it does not disaggregate the components needed to explain why.
Pacific reporting economies form the clearest high-value geographic cluster
The Pacific stands out on the map. Kiribati is at 80.37%, Nauru at 74.69%, Tonga at 56.24%, Vanuatu at 49.28%, Solomon Islands at 42.44%, and Samoa at 31.51%. Fiji is much lower at 16.34%, while Papua New Guinea and New Zealand are both close to 11.02%. Even within this visible cluster, the range is large, so the region should not be treated as fiscally uniform.
Small economies can have revenue structures in which a few sources carry substantial weight. Fishing access, public property income, service charges, external transfers, or other country-specific receipts may be important in some cases, but this single series cannot establish which source dominates. The map is useful for selecting cases for deeper investigation. A causal explanation should be based on each economy’s detailed government-finance accounts rather than inferred from geography or size alone.
High Gulf values contrast with much lower observations elsewhere in the broader region
The United Arab Emirates records 79.39% and Saudi Arabia 70.58%, both among the five highest observations. Jordan is 32.31% and Israel 13.45%. Azerbaijan, farther north, is 42.39%. The differences show that neighboring or economically connected countries can have very different shares of grants and other revenue in their total government revenue.
It is also unsafe to rename this indicator as an oil-revenue share. The classification depends on how government receipts are recorded within fiscal statistics. Resource-related payments, dividends, property income, taxes, and other receipts can appear in different categories depending on the transaction. A country with a large hydrocarbon sector may have a high value for reasons that require examination of the underlying fiscal accounts, while another resource producer may record a larger portion as taxes.
Europe contains one high outlier and many single-digit observations
Ukraine is the clearest high European observation at 47.80%. Croatia is 16.32%, Hungary 16.04%, Albania 15.88%, and Romania 15.30%. By contrast, Belgium is 3.85%, the Netherlands 4.77%, the United Kingdom 5.20%, France 6.76%, Sweden 6.80%, Germany 7.78%, and Italy 7.96%. The continental range is therefore wide even among countries that share many institutional features.
A low percentage does not by itself mean low government revenue. It can simply mean that taxes, social contributions, or other categories outside the numerator make up a larger share of the total. Similarly, a high percentage does not automatically indicate strong revenue performance. Because the indicator is a composition ratio rather than a level, it should not be used to compare the absolute fiscal capacity of governments. Revenue-to-GDP, expenditure, balances, and debt answer different questions.
Central Asia and the Caucasus show sharp differences among nearby economies
Azerbaijan is at 42.39% and Tajikistan at 41.58%. Uzbekistan and Kazakhstan are both close to 30%, at 29.76% and 29.63%. Georgia is 16.38%, while Armenia is only 6.83%. These neighboring observations span more than 35 percentage points. Such contrasts are exactly the kind of pattern that a country map reveals more clearly than a single regional average.
The denominator also matters. If grants and other revenue stay constant but tax receipts or social contributions rise, total revenue increases and the ratio can fall. If the numerator rises while other revenue categories are flat, the ratio can increase. A change in the percentage therefore cannot be attributed to the numerator without looking at the underlying amounts. The 2023 cross-section gives relative positions, not a decomposition of what moved over time.
The Americas range from 2.60% in the United States to above 30% in Panama
Panama has the highest reported value in the Americas at 30.41%, followed by Colombia at 26.84%, Costa Rica at 21.78%, Brazil at 21.50%, and Paraguay at 20.64%. Uruguay and Chile are both around 17.8%, while Argentina is 16.05% and Mexico 12.98%. At the lower end, Nicaragua is 7.90%, Canada 6.94%, Guatemala 4.29%, and the United States 2.60%.
These figures should not be turned into a ranking of grant dependence. A 20% observation could contain a very different mix of intergovernmental grants, property income, public-service sales, and miscellaneous revenue from another economy also at 20%. The common percentage makes their aggregate composition look similar, but not necessarily their sources. For policy interpretation, the detailed government-finance breakdown is needed after the map identifies a country of interest.
African observations range from Somalia’s 90.67% to Namibia’s 6.88%
Somalia is the global maximum at 90.67% and Angola is also high at 57.02%. Rwanda records 34.44%, Zambia 34.26%, and Lesotho 33.70%. Ethiopia is 28.70%, Mozambique 23.23%, Kenya 21.31%, and Morocco 21.21%. South Africa is lower at 13.48%, Mauritius at 11.14%, and Namibia at 6.88%. The region contains both very high and relatively low reported values.
A high value may motivate a closer look at the role of grants, especially where public finances receive substantial external transfers, but the indicator itself does not isolate grants from the other-revenue component. The World Bank series is useful as a screening measure of revenue composition. To distinguish aid, property income, fees, or sales, analysts need the underlying Government Finance Statistics categories or national budget and final-account documents.
The 115 missing observations are not zeroes and must remain outside the rankings
More than half of the 217 rows have no usable 2023 value. Those 115 entries are missing observations, not 0%. If they were filled with zero, the dataset would suddenly gain 115 artificial values below the true minimum of 2.60%. The median, mean, percentiles, map classes, and country rankings would all be distorted. Every statistic in this article therefore uses only the 102 reported values.
The missingness also limits the scope of the conclusion. This is a comparison of economies that report a 2023 observation in the supplied World Bank series, not a complete measurement of every country in the world. A blank area on the map means “no 2023 observation in this dataset,” not “no grants and other revenue.” Coverage can also change across years, so time-series work needs to track both the indicator value and whether each country reports consistently.
| Economy | Low reported value |
|---|---|
| United States | 2.60% |
| Belgium | 3.85% |
| Guatemala | 4.29% |
| Netherlands | 4.77% |
| United Kingdom | 5.20% |
| China | 6.53% |
| France | 6.76% |
| Sweden | 6.80% |
| Armenia | 6.83% |
| Namibia | 6.88% |
This is not the mathematical complement of the tax share
Government revenue can include taxes, social contributions, grants, property income, sales of goods and services, and other receipts. Consequently, subtracting this indicator from 100 does not produce the tax share. Social contributions and other separately classified components remain in total revenue. Treating 100 minus the series as “tax revenue” would collapse several fiscal categories and create a misleading comparison.
The indicator is best used to answer a narrower question: how large is the combined grants-and-other-revenue category within total government revenue for each reporting economy? That question is valuable because it highlights where non-tax or transfer-related sources play a larger role in the revenue mix. It should then be paired with tax revenue, social contributions, revenue-to-GDP, fiscal balance, and debt measures when the objective is a broader assessment of public finances.
Source, definition, and a practical reading rule
The source is the World Bank World Development Indicators series GC.REV.GOTR.ZS, “Grants and other revenue (% of revenue).” World Bank metadata identify the underlying source as the IMF Government Finance Statistics Yearbook and data files. Grants are transfers receivable by government units that do not meet the definition of a tax, subsidy, or social contribution. Other revenue excludes taxes, social contributions, and grants and includes property income, sales of goods and services, and miscellaneous receipts.
The safest interpretation is therefore compositional rather than evaluative. A higher percentage says that this combined category occupies a larger part of total government revenue; it does not by itself say whether fiscal policy is stronger, weaker, more sustainable, or more aid-dependent. The 2023 map is most useful for locating high and low shares, spotting neighboring contrasts, and deciding where a more detailed breakdown of fiscal revenue would be worth examining.
Frequently Asked Questions
Does a high grants and other revenue share mean high foreign-aid dependence?
No. The numerator combines grants with other revenue such as property income, sales of goods and services, and miscellaneous receipts. It is not an aid-dependence measure.
What are the 2023 median and mean among reported economies?
Across the 102 reported observations, the median is 17.38% and the unweighted mean is 22.28%. The mean is pulled upward by a small number of high values.
Should the 115 missing observations be counted as 0%?
No. They are source-missing observations, not measured zeroes. Zero-filling them would distort the distribution, rankings, and map.
Related Articles
Green Map creates custom-edited map images using open geographic data sources such as geoBoundaries, Natural Earth, OpenStreetMap, and government open data. These maps are edited visual materials, not raw data files, and are provided for education, documents, presentations, and graphic reference.