Female labor force participation measures how many women ages 15 and older are either working or actively engaged in the labor market as jobseekers. The World Bank indicator SL.TLF.CACT.FE.NE.ZS expresses that labor force as a percentage of the female population ages 15+. It therefore answers a different question from an employment-to-population ratio, which counts only people who are employed, and from an unemployment rate, which uses the labor force rather than the whole adult female population as its denominator. Women who are studying, retired, engaged in unpaid household responsibilities without seeking work, unable to work, or otherwise outside the labor force remain in the population denominator but not in the labor-force numerator.
The 2024 national-estimate series contains usable values for 104 economies and source-missing values for 113 of the 217 economies in the file. All summary statistics in this article are calculated only from the reported observations. Missing values are not converted to zero, because doing so would falsely imply that women in those economies had no labor-market participation. The national-estimate label is also important: the figures come through national statistical systems and labor-force surveys, so broad cross-country contrasts are informative, while very small differences should not be treated as if every observation came from an identical survey instrument on the same date.
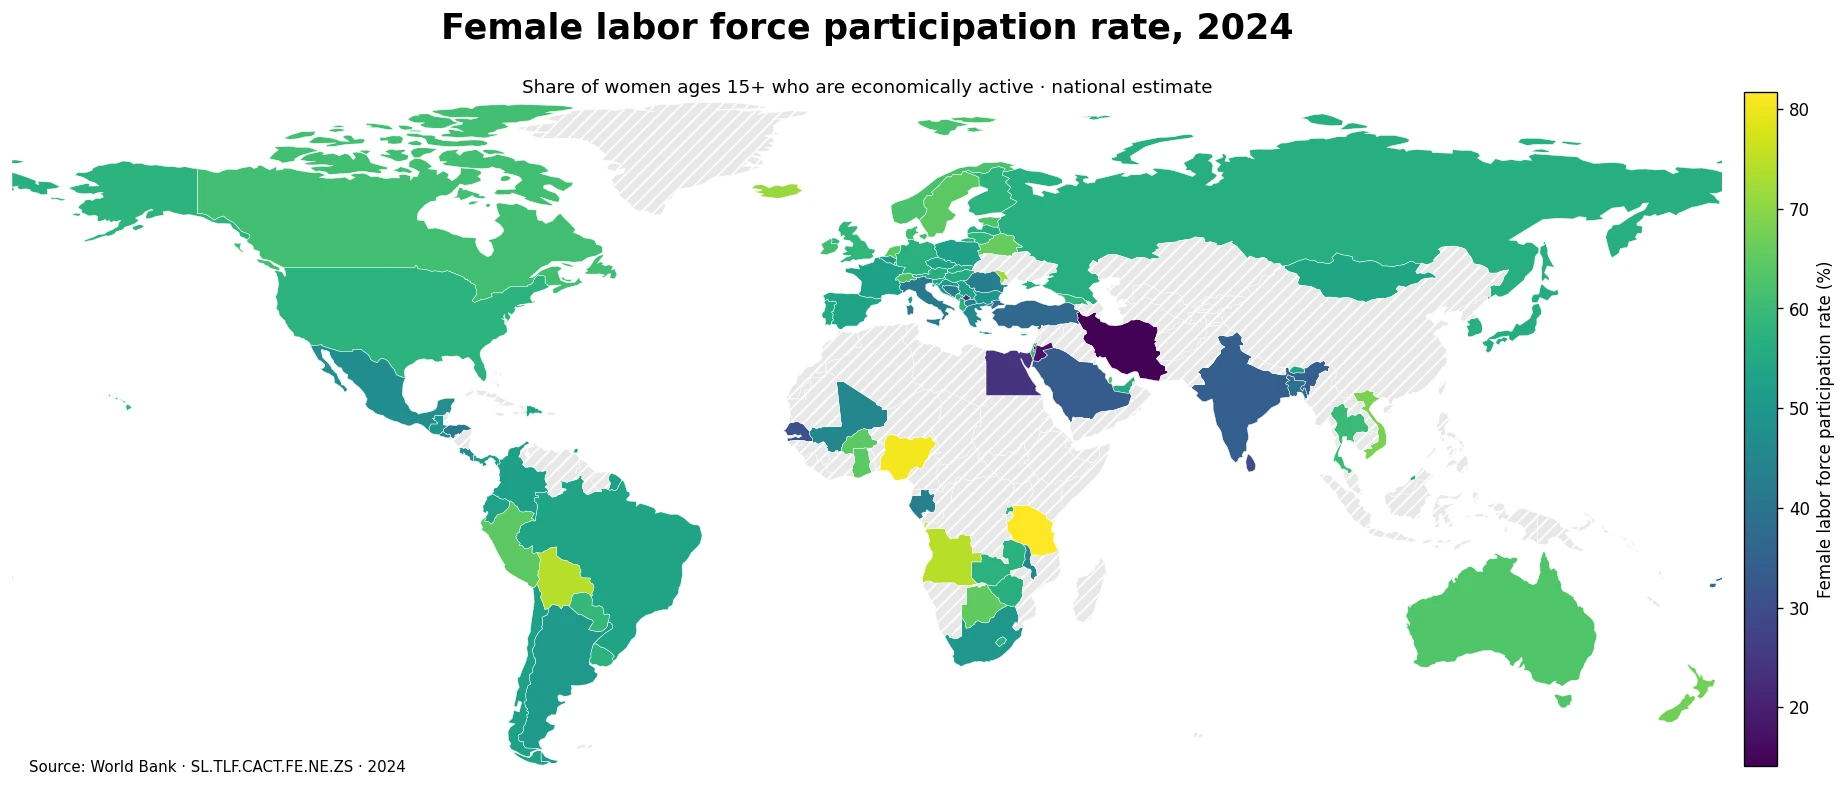
Table of Contents
The median across 104 reporting economies was 55.5%
Across the 104 reported observations, the simple mean was 53.33% and the median was 55.47%. The first quartile was 47.44% and the third quartile was 60.86%, placing the middle half of reporting economies between roughly 47.4% and 60.9%. The 10th percentile was 37.11% and the 90th percentile was 64.63%. The gap between the minimum and maximum was 67.59 percentage points, showing that the share of adult women participating in the labor market varies widely even within a single reference year.
Only 2 economies were at or above 80%, while 6 reached at least 70%. A total of 29 were at or above 60% and 73 were at or above 50%. At the lower end, 13 reporting economies were below 40%, 6 were below 30%, and 3 were below 20%. These bands matter because the global pattern is not well represented by one average. Economies near the median have participation around the mid-50s, but the distribution stretches from the mid-teens to above 80%.
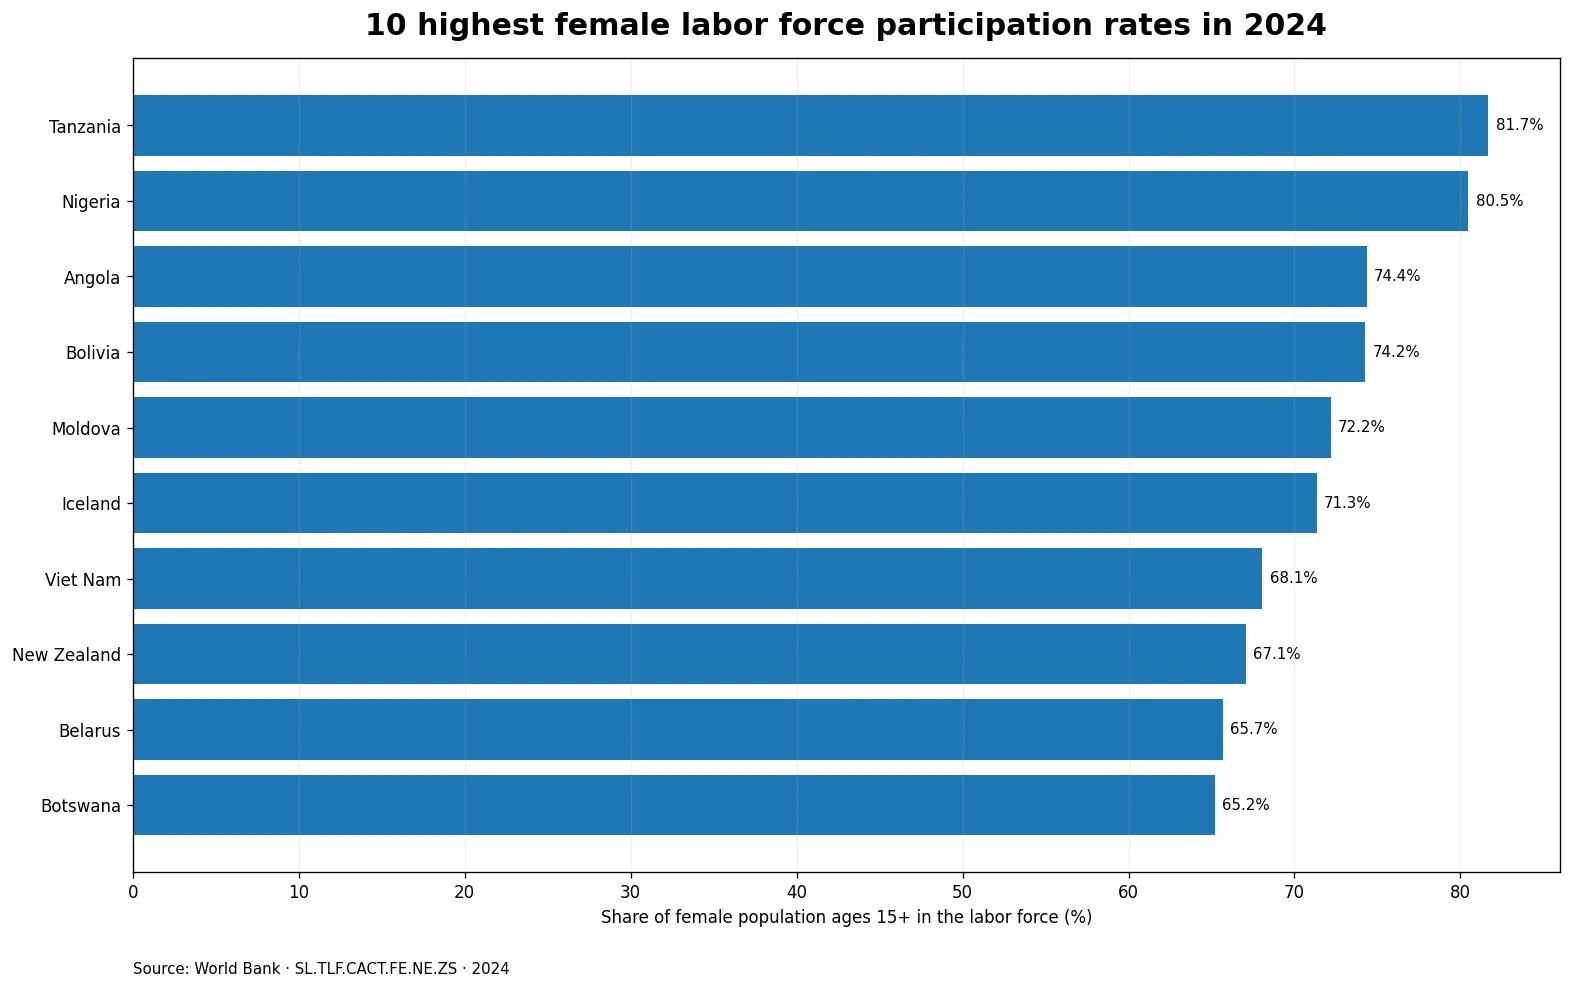
Tanzania and Nigeria were the only economies above 80%
Tanzania recorded the highest 2024 value at 81.7%, followed by Nigeria at 80.5%. Angola reached 74.4%, Bolivia 74.2%, Moldova 72.2%, and Iceland 71.3%. Viet Nam, New Zealand, Belarus, and Botswana completed the top ten. Because these economies span Africa, South America, Europe, Asia, and Oceania, a high female participation rate cannot be reduced to one regional model, income category, or institutional arrangement. Similar headline rates can emerge from very different combinations of wage work, self-employment, family work, part-time jobs, and informal activity.
| Economy | Female labor force participation rate |
|---|---|
| Tanzania | 81.7% |
| Nigeria | 80.5% |
| Angola | 74.4% |
| Bolivia | 74.2% |
| Moldova | 72.2% |
| Iceland | 71.3% |
| Viet Nam | 68.1% |
| New Zealand | 67.1% |
| Belarus | 65.7% |
| Botswana | 65.2% |
A high rate should not be interpreted as a direct score for job quality. The indicator identifies whether women are economically active, not how much they earn, how many hours they work, whether their jobs are formal, or whether employment is stable and protected. An economy with extensive subsistence agriculture or informal self-employment can register a high participation rate for reasons that are quite different from an economy where women commonly combine education, salaried work, and part-time employment. The rate is best used as a measure of labor-market engagement, with job quality assessed through additional indicators.
Iran, Jordan, and the West Bank and Gaza were below 20%
The lowest reported value was Iran at 14.1%. Jordan stood at 17.6% and the West Bank and Gaza at 17.8%, leaving all three below 20%. Kosovo and Egypt were next, followed by Sri Lanka, Senegal, Saudi Arabia, Nauru, and India. These observations show a relatively small share of women ages 15+ in the labor force, but the indicator alone does not reveal why. Education, caregiving, access to jobs, transport, safety, social norms, retirement patterns, demographic structure, and the availability of suitable employment may all affect whether women enter or remain in the labor market.
| Economy | Female labor force participation rate |
|---|---|
| Iran, Islamic Rep. | 14.1% |
| Jordan | 17.6% |
| West Bank and Gaza | 17.8% |
| Kosovo | 22.5% |
| Egypt, Arab Rep. | 23.8% |
| Sri Lanka | 29.8% |
| Senegal | 31.0% |
| Saudi Arabia | 33.5% |
| Naoero | 34.4% |
| India | 34.4% |
Low participation therefore should not be equated with one single behavior or policy failure. In one economy, a larger share of young women may still be enrolled in education. In another, women may leave the labor force during periods of intensive caregiving. Elsewhere, weak labor demand may discourage job search, or institutional and social constraints may reduce access to paid work. The aggregate rate cannot distinguish among these pathways. Country-level analysis requires age-specific participation, education, fertility and care indicators, labor demand, and evidence on employment conditions before attributing the difference to a particular cause.
Participation is not the same as employment or unemployment
The labor force includes employed people plus unemployed people who meet the relevant criteria for active job search and availability. That means a woman can contribute to a high participation rate even if she is currently unemployed. The employment-to-population ratio removes that distinction by counting only employed people in the numerator. The unemployment rate changes the denominator again, dividing unemployed people by the labor force rather than by the whole female population ages 15+. These three indicators should be read together because each highlights a different stage of labor-market attachment.
Consider two economies with the same 55% female participation rate. If one has a much higher employment-to-population ratio, a larger portion of economically active women are actually employed. If the other has a higher unemployment rate, more participants may be searching for work. Conversely, a low unemployment rate does not necessarily mean broad female engagement if participation itself is low. A labor market can show relatively little measured unemployment while many women remain outside the labor force. This is why participation provides essential context for interpreting unemployment statistics.
European economies ranged from the low 40s to above 70%
European reporting economies also show substantial variation. Iceland was at 71.3% and Moldova at 72.2%. Sweden recorded 64.5% and the Netherlands 64.3%. The United Kingdom was at 58.4%, Germany at 56.9%, France at 52.9%, and Spain at 53.3%, while Italy was lower at 41.5%. These contrasts exist within the same broad region, so a continental average can conceal important differences in age structure, labor-market institutions, education, care arrangements, and the prevalence of part-time work.
The denominator also spans all women ages 15 and older, which makes demographics important. Economies with older female populations may have more women beyond typical working ages, while those with younger populations may have larger shares still in education. Retirement ages, the length of schooling, and the timing of entry into and exit from employment can therefore shift the aggregate rate even if participation among prime-age women is similar. Age-specific participation rates are useful when the goal is to identify whether differences are concentrated among young adults, prime-age women, or older workers.
The Americas and Asia also contained wide internal gaps
In the Americas, Bolivia was very high at 74.2%. Canada registered 61.2%, the United States 57.5%, Uruguay 57.2%, Brazil 53.5%, Chile 52.9%, Argentina 50.4%, and Mexico 47.0%. These values do not correspond to one common employment structure. Agriculture, services, self-employment, informality, urbanization, care arrangements, and part-time work differ greatly across the region, so similar participation rates can coexist with very different working conditions and income outcomes.
Among Asian reporting economies, Viet Nam was at 68.1%, Thailand 59.8%, Japan 55.6%, India 34.4%, and Sri Lanka 29.8%. Iran and Jordan were below 20%. Some large economies do not have a 2024 value in this specific national-estimate series, which is why substantial No data areas remain on the map. The analysis does not substitute values from other years or from different indicator variants, because doing so would mix reference periods or measurement concepts.
Africa contains both the highest values and much lower observations
African reporting economies illustrate the danger of treating a continent as one labor-market pattern. Tanzania stood at 81.7%, Nigeria at 80.5%, Angola at 74.4%, Botswana at 65.2%, and Ghana at 64.4%. South Africa was at 49.8%, Gabon at 42.6%, and Senegal at 31.0%. The spread reflects very different economies and labor arrangements, and the same participation rate can represent different mixes of paid employment, self-employment, agricultural work, informal activity, and unpaid family work.
High participation in a lower-income economy does not automatically imply stronger labor-market outcomes than lower participation in a richer economy. If women need to engage in low-productivity or insecure work because household income is limited, participation can be high while earnings and security remain weak. In another setting, participation may be lower because education lasts longer, household incomes allow more time outside paid work, or care responsibilities are concentrated within households. None of those mechanisms can be identified from the participation rate alone, so comparisons should remain descriptive unless supported by additional evidence.
National estimates support comparison but do not erase survey differences
The World Bank national-estimate series places country observations into a common indicator framework, but the underlying statistics can still differ in survey timing, sampling, reference periods, and detailed operational definitions. International labor concepts reduce those differences but do not make every national survey identical. For that reason, broad contrasts such as 20% versus 60% are generally more informative than ranking economies separated by a few tenths of a percentage point. When exact policy evaluation is required, the underlying national labor-force survey documentation should be consulted alongside the international series.
The 2024 cross-section also says nothing by itself about direction of change. A rate of 55% could represent a rise from 45%, a decline from 65%, or a stable level. Participation responds over time to demographics, economic cycles, education, migration, care availability, social policy, and structural shifts in industries. Trend analysis therefore requires a consistent time series. This article intentionally focuses on the 2024 distribution rather than inferring improvement or deterioration from the level alone.
Missing values are kept separate from genuine low participation
Of the 217 economies in the supplied dataset, 104 have a 2024 observation and 113 are source-missing. The mean, median, quartiles, and rankings all use only the 104 reported values. Replacing missing observations with zero would pull the distribution downward and falsely place economies without data at the bottom of the ranking. On the map, missing areas are shown separately rather than sharing the color scale used for real percentages. This distinction is essential because “No data” is a statement about measurement availability, not about women’s labor-market behavior.
Among the 104 reporting economies, 96 match directly to polygons in the low-resolution world boundary used for visualization. Barbados, Hong Kong, St. Lucia, Malta, Mauritius, Nauru, Singapore, and Seychelles have reported values but are not represented as separate filled polygons in that boundary file. Their observations remain fully included in the statistics and rankings. A blank or unfilled location on a low-resolution map therefore should not automatically be interpreted as a missing source value.
Indicators that add context to female participation
- Female employment-to-population ratio: shows how many women ages 15+ are actually employed rather than merely in the labor force.
- Female unemployment rate: measures the share of the female labor force that is unemployed and actively seeking work.
- Age-specific female participation: separates youth, prime-age, and older-worker patterns that are blended in the 15+ aggregate.
- Part-time and informal employment: helps describe the type and security of work behind a high participation rate.
- Wages and earnings: indicate whether labor-market participation translates into stronger income and economic independence.
Together, these indicators make it possible to distinguish very different labor-market situations that could produce the same participation rate. High participation with high employment and low unemployment differs from high participation accompanied by substantial joblessness. Low participation may reflect prolonged education, population aging, care constraints, weak demand, or discouragement. The participation rate is therefore most useful as a gateway indicator: it identifies how broadly women are connected to the labor market, while other measures explain employment outcomes and job quality.
Data source and calculation
The analysis uses the World Bank indicator Labor force participation rate, female (% of female population ages 15+) (national estimate), code SL.TLF.CACT.FE.NE.ZS for 2024. Descriptive statistics include the 104 economies with non-missing observations and exclude the 113 source-missing economies. The mean is the arithmetic mean of reported values; the median and quartiles are calculated from the same reported distribution. Top and bottom tables rank only valid 2024 observations. No missing value is estimated, backfilled from another year, or replaced with zero.
The map joins ISO3 economy codes to a low-resolution world boundary. Ninety-six reporting economies have a matching polygon in that file, while eight small or city-sized economies remain outside the filled geometry even though their numeric observations are used elsewhere. The visualization and text therefore separate two concepts that are often confused: whether a data value exists, and whether a chosen boundary file contains a polygon capable of displaying it. Any reuse of these figures should retain the 2024 reference year, national-estimate definition, and 104-economy reporting scope.
Frequently Asked Questions
What does a female labor force participation rate of 60% mean?
It means about 60 of every 100 women ages 15 and older are either employed or actively participating in the labor market as unemployed jobseekers. The remaining 40 are not all unemployed.
Does a higher female participation rate mean better job quality?
No. Participation measures labor-market engagement, not wages, hours, job security, formality, benefits, or working conditions.
Were economies without a 2024 value treated as 0%?
No. The 113 source-missing economies remain missing and are excluded from the mean, median, quartiles, and rankings.
Related Articles
Green Map creates custom-edited map images using open geographic data sources such as geoBoundaries, Natural Earth, OpenStreetMap, and government open data. These maps are edited visual materials, not raw data files, and are provided for education, documents, presentations, and graphic reference.