Distillate fuel oil consumption in the U.S. non-CHP electric-power sector was highly uneven across states in 2024. This EIA series fixes fueltypeid at DFO, sectorid at 90 for Electric Power Sector Non-CHP, and the field at total-consumption. The unit is thousand short tons. All 50 states have numeric observations. Hawaii recorded 2,510.008 thousand short tons, followed by Alaska at 915.341 and Maryland at 458.723. Together, those three states represented 41.76% of the sum of the 50 reported state values.
The measure should not be read as electricity generation or as total petroleum use in each state. In this EIA context, total-consumption covers fuel used for electricity generation and useful thermal output within the specified sector. Sector 90 excludes combined-heat-and-power activity. A similar-looking series using consumption-for-eg isolates fuel used for electricity generation, while generation measures electricity output. Fuel, sector, field, year, and unit therefore all matter when deciding whether two figures are actually comparable.
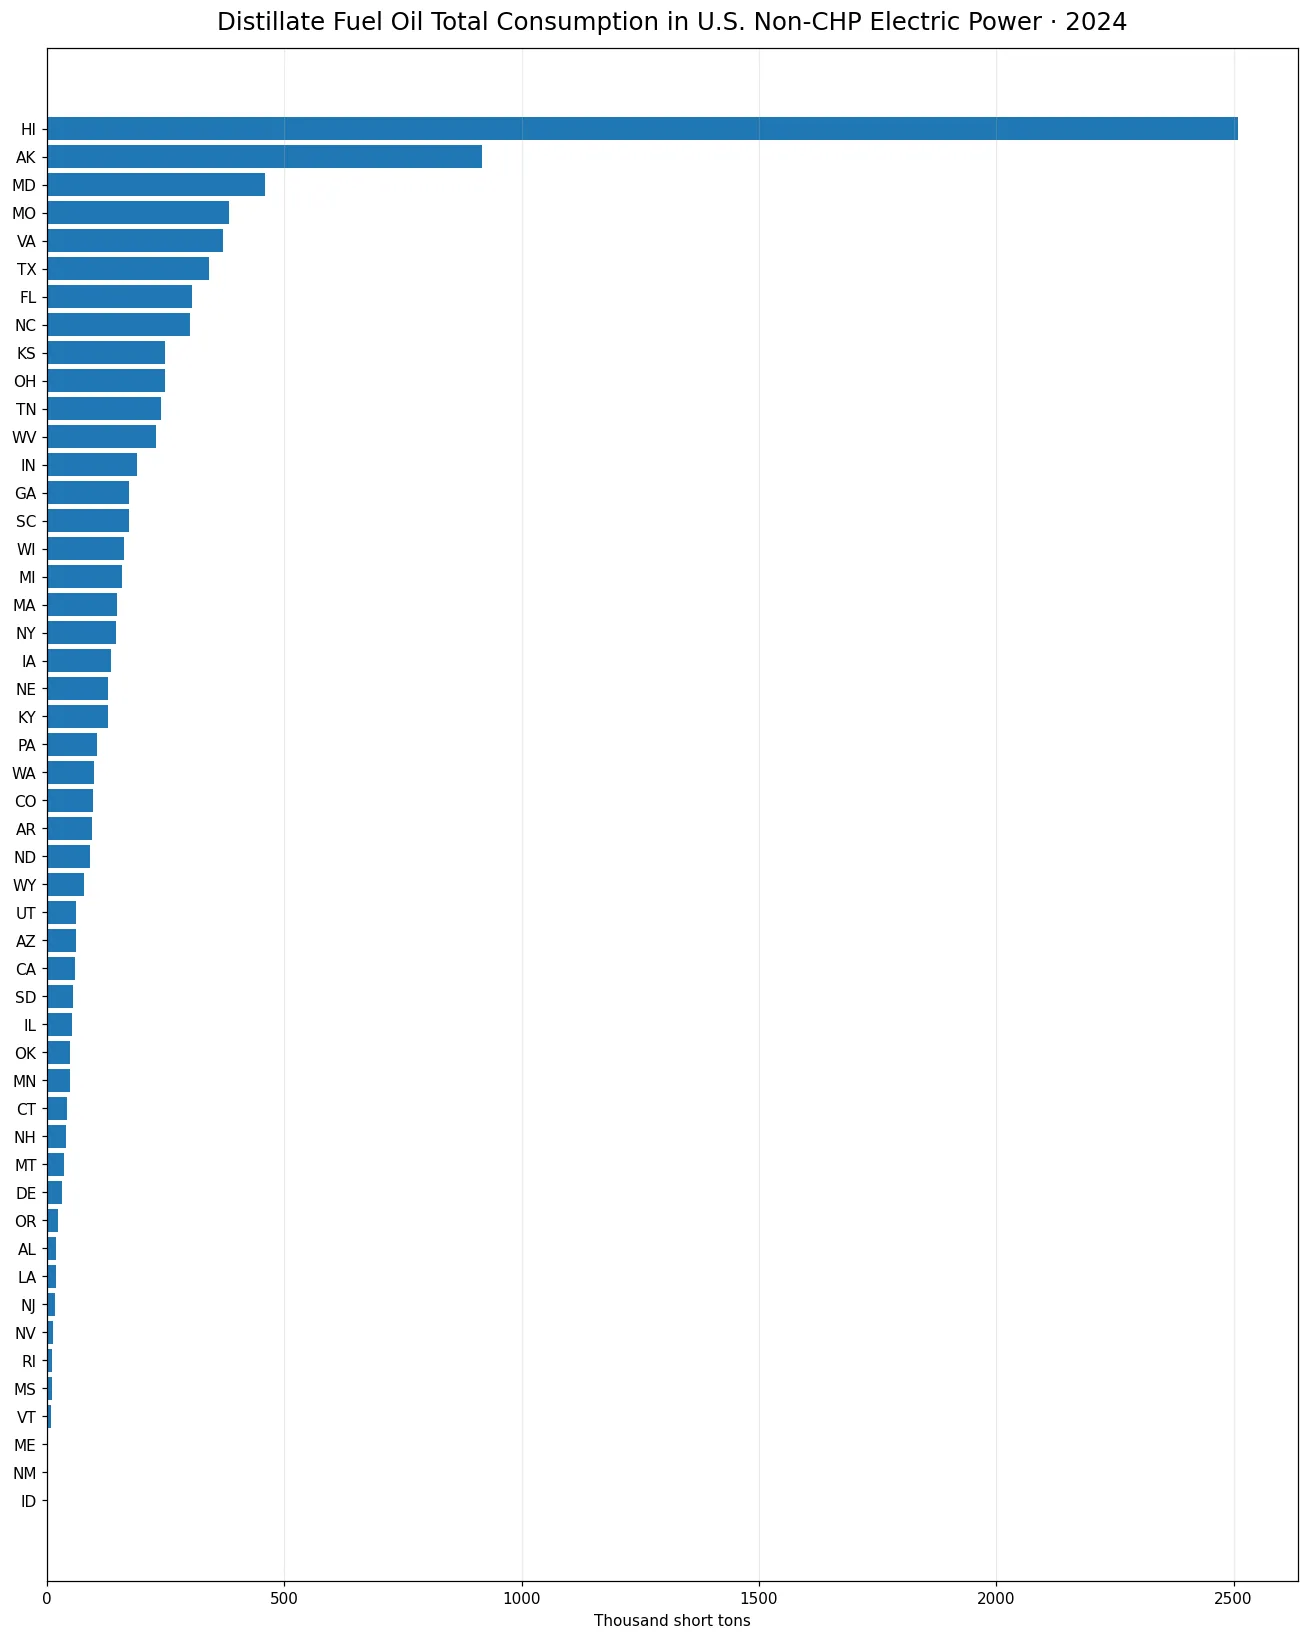
Table of Contents
Hawaii stood far above the rest of the states
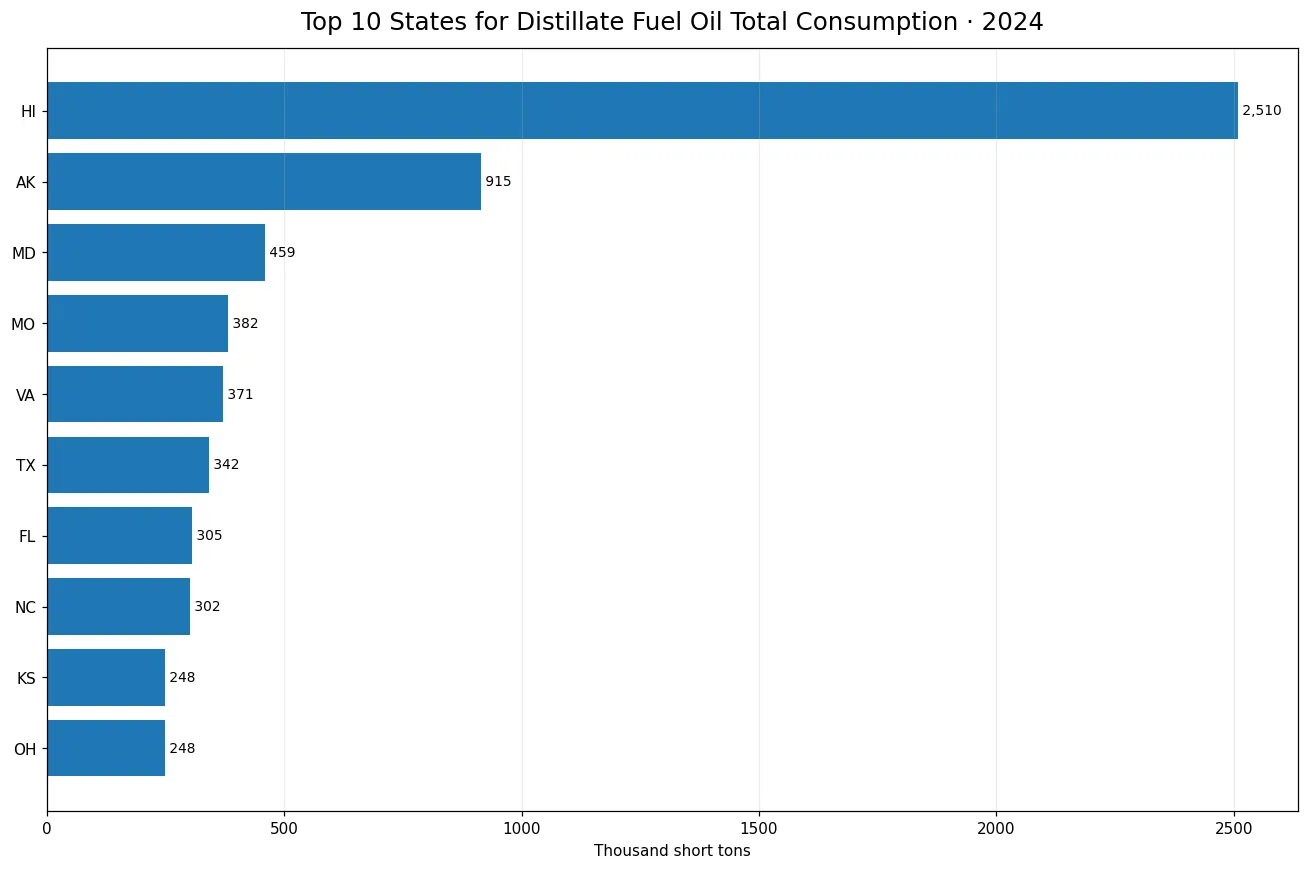
The 50-state sum was 9,300.291 thousand short tons. Hawaii alone accounted for 26.99% of that sum. Alaska contributed 9.84%, and Maryland contributed 4.93%. The top three states together reached 41.76%. Missouri ranked fourth at 382.480 thousand short tons, followed by Virginia at 371.436, Texas at 341.878, Florida at 304.833, North Carolina at 301.835, Kansas at 248.311, and Ohio at 247.921. Expanding the comparison to the top ten states brings the concentration to 65.40%.
These shares describe concentration within this exact state series; they are not shares of all U.S. petroleum consumption. A state can have a large absolute value here without petroleum necessarily representing a large share of its overall electricity supply. To answer a dependency or mix question, the numerator would need to be compared with an appropriate denominator such as total fuel input or total generation for the same sector and year. Absolute consumption and percentage dependence are different measures.
| State | Code | Total consumption (thousand short tons) | Share of 50-state sum |
|---|---|---|---|
| Hawaii | HI | 2,510.008 | 26.99% |
| Alaska | AK | 915.341 | 9.84% |
| Maryland | MD | 458.723 | 4.93% |
| Missouri | MO | 382.480 | 4.11% |
| Virginia | VA | 371.436 | 3.99% |
| Texas | TX | 341.878 | 3.68% |
| Florida | FL | 304.833 | 3.28% |
| North Carolina | NC | 301.835 | 3.25% |
| Kansas | KS | 248.311 | 2.67% |
| Ohio | OH | 247.921 | 2.67% |
The median is much lower than the mean
The state mean was 186.006 thousand short tons, while the median was only 94.971. The first quartile was 36.129 and the third quartile was 185.562. This gap between mean and median reflects a right-skewed distribution in which Hawaii and, to a lesser degree, Alaska pull the average upward. For describing a typical state, the median is therefore more informative than the mean by itself. The quartiles also show that most states fall far below the largest observations.
There are no missing observations and no exact zeros in this 50-state comparison. Idaho is the minimum at 0.083 thousand short tons, so even the smallest reported value is positive. That matters because the lower end is not being created by replacing absent values with zero. Every state has a numeric observation for this specific combination of fuel, sector, field, year, and unit. Very small values can be visually compressed on a chart dominated by Hawaii, so the table and summary statistics provide useful context.
Total consumption is broader than fuel used only for generation
The total-consumption field is a key part of the definition. It combines the physical fuel consumed for electricity generation with fuel consumed for useful thermal output within the selected EIA sector. It is therefore broader than consumption-for-eg, which isolates fuel used for electricity generation. It is also different from consumption-uto, which isolates useful thermal output, and from generation, which reports electricity production. Similar wording can hide these differences, so the field should always be checked before comparing articles or state rankings.
Sector 90 narrows the scope further. Electric Power Sector Non-CHP refers to electric-power activity outside combined heat and power. It is not interchangeable with sector 98 Electric Power or sector 99 All Sectors. Even with the same DFO fuel and the same year, changing the sector can change which activity is included. That is why this series can coexist with other 2024 distillate-fuel-oil articles without being a duplicate.
The unit is a physical quantity, not an energy or electricity output unit
EIA reports this series in thousand short tons. That is a physical-unit measure. It does not show the amount of electricity generated, as thousand MWh would, and it is not the same as a heat-content measure such as million MMBtu. Physical quantities and energy-content measures answer different questions. If fuel characteristics differ, the ordering by physical quantity does not have to match the ordering by heat input. Likewise, a state with high fuel consumption may not have equally high net generation if plant efficiency and operating conditions differ.
For the same reason, Hawaii’s 26.99% share should be stated carefully. It is 26.99% of the sum of the 50 state observations in this DFO, sector 90, total-consumption series. It does not mean Hawaii used 26.99% of all petroleum in the United States or produced 26.99% of petroleum-fired electricity. Those broader claims require different totals and, in some cases, different units.
The data show where consumption was large, not why it was large
The state pattern clearly identifies Hawaii as an outlier and Alaska as a distant second, but the series does not directly explain the causes. Plant portfolios, fuel-delivery arrangements, local system characteristics, operating schedules, and other factors could be relevant, yet testing those explanations would require plant-level generation, capacity, price, or operational data. A state ranking should therefore be used as a descriptive result rather than as evidence for a specific causal story.
The same caution applies to Maryland, Missouri, Virginia, and other states in the upper group. Their values describe the quantity reported under this exact EIA definition. They do not, by themselves, tell us whether distillate fuel oil is economically important to the state, whether it is used mainly for backup operation, or how frequently plants run. Those questions need additional evidence.
Consumption remains positive outside the top ten
Tennessee recorded 239.570 thousand short tons, West Virginia 228.792, Indiana 189.648, Georgia 173.306, and South Carolina 172.320. Many additional states sit around or below 100 thousand short tons. The distribution therefore has a broad positive tail rather than a simple split between users and non-users. All 50 states have positive observations, but the scale differs substantially. The top ten account for almost two thirds of the total while the remainder is spread across forty states.
Looking only at the leaders can hide this broad lower distribution. Looking only at the mean can also be misleading because the largest states raise it above the median. Reading the rank order together with the median, quartiles, minimum, and concentration shares gives a more complete picture of how this fuel-consumption measure is distributed.
Four identity checks prevent false comparisons
The first check is the fuel facet: DFO means distillate fuel oil and should not be assumed to equal broader petroleum categories such as PET or petroleum-liquids categories such as PEL. The second is the sector: this series uses sector 90, Electric Power Sector Non-CHP. The third is the field: total-consumption differs from consumption-for-eg, consumption-uto, and generation. The fourth is the unit: thousand short tons is not interchangeable with million MMBtu or thousand MWh.
Year is an additional dimension. A comparison can be meaningful only after these definitions are aligned. Two articles can look nearly identical in a search result while measuring different parts of the EIA data structure. Conversely, if fuel, sector, field, year, and unit all match exactly, a second article may genuinely duplicate an existing one. Careful identity checking keeps related but distinct measures separate.
What this measure can and cannot tell us
This measure can show the 2024 state ranking for DFO total consumption in non-CHP electric power, the concentration of consumption among leading states, and descriptive statistics for the 50 reported values. It cannot by itself explain why consumption was high, estimate costs, measure emissions, report plant efficiency, or calculate petroleum’s share of a state’s electricity mix. Each of those questions requires additional variables and, often, a different denominator.
The main result is therefore descriptive but useful: Hawaii led by a wide margin, Alaska was second, Maryland was third, and the top ten states accounted for 65.40% of the 50-state sum. At the same time, every state recorded a positive value. The series is best understood as a narrowly defined physical-fuel-consumption comparison, not as a general ranking of state energy systems.
Frequently Asked Questions
Which state had the highest distillate fuel oil total consumption in 2024?
Hawaii was highest at 2,510.008 thousand short tons, equal to 26.99% of the sum of the 50 state observations.
Is total-consumption the same as fuel used only for electricity generation?
No. For this series, total-consumption covers DFO used for electricity generation and useful thermal output within sector 90, so it is broader than consumption-for-eg.
Are any states missing or reported as zero?
No. All 50 states have numeric positive observations; Idaho is the minimum at 0.083 thousand short tons.
Is thousand short tons an electricity-generation unit?
No. It is a physical fuel unit and should not be treated as equivalent to thousand MWh or million MMBtu.
Related Articles
Green Map creates custom-edited map images using open geographic data sources such as geoBoundaries, Natural Earth, OpenStreetMap, and government open data. These maps are edited visual materials, not raw data files, and are provided for education, documents, presentations, and graphic reference.