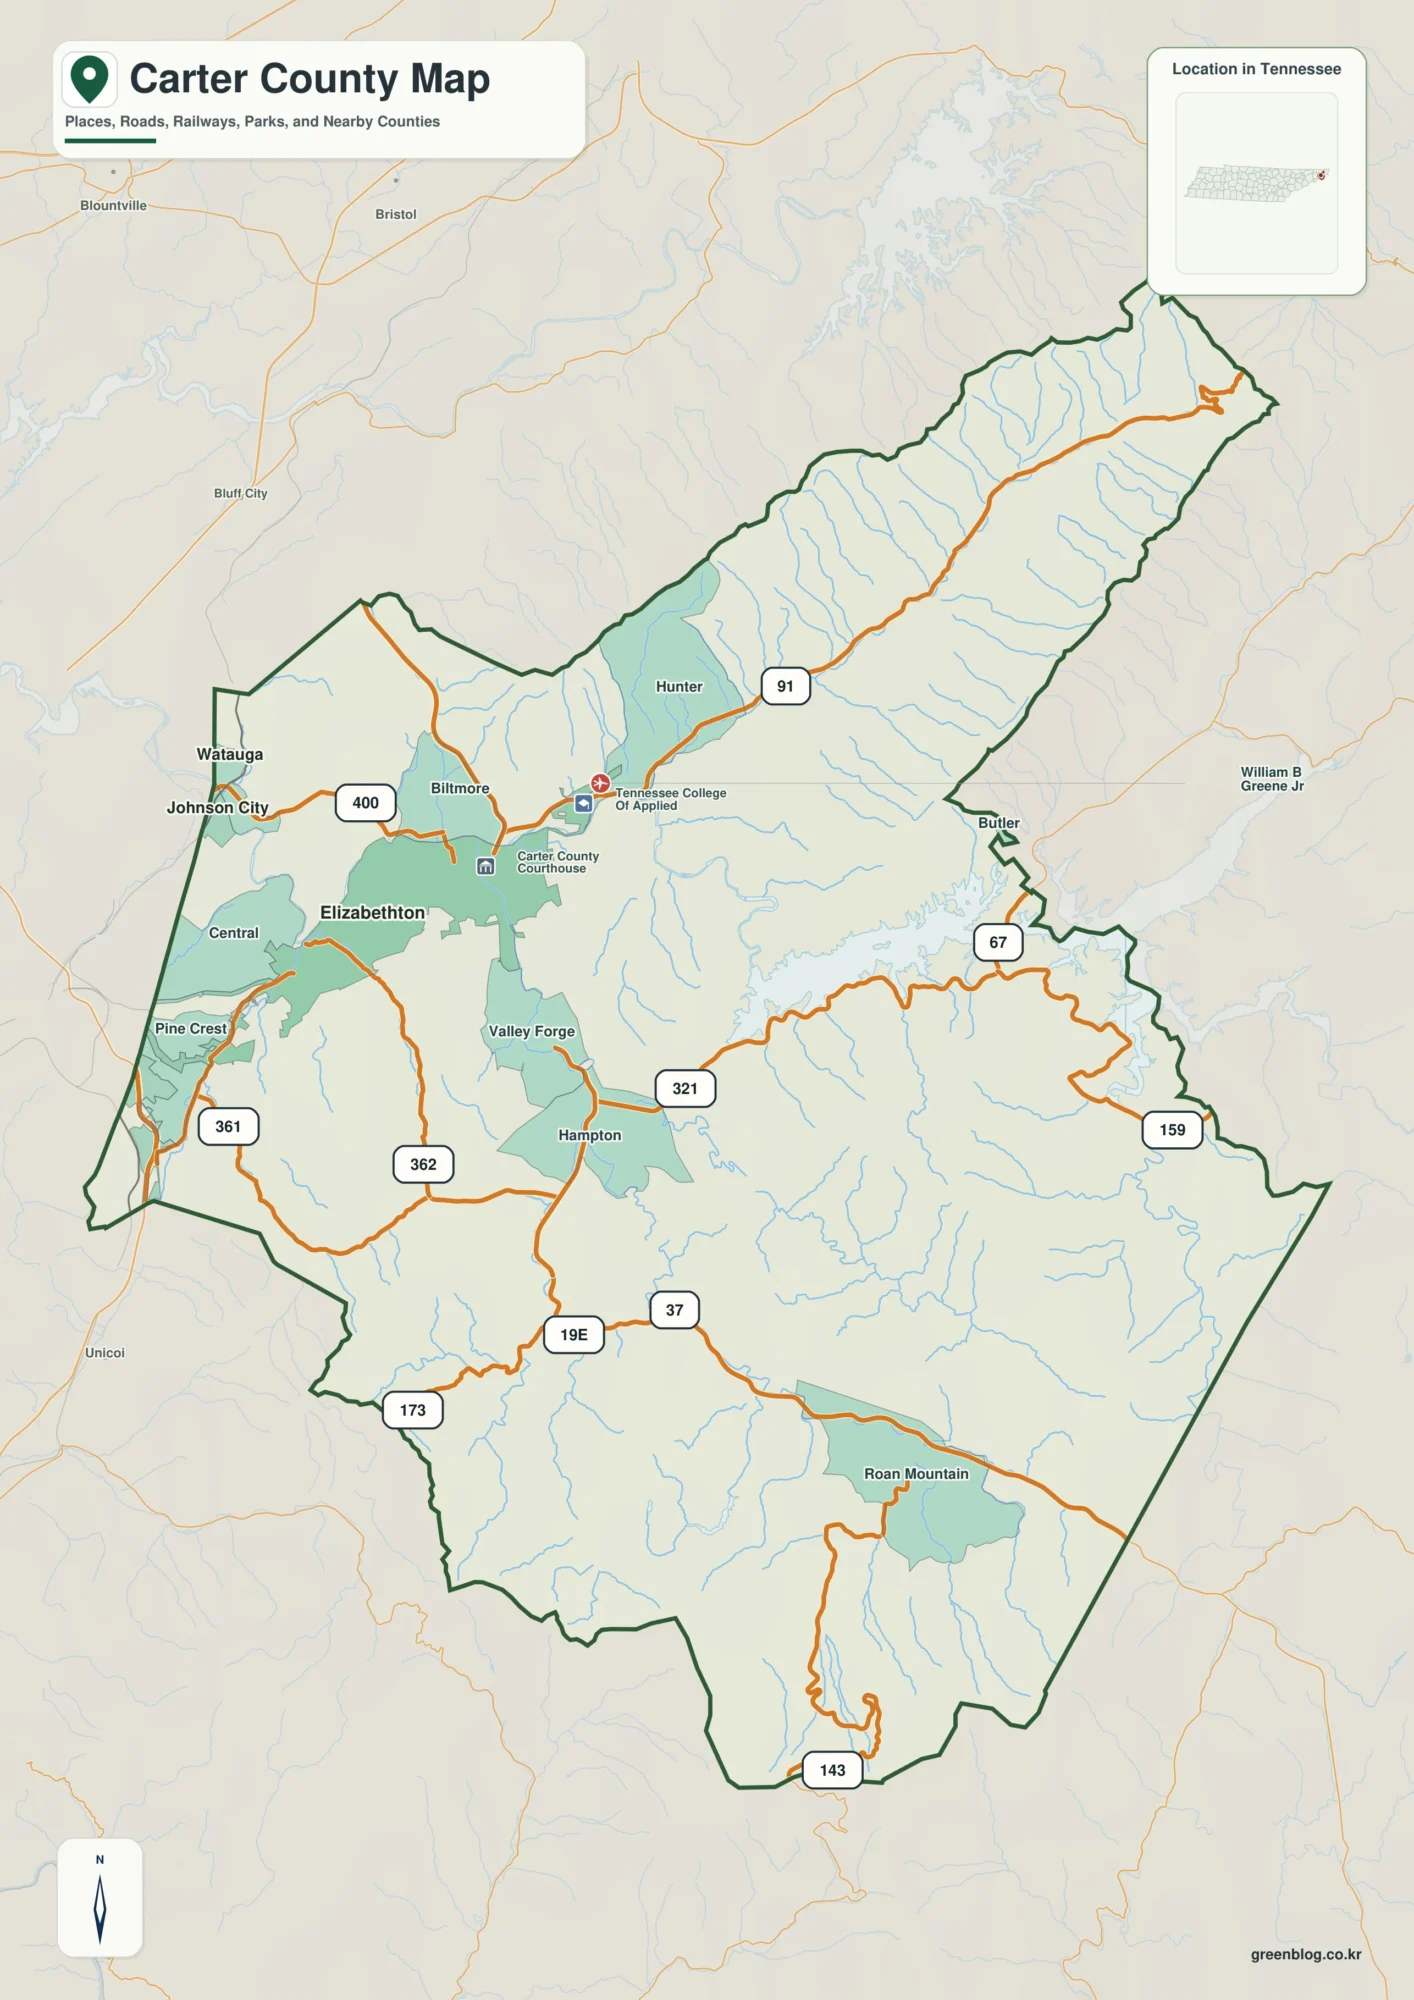
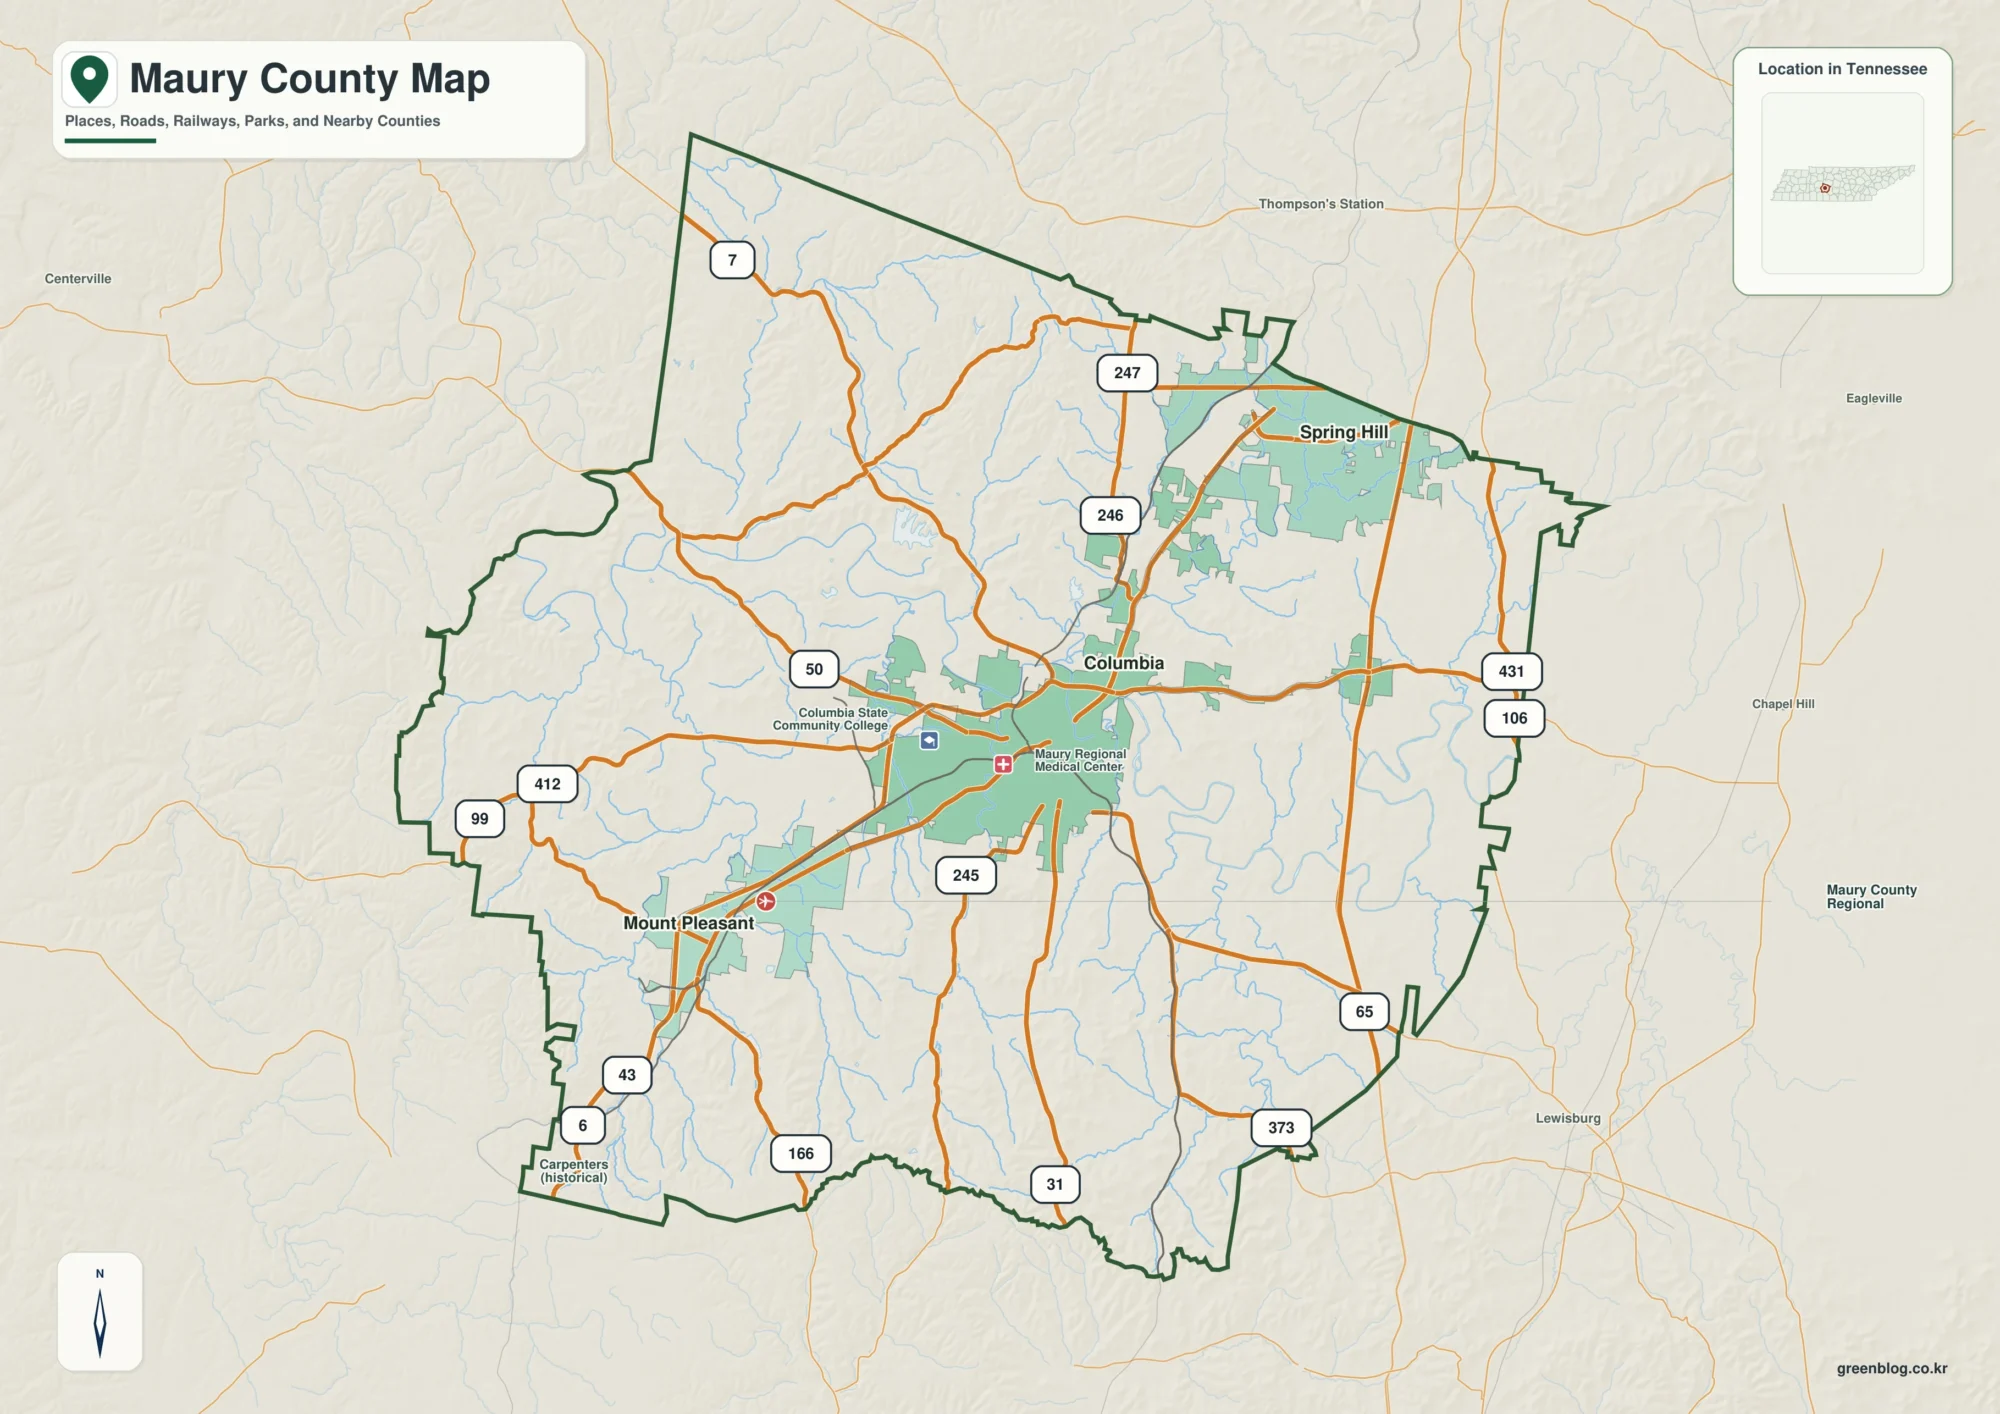
Hancock County sits along a broad series of Ohio River bends in northwestern Kentucky. Lewisport is the clearest western city marker, Hawesville anchors the eastern riverfront, and U.S. 60 links the two across the county’s northern side. South of that corridor, settlement labels become sparse while creeks, narrow valleys, and rolling ridges take over the map. The page combines road, city, water, and elevation views, and the four high-resolution JPG maps can be downloaded together in one ZIP after you review them on screen. High-resolution map files are available for download in the section below.
The Ohio River is the easiest feature to use for orientation because it wraps around much of the county’s north and east edge. Lewisport and Hawesville both sit close to that river boundary, while the county stretches much farther south into a quieter interior. Across the map set, this contrast appears repeatedly: a low northern river corridor with the two main cities, followed by a broader southern landscape of small tributaries and higher ridges.
Table of Contents
Lewisport and Hawesville form the main riverfront corridor
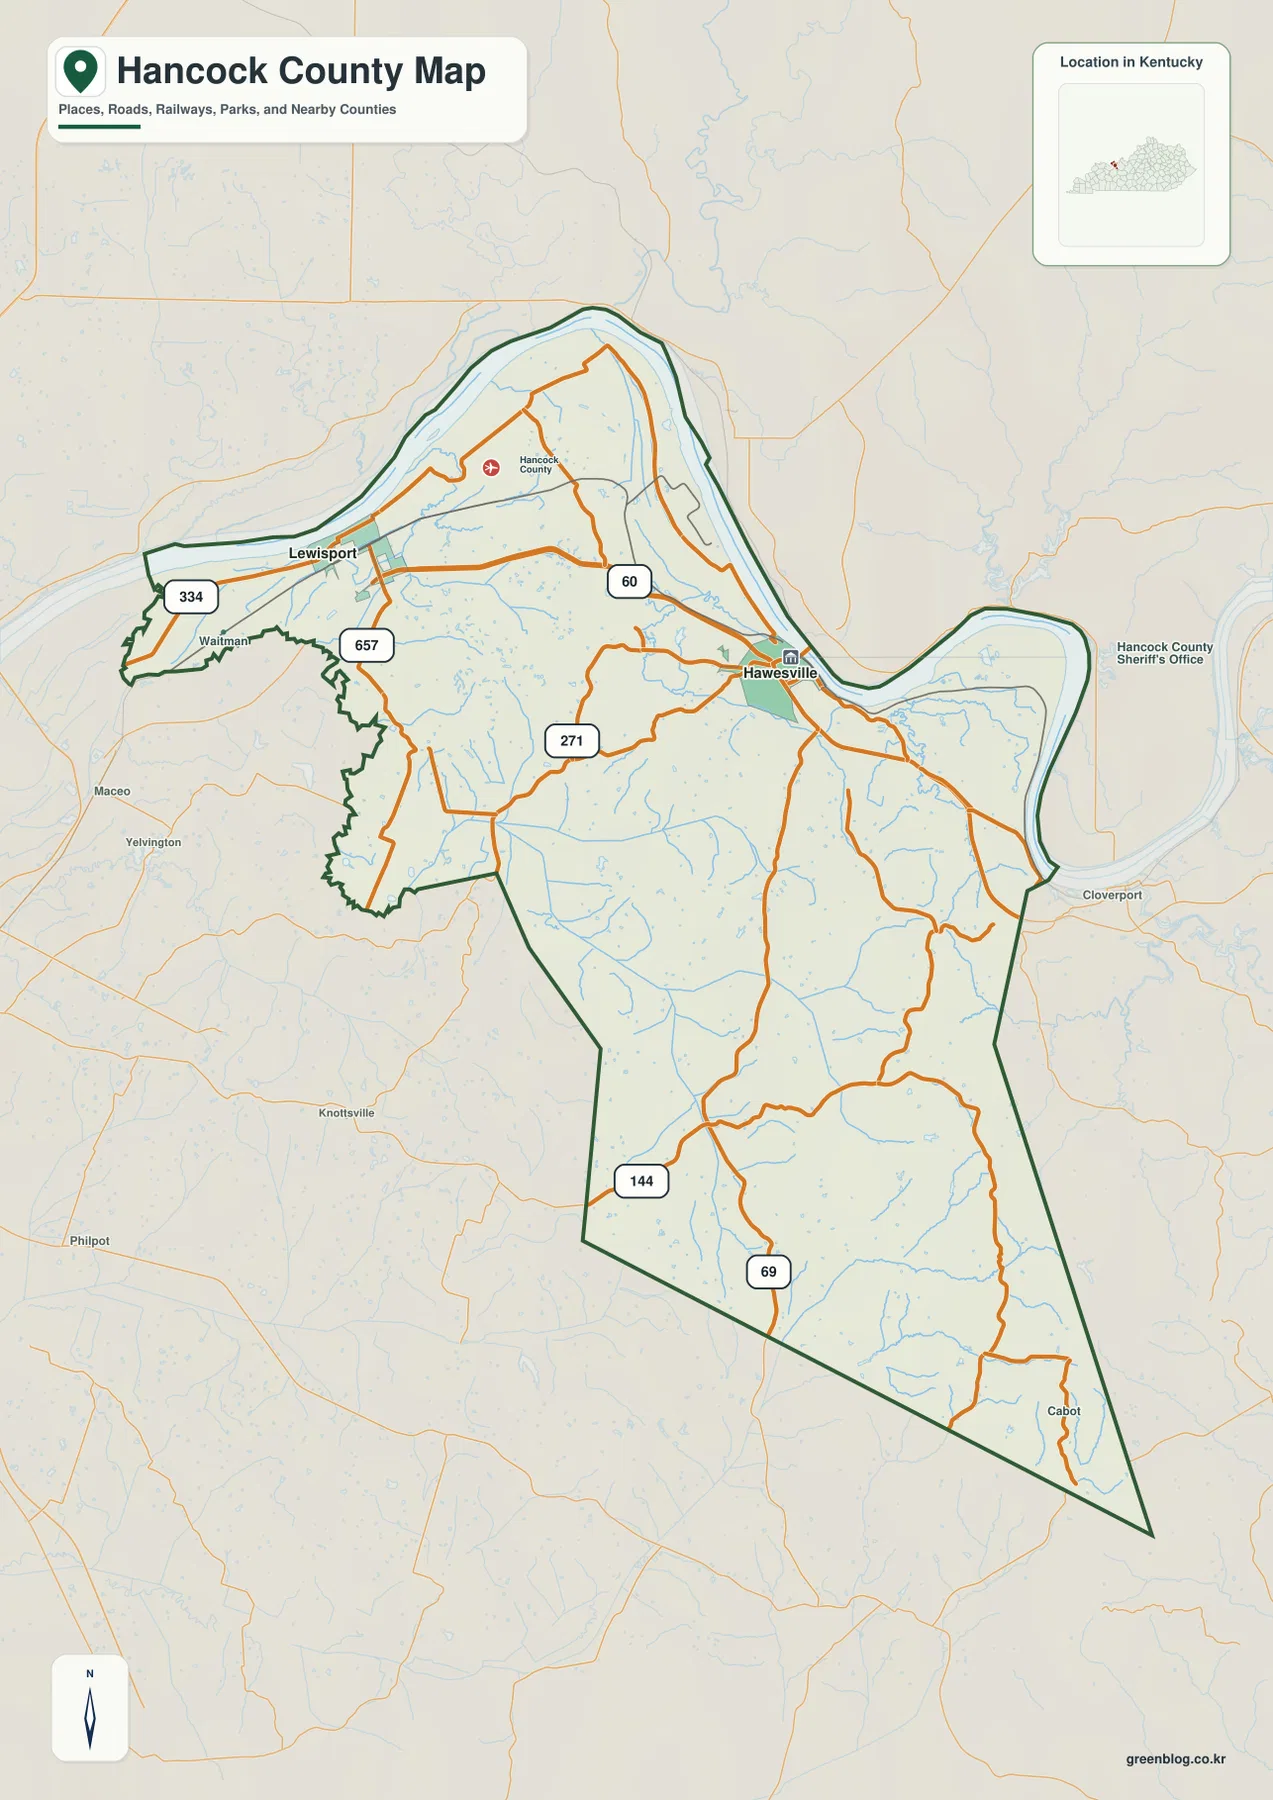
On the county map, Lewisport occupies the narrow northwestern extension of Hancock County and Hawesville sits farther east beside a pronounced bend of the Ohio River. U.S. 60 runs through this northern part of the county and provides the most obvious connection between the two communities. KY 334 appears west of Lewisport, while KY 657 and KY 271 help connect the riverfront area with the interior.
Hawesville is also the administrative reference point shown by official county sources. Kentucky.gov lists the Hancock County government address on Main Cross Street in Hawesville, and the county government’s own site uses the same community as its main office location. That makes Hawesville useful for more than road orientation: it is a practical starting point when relating the map to county services and local government information.
Farther south, KY 144 and KY 69 stand out on the map, but the road pattern is less concentrated than it is along U.S. 60. Roads bend through smaller valleys instead of crossing a continuous urban area. Outside the county line, names such as Cloverport to the east and Maceo, Yelvington, and Knottville to the west and southwest help place Hancock County within the surrounding part of Kentucky. These neighboring labels are especially useful because the county outline is irregular along the Ohio River.
Both ranked cities are concentrated near the Ohio River
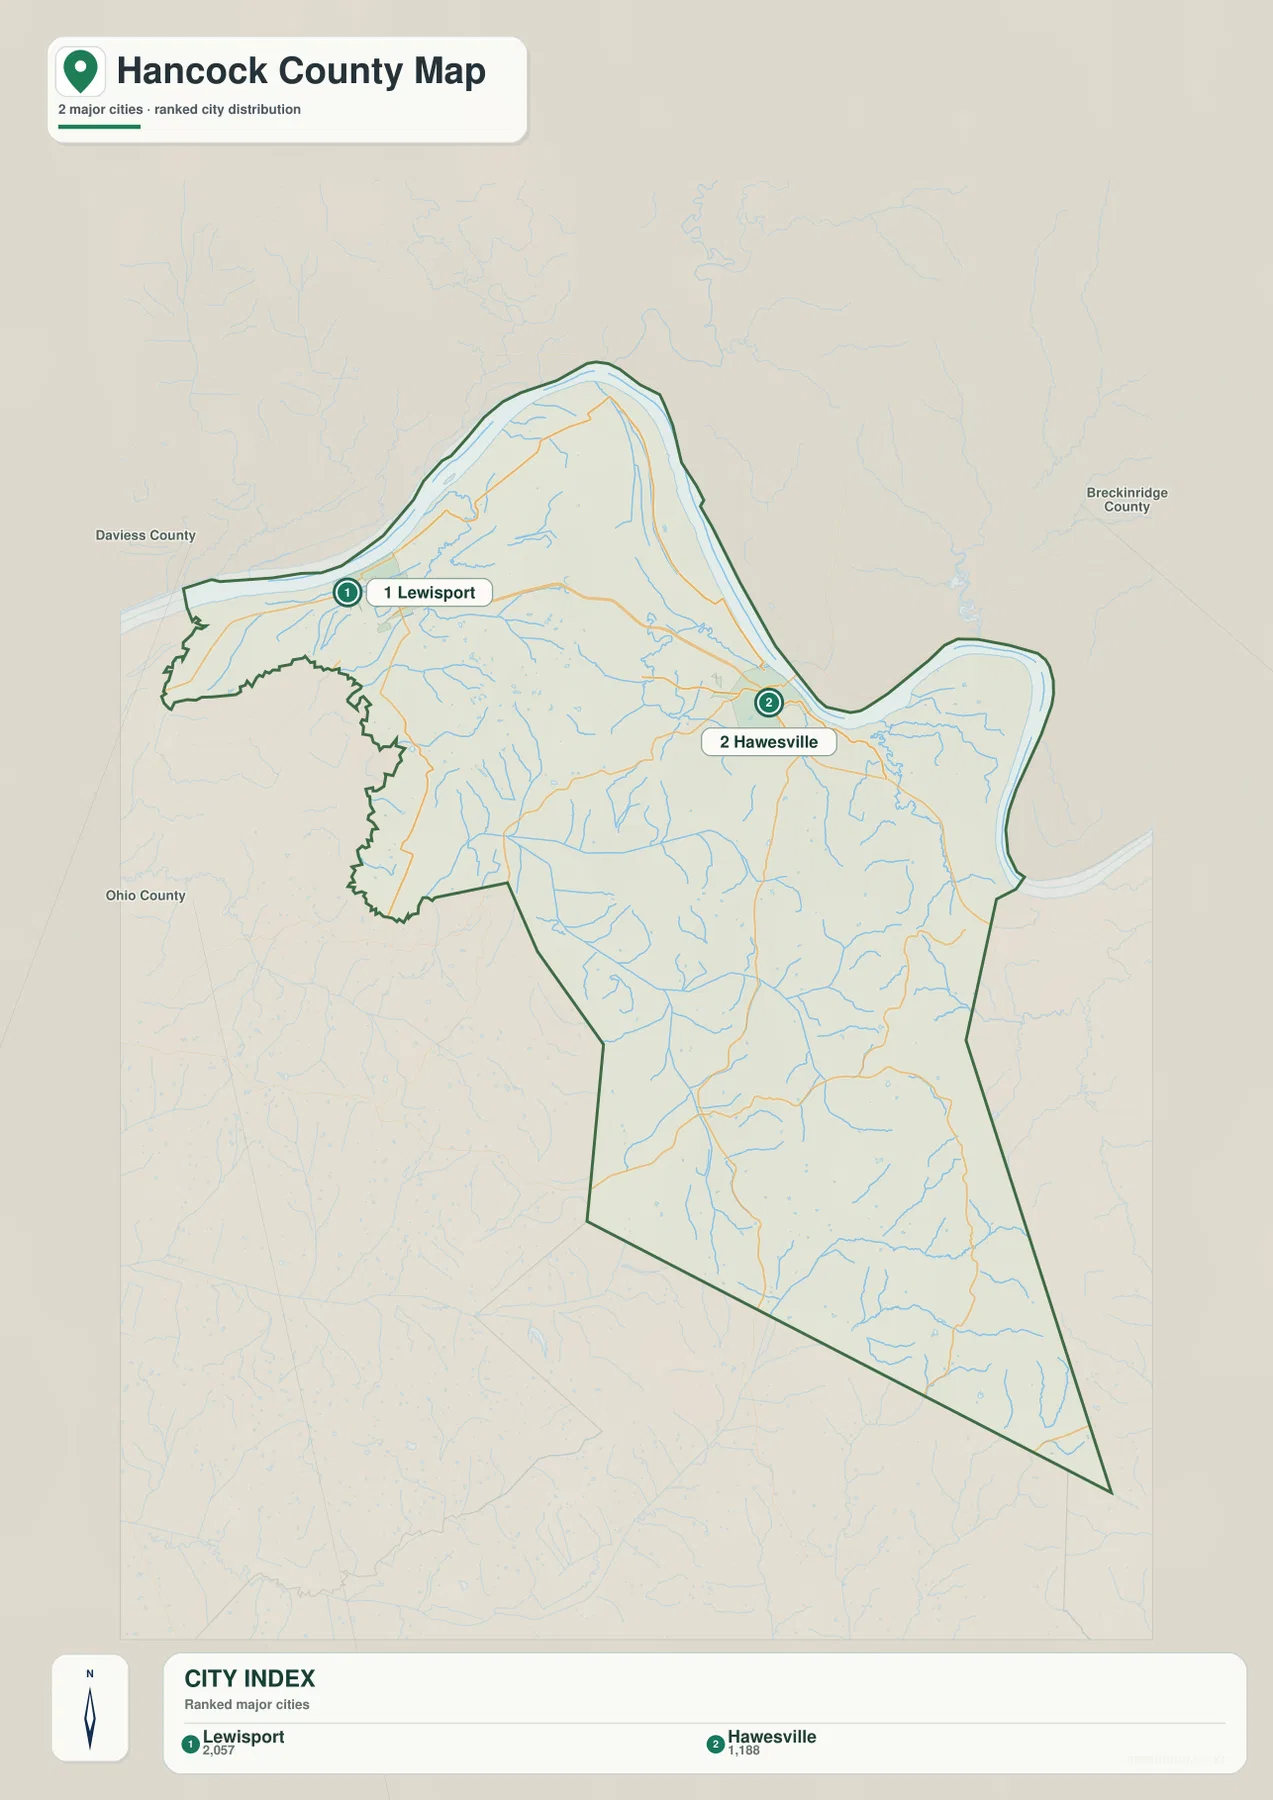
The city map identifies two major cities in Hancock County: Lewisport and Hawesville. The map labels Lewisport at 2,057 and Hawesville at 1,188, providing a quick visual comparison of their relative size in the source used for this map. These figures are best treated as map reference values rather than live population counts; anyone needing the latest demographic estimate should check current U.S. Census Bureau data.
The location of the two cities tells an equally important story. Both are in the northern river corridor, even though Hancock County extends a long distance to the south. There is no comparable major-city marker in that southern portion. For someone learning the county, it is therefore useful to begin with Lewisport and Hawesville, then follow KY 271, KY 144, or KY 69 into the interior instead of trying to memorize the smaller road network all at once.
Lewisport works as the western riverfront anchor and Hawesville as the eastern one. The city map is intended to show distribution and relative location, not to replace a turn-by-turn route planner. Driving distance will depend on the actual roads and intersections used, so practical navigation should pair this city view with the county road map or a live navigation service.
Creeks branch south from the Ohio River into a dense valley network
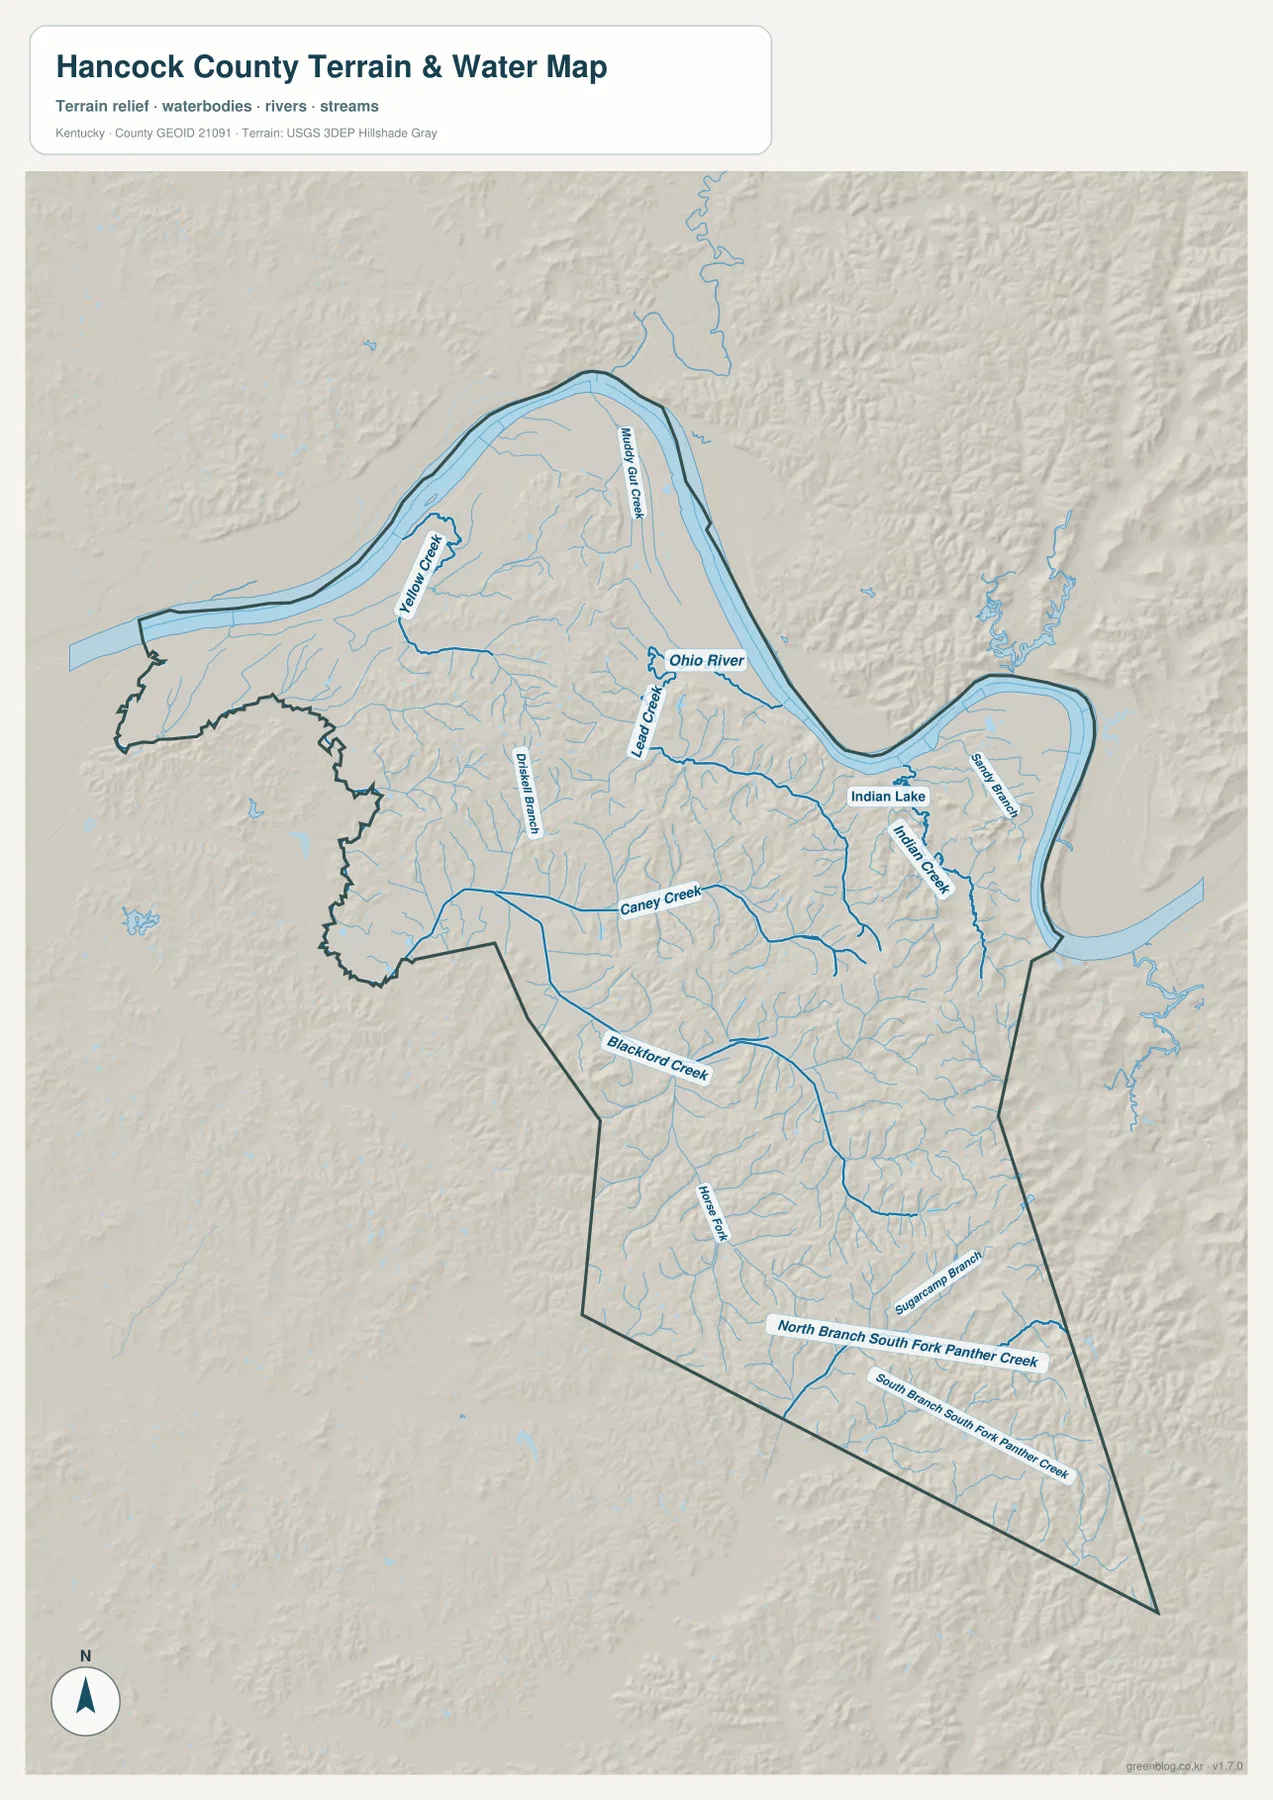
The terrain and water map is dominated by the Ohio River, which follows the northern edge and bends sharply around the eastern side of Hancock County. Near the northwestern riverfront, Yellow Bank Creek and Muddy Gut Creek are labeled, while Lead Creek reaches the river farther east. These tributaries make the broad river corridor easy to separate from the smaller drainage valleys farther inland.
Caney Creek crosses a large part of the central county and is one of the clearest interior water references. East of it, Indian Lake and Indian Creek stand out near the Hawesville side, with Sandy Branch nearby. Blackford Creek appears farther south and west, and Horse Fork marks another interior drainage line. Together they show that the southern half of the county is cut by many small valleys even though it lacks large city labels.
In the southern section, Sugarcamp Branch and the North Branch and South Branch of South Fork Panther Creek are labeled across the ridge-and-valley terrain. Those names are useful when a road or rural location is easier to identify by a creek than by a nearby city. This is a static water-reference map, however, not a flood-hazard, real-time river-stage, navigation, or legal water-boundary product. Official hydrologic sources should be used for those purposes.
Elevation rises from the river lowlands toward the southeast
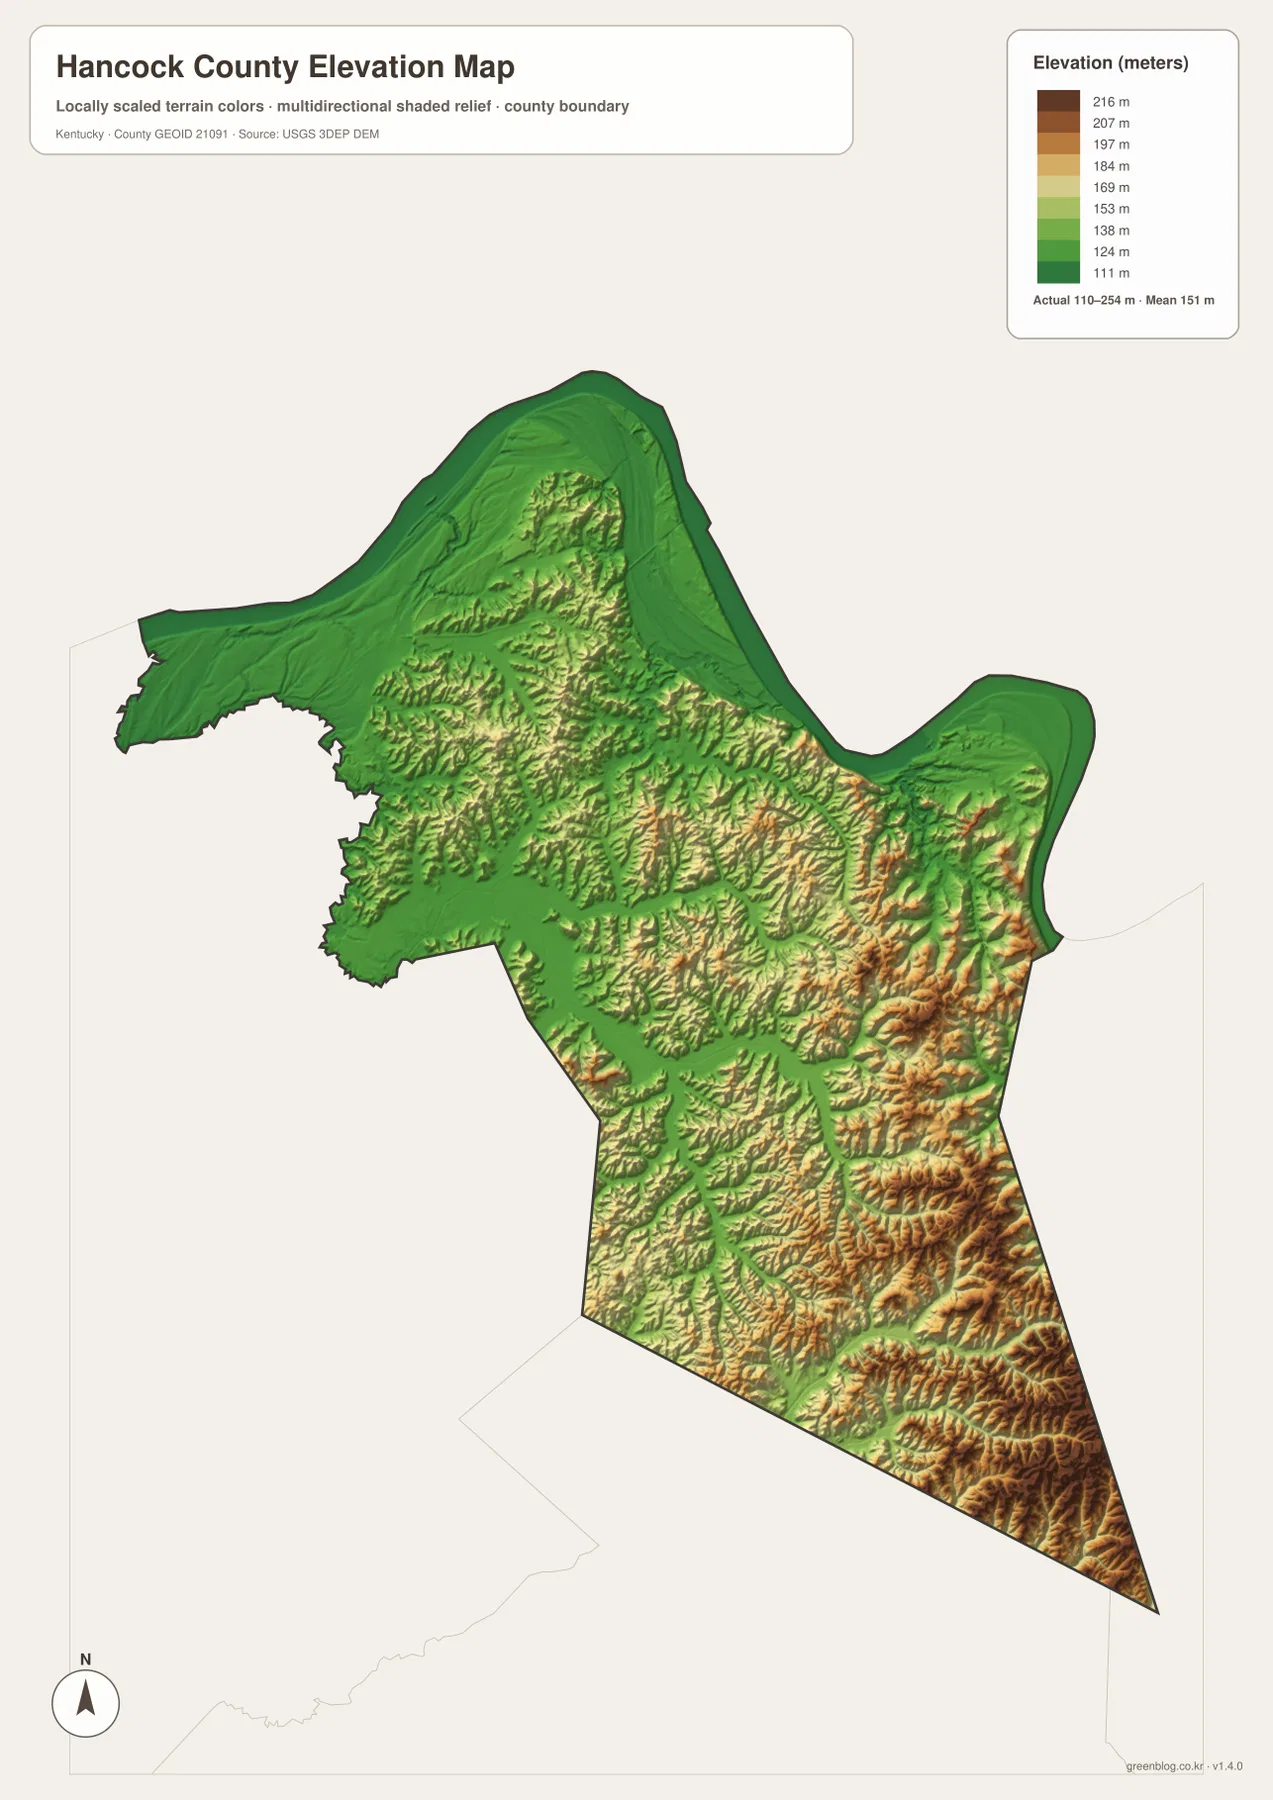
The elevation map reports an actual range of about 110 to 254 meters, with a mean elevation of 151 meters. The lowest green tones follow the Ohio River along the north and east margins, including the general vicinity of Lewisport and Hawesville. Tributary valleys such as Yellow Bank Creek and Lead Creek also appear lower than the ridges around them, linking the elevation pattern directly to features on the water map.
Higher colors become more common moving into the central and southern interior, and the most rugged bands are concentrated toward the southeast. There, narrow ridges repeat closely and are separated by small stream valleys. Caney Creek, Blackford Creek, and the Panther Creek branches occupy lower channels between these uplands, so comparing the water and elevation maps side by side makes the shape of the terrain much easier to understand.
The relief also helps explain the road pattern. U.S. 60 stays within the relatively low northern corridor, while roads in the southern part of the county have to follow a more broken landscape of valleys and ridges. The elevation surface is generalized for county-scale viewing, so it should not be treated as a survey-grade height measurement for a parcel, building site, engineering project, or construction decision. USGS elevation data or professional survey information is more appropriate for those tasks.
A small county between Owensboro and Louisville with a strong river orientation
Hancock County Government describes the community as being between Owensboro and Louisville, a useful regional clue that is not obvious from the county outline alone. Within the map itself, the Ohio River and U.S. 60 provide the clearest large-scale references. Lewisport marks the western part of the populated river corridor, while Hawesville serves as the eastern city and government center.
For practical map reading, the best starting point depends on what you are trying to locate. For roads and addresses, begin with Lewisport or Hawesville and then trace U.S. 60 or the numbered state roads toward the interior. For water features, start with the Ohio River, Caney Creek, and Indian Lake. In the southern countryside, Blackford Creek and the Panther Creek branches can be more useful landmarks than a city name because the settlement pattern is much more dispersed.
The four views work best as complementary references rather than as competing versions of the same map. The county map provides roads, labels, and the boundary; the city map strips the picture down to the two ranked urban centers; the terrain and water map emphasizes rivers, creeks, and lakes; and the elevation map explains why the northern riverfront looks different from the ridged southeast. Comparing two relevant layers is usually more informative than trying to force every question onto a single map.
Use the high-resolution JPG files for printing and close comparison
The WebP images on the page are convenient for quick viewing, while the original JPG files in the ZIP are better when you want to enlarge road labels, creek names, or elevation colors. The archive includes separate county, city, terrain-and-water, and elevation maps, allowing you to choose the file that fits a classroom handout, printed reference, local comparison, or personal research project.
If the question is how Lewisport and Hawesville connect, the county map is the most direct choice. If the focus is the relationship between the Ohio River and interior tributaries, the water map provides more detail. For explaining why the southeastern road network looks more winding than the northern river corridor, the elevation map adds the missing terrain context. These files share the same county subject, but they are reference maps rather than substitutes for legal boundary records, engineering data, or live navigation.
Frequently Asked Questions
Where are Hancock County’s two main cities located?
Lewisport and Hawesville are both near the Ohio River on the northern side of the county. Lewisport is the western city marker and Hawesville is farther east beside a large river bend. U.S. 60 links the two areas and is the easiest road reference for understanding the county’s populated northern corridor.
Which waterways besides the Ohio River appear on the map?
The terrain and water map labels Yellow Bank Creek, Muddy Gut Creek, Lead Creek, Caney Creek, Indian Creek, Blackford Creek, Horse Fork, Sugarcamp Branch, and branches of South Fork Panther Creek. Indian Lake is also labeled in the eastern interior. These features are shown for geographic reference, not for flood or real-time water conditions.
How much elevation change is shown across Hancock County?
The elevation map shows an actual range of about 110 to 254 meters and a mean of 151 meters. The Ohio River corridor is the lowest broad area, while higher and more closely spaced ridges become common toward the central and southeastern parts of the county. Use USGS elevation data or a professional survey when an exact site elevation is required.
Map File Information
Download the Hancock County boundary and road map, city map, terrain and water map, and elevation map as high-resolution JPG originals.
- Included Files: county map, city map, terrain and water map, elevation map
Related Maps
Sources and Reference Links
For local government and county information, see Hancock County Government and the Kentucky.gov Hancock County profile. Boundary and road references are available from U.S. Census Bureau TIGER/Line and Kentucky Transportation Cabinet Printable Maps. Water and elevation references are available from USGS National Hydrography and the USGS 3D Elevation Program.
Green Map creates custom-edited map images using open geographic data sources such as geoBoundaries, Natural Earth, OpenStreetMap, and government open data. These maps are edited visual materials, not raw data files, and are provided for education, documents, presentations, and graphic reference.