Greenup County sits at Kentucky’s northeastern edge, where the Ohio River wraps around the county and a string of communities follows the river from South Shore through Greenup toward Worthington, Wurtland, Raceland, Flatwoods, and Russell. The maps on this page show that riverfront settlement pattern along with U.S. 23, interior state highways, Greenbo Lake, the Little Sandy River system, and terrain ranging from about 147 to 362 meters. Four high-resolution JPG maps are also available in one ZIP file for printing, teaching, and detailed local reference. High-resolution map files are available for download in the section below.
The county changes quickly once you leave the Ohio River corridor. The eastern river towns occupy lower, more connected ground, while the western and southwestern interior is cut by narrow valleys and closely spaced ridges. Greenbo Lake, Tygarts Creek, and the Little Sandy River add useful landmarks between those two settings. Looking at roads, water, and elevation together makes the county’s geography much easier to understand than a place-name list alone.
Table of Contents
Riverfront towns form a long corridor beside the Ohio River
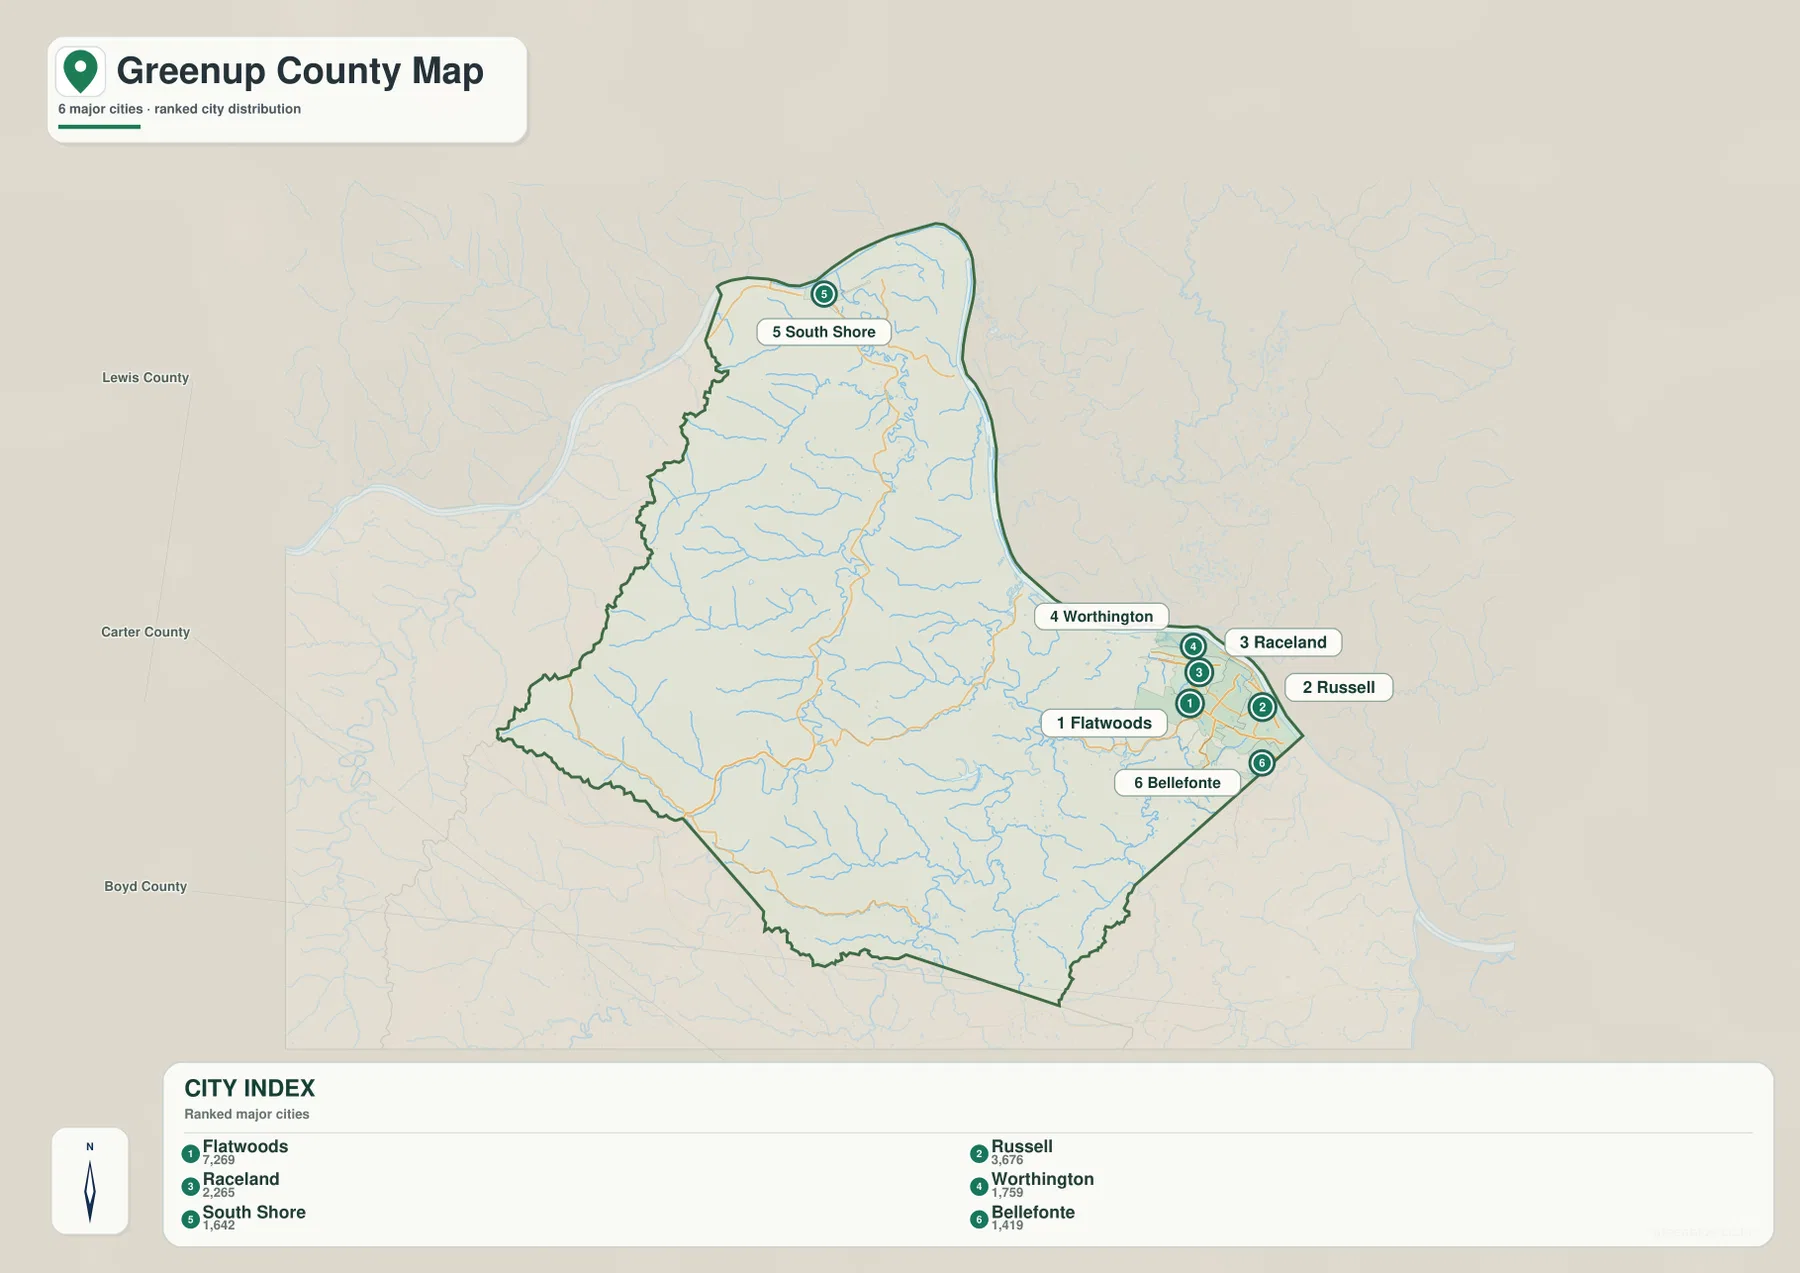
The county map is dominated by the Ohio River along the north and east. South Shore sits inside the broad northern bend, while the city of Greenup appears farther downstream near the point where the county narrows toward its eastern urban corridor. From there, Worthington, Wurtland, Raceland, Flatwoods, Russell, and Bellefonte cluster in a relatively compact area. That concentration is striking because much of the western half of the county contains roads and streams but few comparable urban labels.
U.S. 23 follows the Ohio River side of the county and provides the clearest road reference for the eastern communities. Near Greenup, KY 827 connects into the riverfront network. KY 207 and KY 503 lead into the southern interior, while KY 1 and KY 784 cross the lower part of the county. Farther west, KY 7, KY 2, and KY 10 serve a much more rural landscape. These roads help show the contrast between the closely spaced river towns and the more scattered interior valleys.
Nearby places outside the boundary also make orientation easier. Ashland and Westwood appear beyond the southeastern edge, while Garrison lies west of the county across the Ohio River corridor. If you are locating a small road or rural address, it is usually simplest to begin with U.S. 23 or one of the river towns, then follow the numbered state road that reaches into the interior. The map is designed for regional orientation rather than turn-by-turn navigation, so current routing services are still better for travel times and closures.
Flatwoods and Russell anchor the county’s densest city cluster
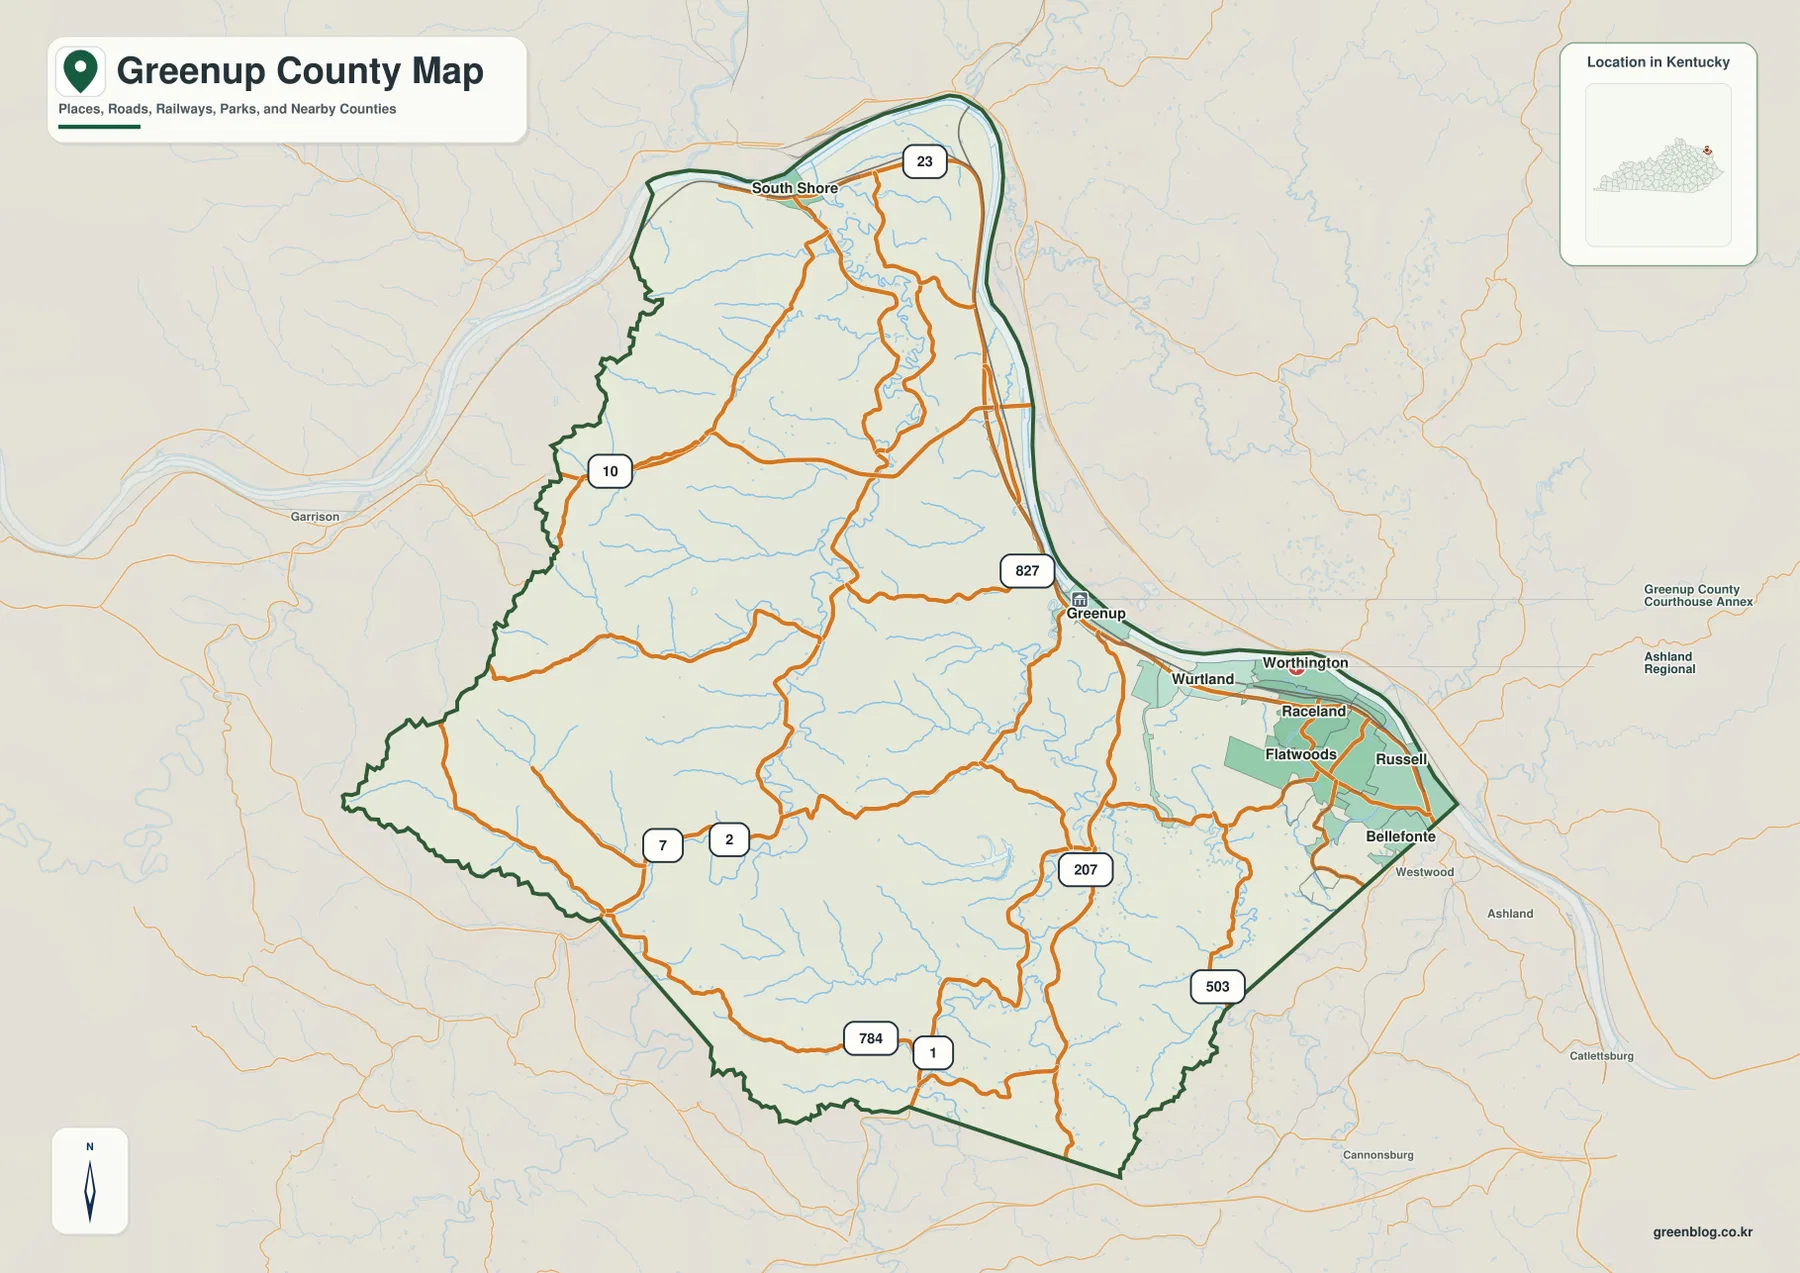
The city index simplifies the county to six ranked cities. The values printed on the map list Flatwoods at 7,269, Russell at 3,676, Raceland at 2,265, Worthington at 1,759, South Shore at 1,642, and Bellefonte at 1,419. These figures are most useful for comparing the relative scale of the mapped cities; anyone needing the latest official population count should check current Census data rather than treating the map label as a live statistic.
Five of the six ranked cities sit in the eastern portion of the county. Flatwoods, Russell, Raceland, Worthington, and Bellefonte form a tight group, and the general county map adds Wurtland and Greenup nearby. South Shore is the exception. It stands well to the north near the large bend of the Ohio River, separated from the eastern cluster by a long stretch of hills, creeks, and local roads.
This distribution helps explain why a single “center” is not enough for reading Greenup County. The eastern communities work as one useful urban reference, South Shore provides a second reference at the northern end, and Greenup serves as a clear named point between the two. The city map does not draw route lines or driving distances, so its strength is showing concentration and relative position rather than estimating travel time.
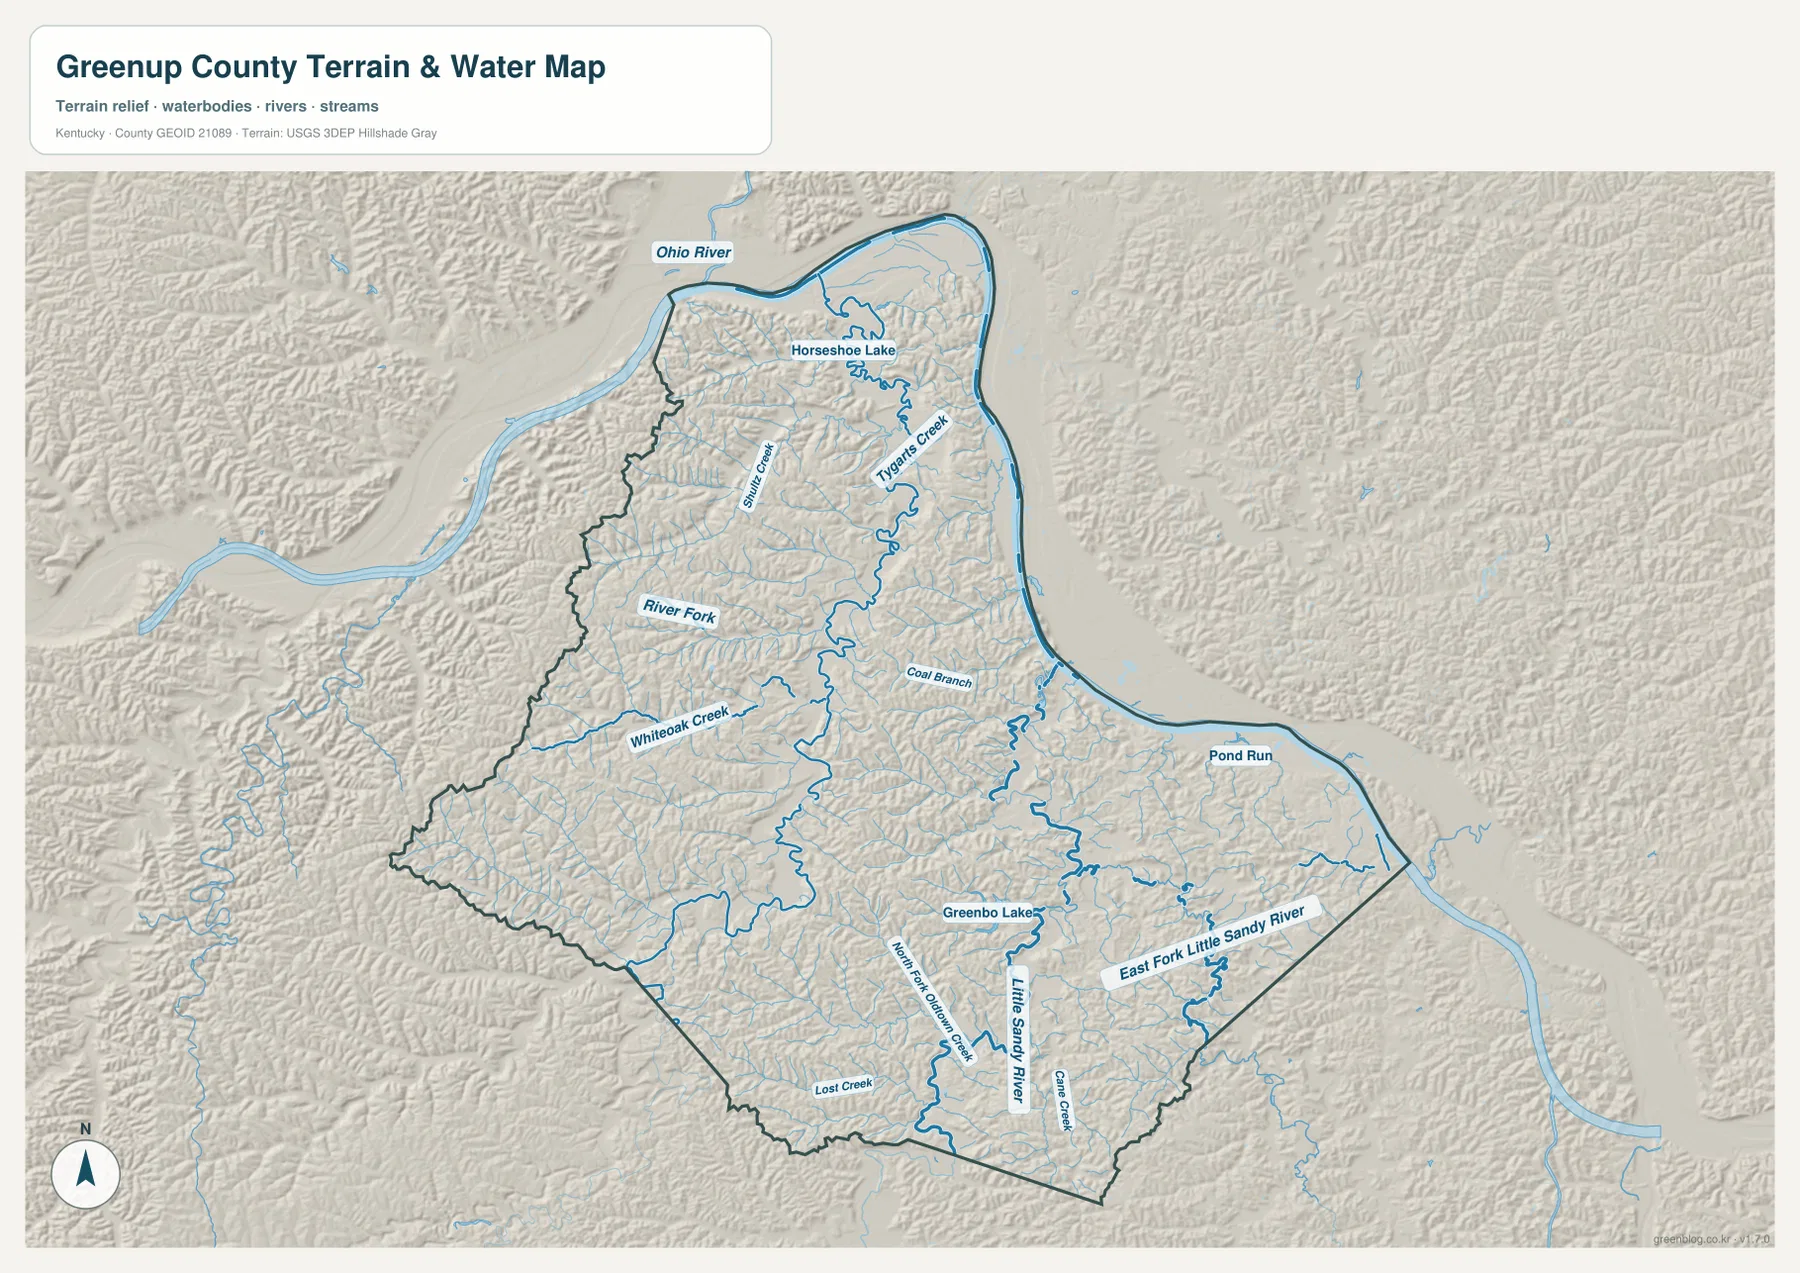
The Ohio River, Greenbo Lake, and Little Sandy River define three different water settings
The Ohio River is the largest water feature and forms a long boundary around the north and east. Its broad valley is very different from the narrow interior drainage lines. Horseshoe Lake appears inside the northern bend, and Shultz Creek and Tygarts Creek run through the northern and central interior before joining the Ohio River side of the county. Whiteoak Creek and River Fork mark additional valleys farther west.
Greenbo Lake is an important inland landmark near the center of the county. Kentucky State Parks describes the lake at Greenbo Lake State Resort Park as 225 acres, large enough to stand out clearly from the surrounding creeks on the water map. Coal Branch and Pond Run lie toward the river side, while the hillshade around Greenbo Lake shows how the lake occupies a lower basin between ridges rather than a broad flat plain.
Farther south and east, the Little Sandy River and East Fork Little Sandy River create another drainage setting. Cane Creek and Lost Creek are among the smaller named streams in this part of the map. Together these features show that Greenup County is not simply an Ohio River county: interior streams and the Little Sandy system cut across the hills and create many of the valleys followed by local roads. This map is a static reference for water locations, not a flood-risk, legal-boundary, live-stage, or navigation product.
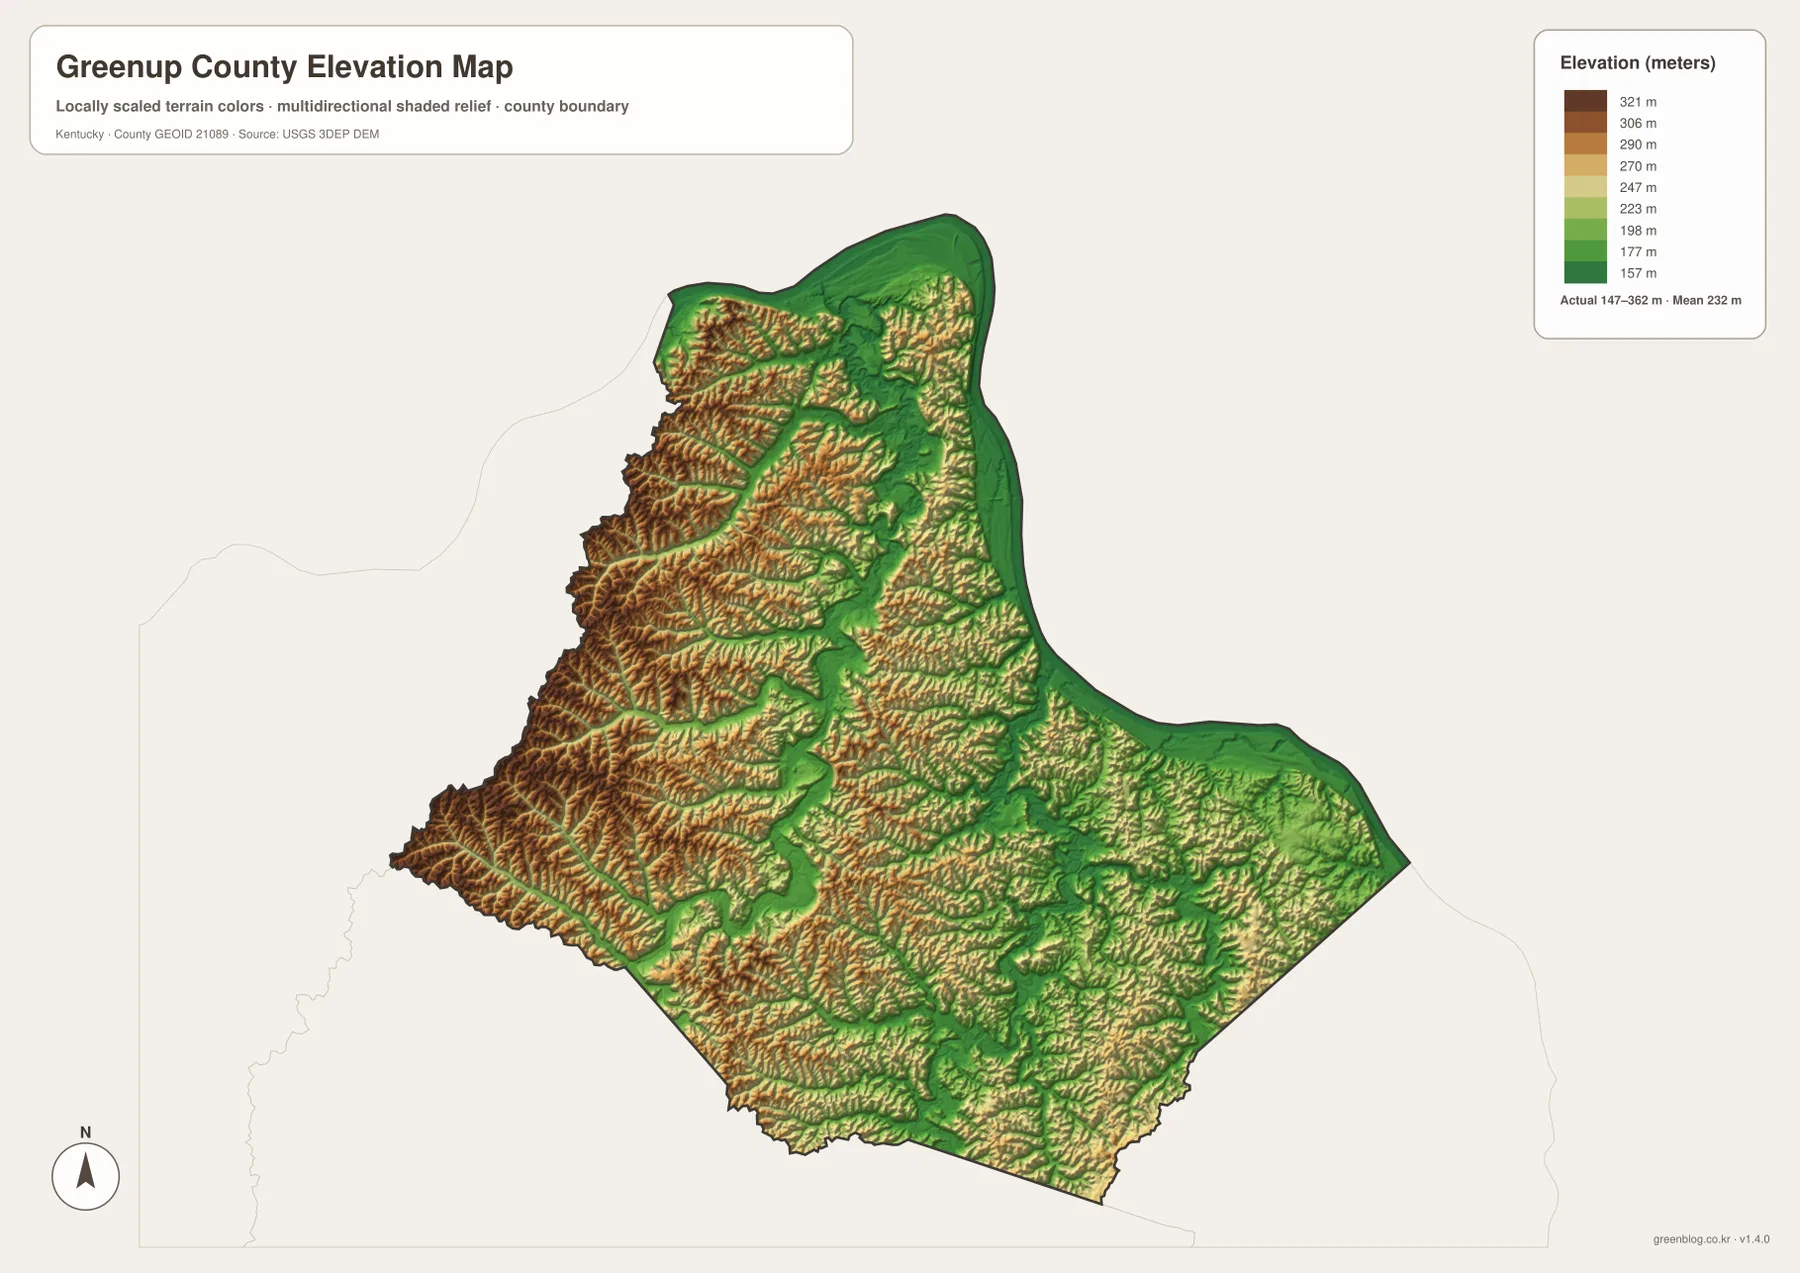
A 147–362 m elevation range separates river lowlands from western ridges
The elevation map shows an actual range of about 147 to 362 meters, with a mean of 232 meters. The lowest green terrain follows the Ohio River and extends through the eastern urban corridor. Lower ground also traces Tygarts Creek and the Little Sandy River system, matching many of the blue channels on the water map. These corridors stand out because the surrounding hills rise quickly on both sides.
The western and southwestern interior is much higher. Brown and tan ridge tops form dense, branching patterns near the western boundary, and many short hollows cut into that higher ground. The northwest interior is also distinctly higher than the low Ohio River edge near South Shore. This contrast is one of the clearest reasons to use the elevation map alongside the road map: roads that look indirect on a flat map often make more sense once the ridges and valleys are visible.
U.S. 23 benefits from the lower river corridor, while roads such as KY 1, KY 2, KY 7, and KY 10 cross more broken interior terrain. The elevation surface is generalized for county-scale comparison, so it should not be used as a survey-grade height source for a parcel, building site, bridge, or engineering project. For those purposes, the underlying USGS elevation data or a professional survey is more appropriate.
Greenbo Lake adds an inland landmark beyond the river cities
Greenup County’s official website highlights the Ohio River and local attractions, and the county tourism pages feature Greenbo Lake among the places visitors can explore. On the maps, Greenbo Lake is useful even if you are not planning a park visit because it provides a recognizable inland point between the western hills and the eastern river towns. That makes it easier to describe locations that would otherwise be identified only by small roads or creek names.
A practical way to learn the county is to use three anchors: the Flatwoods–Russell–Raceland cluster in the east, South Shore in the north, and Greenbo Lake in the interior. Once those are familiar, Greenup, Worthington, Wurtland, Tygarts Creek, and the Little Sandy River can be placed relative to them. This approach works especially well because the county is elongated and its settlement pattern does not match the geometric center of the boundary.
For Greenbo Lake State Resort Park, the water map gives the clearest view of the lake basin and nearby drainage, while the county map is better for road orientation from the Ohio River communities. For the urban corridor, the city map strips away most terrain detail and makes the eastern concentration obvious. Switching between these views is more useful than expecting one map to answer every question.
Choose the map by whether you need roads, city concentration, water, or relief
Start with the general county map when the main task is locating communities, highways, or the county boundary. It is the best single view for following U.S. 23 along the Ohio River and then tracing KY 1, KY 2, KY 7, KY 10, KY 207, or KY 503 into the interior. Use the city index when you want a cleaner comparison of the six ranked cities and their strong eastern concentration.
The terrain and water map is better for Greenbo Lake, Tygarts Creek, Whiteoak Creek, the Little Sandy River, and other named drainage features. Pair it with the elevation map when you want to see why those streams occupy narrow green corridors between higher ridges. That combination is particularly helpful in the western half of the county, where topography is much more visually complex than the riverfront.
For printing or close inspection, the high-resolution JPG files in the ZIP are more useful than the smaller WebP previews shown in the article. The general map emphasizes roads and places, the city map emphasizes settlement concentration, the water map emphasizes rivers and lakes, and the elevation map emphasizes relief. Using two maps side by side usually gives the clearest picture of Greenup County’s riverfront communities and hillier interior.
Frequently Asked Questions
Where are the main cities concentrated in Greenup County?
Most of the ranked cities are in the eastern Ohio River corridor. Flatwoods, Russell, Raceland, Worthington, and Bellefonte occupy a relatively small area, with Wurtland and Greenup also nearby on the general map. South Shore is separated from that group and sits near the large northern bend of the Ohio River.
Can I find both Greenbo Lake and the Little Sandy River on the same map?
Yes. The terrain and water map shows Greenbo Lake near the center of the county and the Little Sandy River with its East Fork in the southeast. The same map also labels the Ohio River, Tygarts Creek, Whiteoak Creek, and several smaller streams, making it the best choice for comparing the county’s main water features.
Which parts of Greenup County are lowest and highest?
The elevation map shows an actual range of roughly 147 to 362 meters and a mean of 232 meters. Lower terrain follows the Ohio River and major stream valleys, while higher ridges are most prominent across the western and southwestern interior. For an exact point elevation, use official USGS source data or a survey rather than the generalized county map.
Map File Information
The ZIP includes high-resolution JPG versions of the Greenup County general map, city map, terrain and water map, and elevation map.
- Included Files: Use only the versions confirmed in the article and supplied images
- File Type: Use the confirmed download contents
- Intended Use: Printing, education, presentations, and map-based projects
Related Maps
Sources and references
County information and visitor context are available from the official Greenup County website, Greenup County Tourism, and the Kentucky State Parks page for Greenbo Lake State Resort Park. Boundary and road references include the U.S. Census Bureau TIGER/Line files and Kentucky Transportation Cabinet printable maps. Water and elevation references are available through USGS National Hydrography and the USGS 3D Elevation Program.
Green Map creates custom-edited map images using open geographic data sources such as geoBoundaries, Natural Earth, OpenStreetMap, and government open data. These maps are edited visual materials, not raw data files, and are provided for education, documents, presentations, and graphic reference.