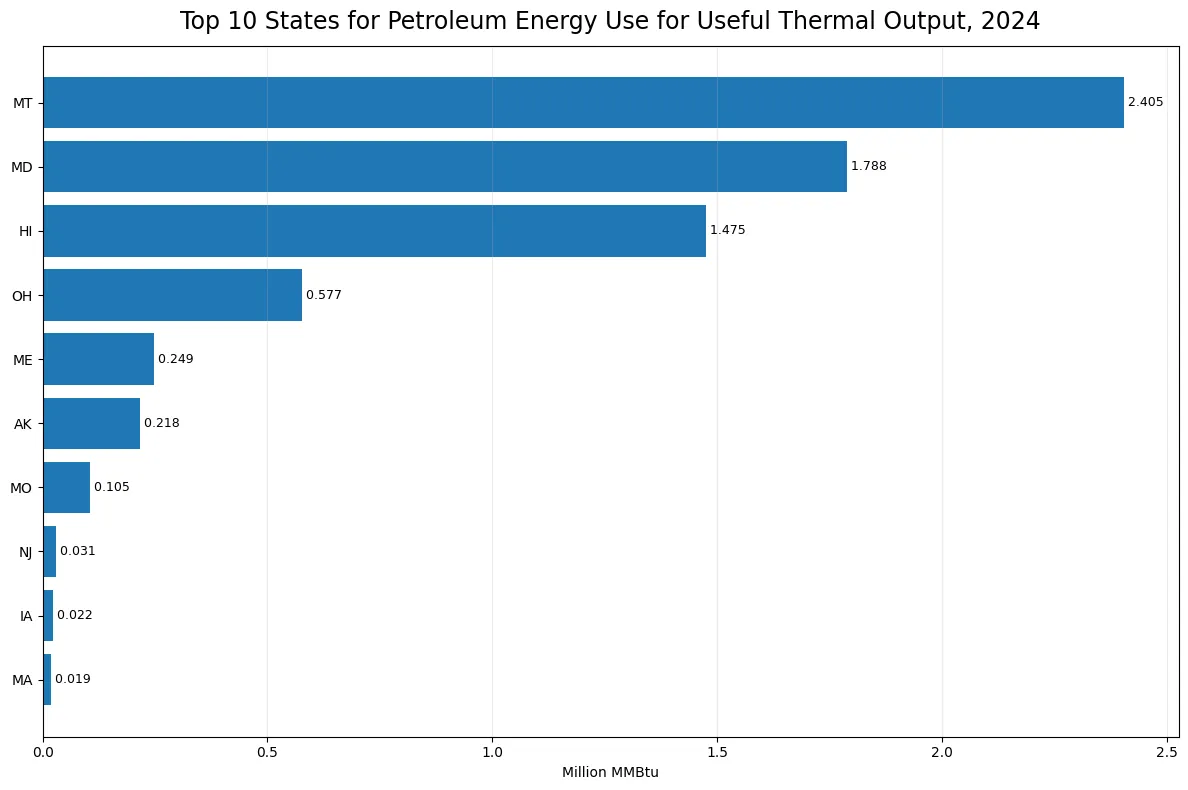
Montana had the largest 2024 petroleum energy input associated with useful thermal output in the U.S. Electric Power sector. Its value was 2.40541 million MMBtu, followed by Maryland at 1.78826, Hawaii at 1.47488, and Ohio at 0.57683. The 50 state observations sum to 6.93865 million MMBtu, with Montana accounting for 34.67% of that total. The EIA series is defined by fueltypeid=PET, sectorid=98, field=consumption-uto-btu, annual frequency, and 2024. The BTU field is important: this comparison measures the energy content of petroleum assigned to useful thermal output, not the physical volume of fuel in barrels.
The metric is narrower than total petroleum use and different from fuel consumed for electricity generation. It also should not be read as electricity output, useful-heat output, fuel cost, emissions, or petroleum’s share of a state’s power mix. PET is EIA’s broader Petroleum category rather than the narrower Petroleum Liquids category. Because the values are absolute energy inputs, a state with a high observation is not automatically more petroleum-dependent than another state. A dependence comparison would require a denominator such as total fuel input or total generation. The purpose here is to describe how the same narrowly defined energy-use series varies across states.
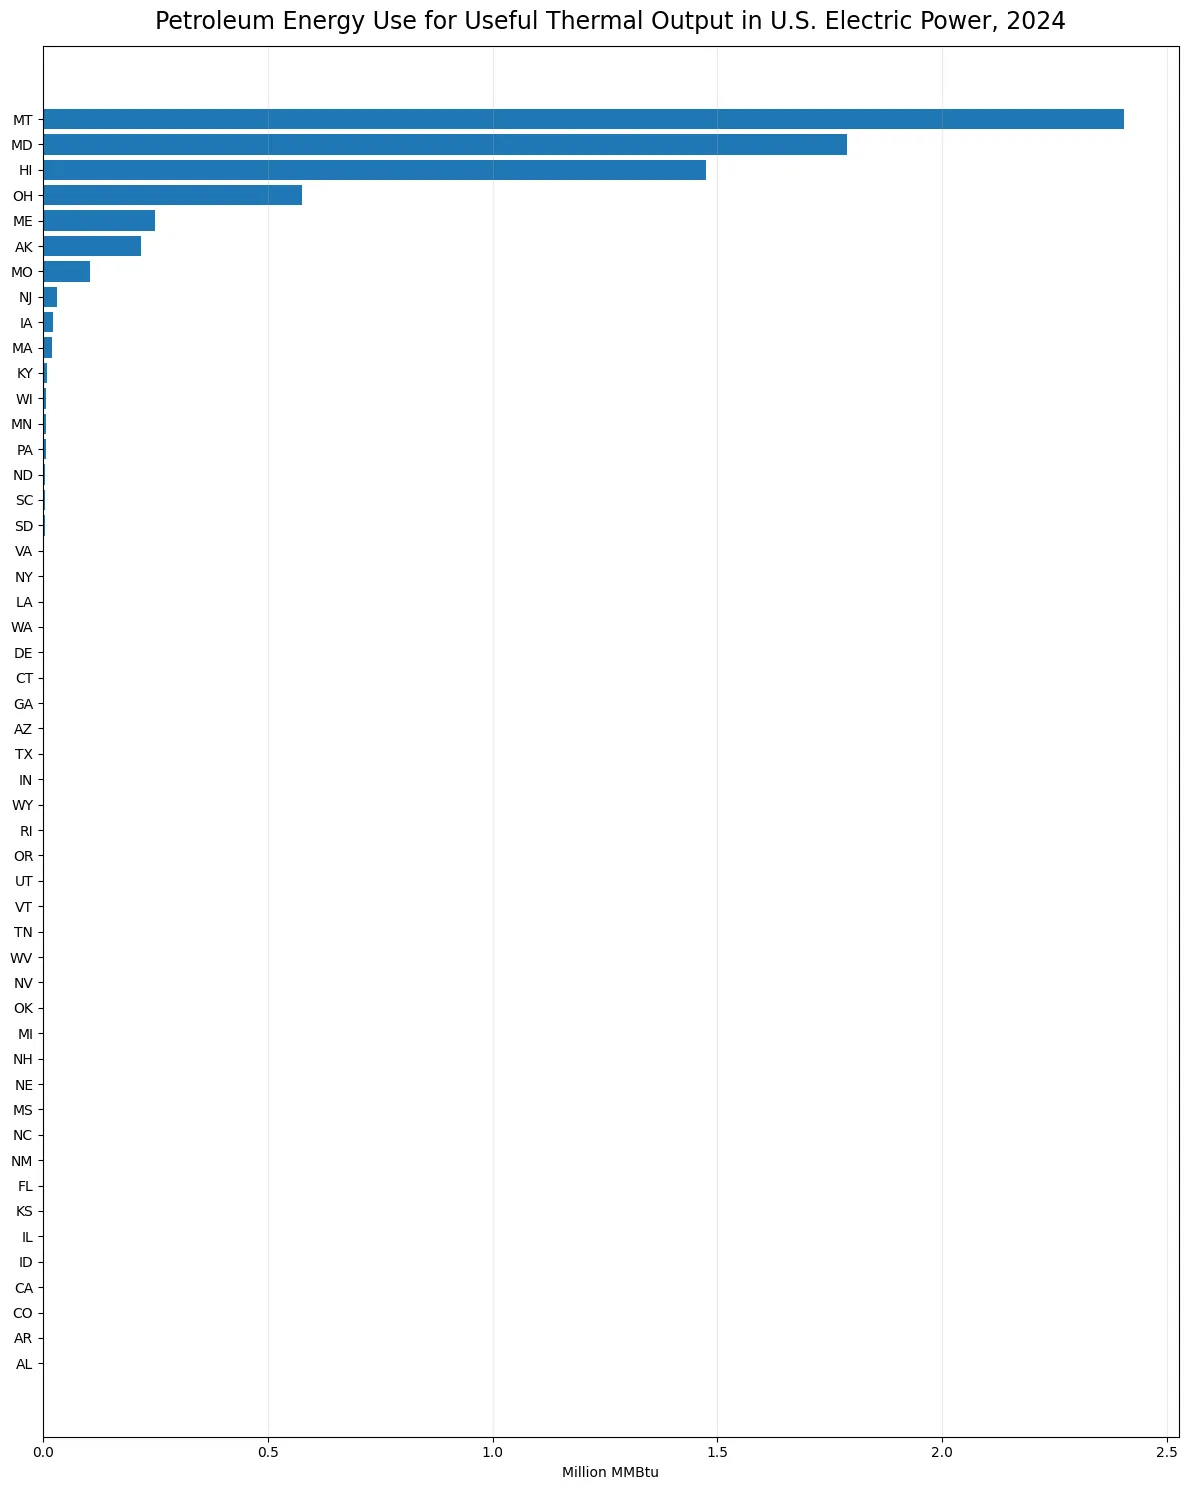
Table of Contents
Montana, Maryland, and Hawaii accounted for 81.70% of the state total
Montana contributed 34.67% of the 50-state sum, Maryland 25.77%, and Hawaii 21.26%. Together they reached 81.70%. The top five states accounted for 93.59% and the top ten for 99.29%. This concentration is the clearest feature of the 2024 distribution. The gap between Montana and Maryland was about 0.617 million MMBtu, while the gap between the leading states and the long lower tail was much larger. A handful of states therefore determines almost the entire state-level sum. That pattern makes average values less informative than they would be in a balanced distribution.
The mean is far above the median
The arithmetic mean is 0.138773 million MMBtu per state, while the median is only 0.000085. The first quartile is 0.000000 and the third quartile 0.006420 million MMBtu. The mean is roughly 1633 times the median because several large observations pull the average upward. Most states are either very small or exactly zero in this specific series. For that reason, the median, quartiles, number of zero observations, and cumulative share of the leading states give a more faithful picture than the mean alone. The distribution is strongly right-skewed rather than clustered around one typical level.
| State | Petroleum energy for useful thermal output (million MMBtu) | Share of 50-state sum |
|---|---|---|
| Montana | 2.40541 | 34.67% |
| Maryland | 1.78826 | 25.77% |
| Hawaii | 1.47488 | 21.26% |
| Ohio | 0.57683 | 8.31% |
| Maine | 0.24878 | 3.59% |
| Alaska | 0.21766 | 3.14% |
| Missouri | 0.10500 | 1.51% |
| New Jersey | 0.03064 | 0.44% |
| Iowa | 0.02236 | 0.32% |
| Massachusetts | 0.01937 | 0.28% |
Twenty-three states reported exactly zero in this series
Among the 50 states, 23 have a published value of 0.00000 and 27 have positive observations. There are 0 missing values, so the zero observations are not stand-ins for absent data. A zero must be interpreted narrowly. It means the PET, sector 98, consumption-uto-btu observation for that state and year is zero. It does not mean the state used no petroleum in transportation, industry, buildings, or even for electricity generation. Those activities belong to other EIA measures. Preserving this distinction prevents a specialized useful-thermal-output statistic from being mistaken for a general petroleum-use measure.
The smallest positive observations are close to zero but are still real values
Indiana is the smallest positive observation at 0.00001 million MMBtu, followed by Texas at 0.00002, Arizona at 0.00015, Georgia at 0.00018, and Connecticut at 0.00049. These values should not be rounded into the zero group merely because they are tiny relative to Montana or Maryland. In a highly concentrated distribution, the distinction between an exact zero and a small positive value carries information about whether any activity was recorded in the selected series. Keeping the original precision also makes later year-to-year comparisons more reliable, especially for states where the measure may move from a tiny value to a larger one.
| Lowest positive state | Petroleum energy for useful thermal output (million MMBtu) |
|---|---|
| Indiana | 0.00001 |
| Texas | 0.00002 |
| Arizona | 0.00015 |
| Georgia | 0.00018 |
| Connecticut | 0.00049 |
| Delaware | 0.00089 |
| Washington | 0.00113 |
| Louisiana | 0.00129 |
| New York | 0.00201 |
| Virginia | 0.00227 |
Barrels and BTUs answer different questions
EIA also reports a related useful-thermal-output petroleum measure in physical units of thousand barrels. That series describes fuel volume. The consumption-uto-btu series used here describes the energy content of the fuel in million MMBtu. The two measures are connected, and leading states can look similar, but the numbers are not interchangeable. Average heat content can differ across petroleum products and reporting contexts, so a fixed universal conversion should not be assumed for every state. The BTU measure is the more direct choice when the analytical question is energy input, while the barrel measure is more appropriate when the question is physical fuel volume.
Petroleum and Petroleum Liquids are separate EIA fuel selections
The fuel facet also matters. PET represents EIA’s broader Petroleum category, while PEL refers to Petroleum Liquids. A 2024 sector-98 useful-thermal-output comparison can therefore produce different state values even when the field is otherwise similar. In the narrower PEL energy-content series, Maryland and Hawaii dominate. In the broader PET series examined here, Montana becomes the largest observation. That difference is not a contradiction; it reflects a different fuel grouping. Similar public titles can hide this distinction, so the fuel facet should be checked before two state comparisons are treated as duplicates or combined into one ranking.
Fuel energy input is not the same as useful heat output or efficiency
Million MMBtu in this series is an input-energy measure. It does not show how much useful heat was ultimately delivered, how much electricity was generated at the same facilities, or how efficiently the fuel was converted. An efficiency comparison would require both input and output measures on a consistent basis. The series also does not identify which individual plants created each state total. Combined heat and power operations can be important for useful thermal output, but the state-level observations alone do not establish a facility-level cause. The safe conclusion is descriptive: a small number of states recorded most of the petroleum energy assigned to useful thermal output in 2024.
The concentration suggests a specialized rather than broadly distributed activity
With the top ten states representing 99.29% of the state total, this measure does not look like an activity that occurs at comparable scale everywhere. Useful thermal output is associated with particular operating configurations, and the use of petroleum for that purpose can depend heavily on the presence and operation of specific facilities. Still, the state totals do not reveal plant ownership, operating schedules, or the reasons behind fuel choice. Those questions need facility-level operational records. The present comparison is strongest when used to identify concentration and to distinguish high, low, positive, and zero state observations without assigning unsupported causes.
Year-to-year comparisons need the same field, fuel, sector, and unit
A valid time-series comparison should keep fueltypeid=PET, sectorid=98, field=consumption-uto-btu, annual frequency, and million MMBtu unchanged. Switching to Petroleum Liquids, total-consumption-btu, or consumption-for-eg-btu would change the concept rather than merely the year. This is especially important in EIA operational data because closely related series can share much of the same wording. A trend should therefore be constructed from matching identities, not from titles that happen to look similar. Once the identity is held constant, future observations can show whether the state concentration is stable or changing.
What the 2024 distribution establishes
The 2024 cross-section establishes several direct facts. Montana is the largest state at 2.40541 million MMBtu, Montana, Maryland, and Hawaii together account for 81.70% of the 50-state sum, and 23 states report an exact zero. The median of 0.000085 million MMBtu is far below the mean of 0.138773, confirming an unusually concentrated distribution. These findings describe petroleum energy assigned to useful thermal output within the Electric Power sector. They do not establish state petroleum dependence, plant efficiency, electricity generation shares, costs, emissions, or the reasons behind each state’s level. Those questions require additional measures.
Source and calculation method
The source is the U.S. Energy Information Administration annual electricity/electric-power-operational-data series. The comparison uses 2024, fueltypeid=PET (Petroleum), sectorid=98 (Electric Power), field=consumption-uto-btu, with values reported in million MMBtu. The total, mean, median, quartiles, state rankings, and shares were calculated from the 50 published state observations. No missing value was imputed or replaced with zero, and no other year was mixed into the calculations. If EIA later revises the 2024 observations, the comparison can be refreshed by applying the same series definition.
Frequently Asked Questions
Which state had the highest petroleum energy use for useful thermal output in 2024?
Montana ranked first at 2.40541 million MMBtu, equal to 34.67% of the 50-state sum.
Is this the same as petroleum consumption measured in barrels?
No. This series measures fuel energy in million MMBtu. A related physical-unit series measures volume in thousand barrels.
Does a zero mean the state used no petroleum at all?
No. A zero applies only to the PET, sector 98, useful-thermal-output BTU series for 2024.
Are Petroleum and Petroleum Liquids the same EIA fuel category?
No. PET is the broader Petroleum category, while PEL is Petroleum Liquids.
Related Articles
Green Map creates custom-edited map images using open geographic data sources such as geoBoundaries, Natural Earth, OpenStreetMap, and government open data. These maps are edited visual materials, not raw data files, and are provided for education, documents, presentations, and graphic reference.