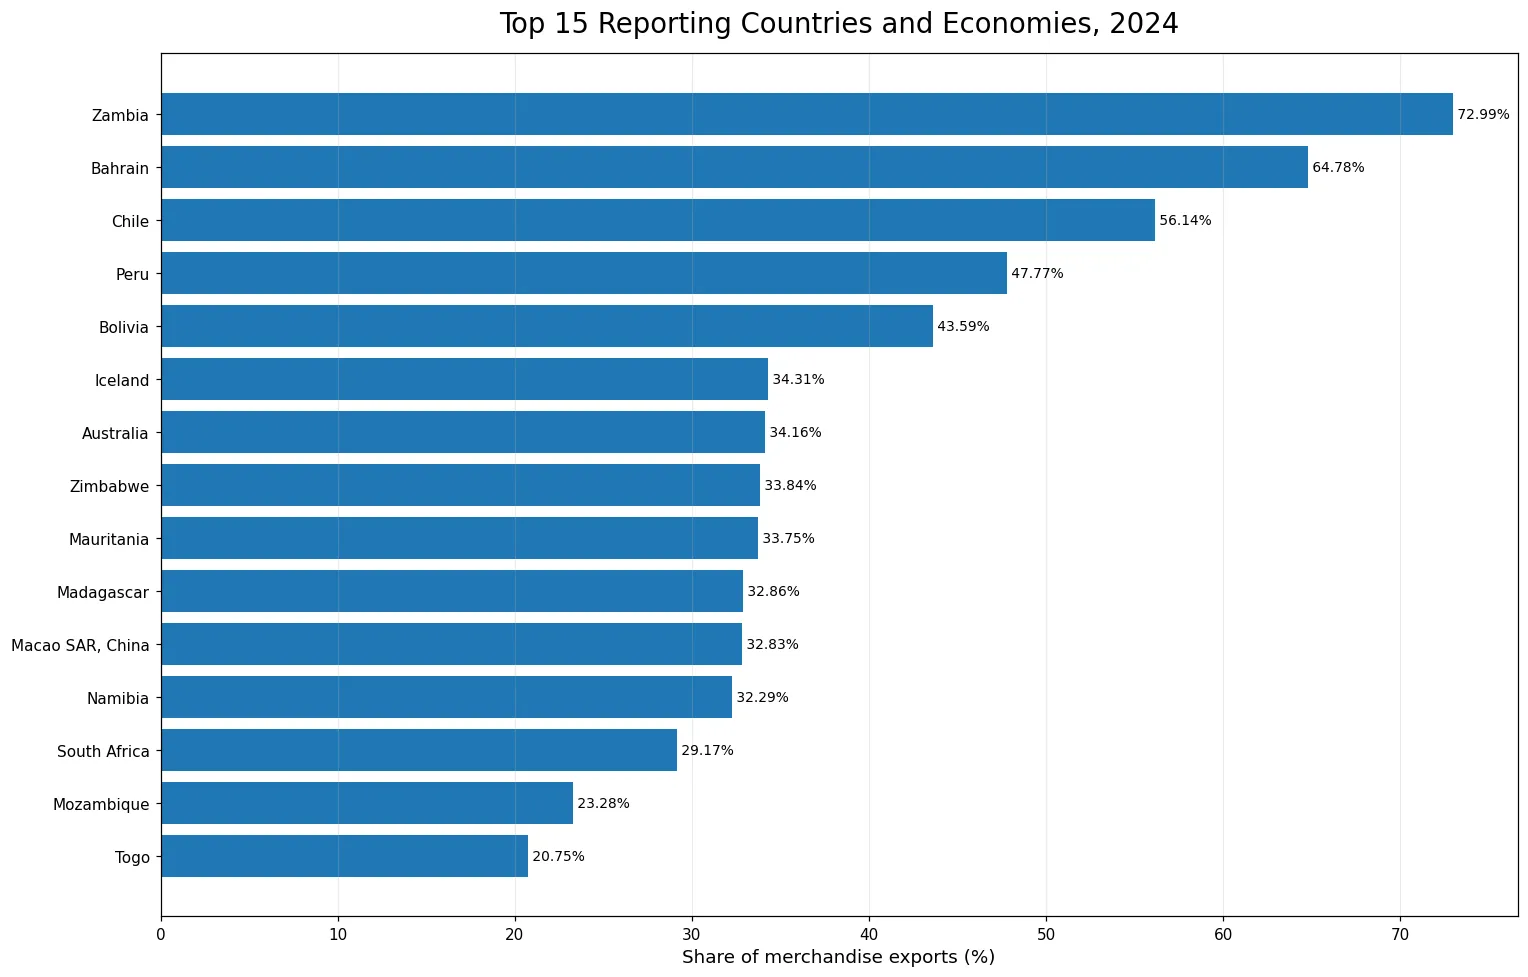
Ores and metals made up a strikingly large share of merchandise exports in several reporting economies in 2024. Zambia recorded the highest value at 72.99%, followed by Bahrain at 64.78%, Chile at 56.14%, Peru at 47.77%, and Bolivia at 43.59%. The World Bank indicator measures composition, not the absolute value of exports. A 73% share means that ores and metals accounted for nearly three-quarters of a country’s merchandise-export basket, not that the country necessarily exported the largest dollar amount of ores and metals in the world. Total merchandise exports vary enormously across economies, so percentage rankings and value rankings can differ substantially.
The indicator code is TX.VAL.MMTL.ZS.UN and the unit is percent. The ores-and-metals category covers SITC Rev. 3 sections 27, 28, and 68: crude fertilizers and minerals not elsewhere specified, metalliferous ores and scrap, and non-ferrous metals. This scope is broader than raw mining output alone. It can capture economies where processed or semi-processed non-ferrous metals are an important export. In 2024, the source lists 217 countries and economies, of which 130 have a reported value and 87 do not. Missing observations remain no data rather than being converted to zero.
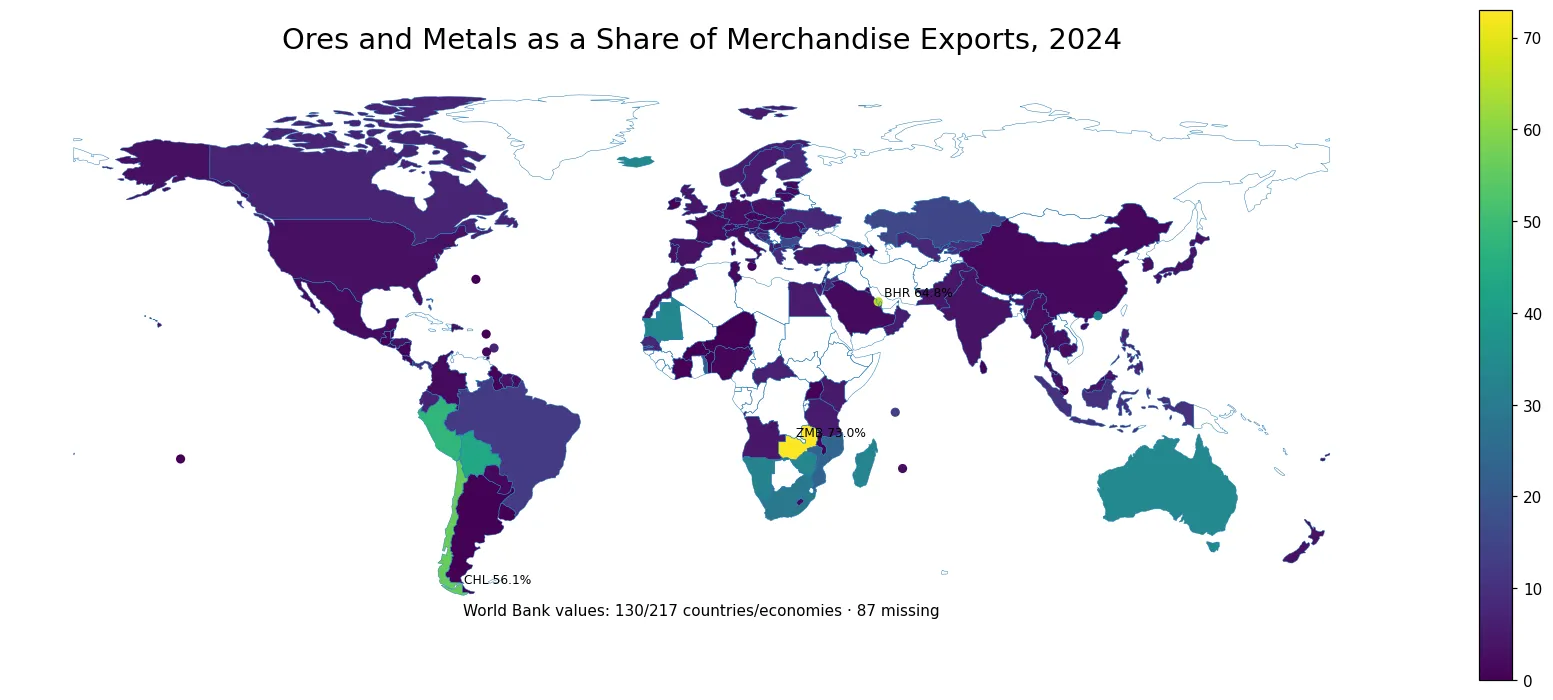
Table of Contents
Zambia stands far above the middle of the 2024 distribution
Zambia’s 72.99% is the highest reported share and sits 8.21 percentage points above Bahrain and 16.85 points above Chile. The number is especially large when compared with the median reporting economy, where ores and metals account for only 3.28% of merchandise exports. Zambia’s value therefore describes a highly concentrated export composition. It does not reveal the dollar size of the sector, the volume of mineral production, the number of mines, or the contribution of mining to GDP. Those are separate measures. The percentage can also rise when other merchandise exports are relatively small, so it should be read as a structural ratio rather than a complete measure of mining activity.
Bahrain shows why the category is broader than raw ores
Bahrain ranks second at 64.78%, a result that is easier to understand once the indicator definition is kept in view. SITC section 68 includes non-ferrous metals, so a country does not need to be dominated by raw-ore exports to record a high share. Smelting, refining, and exports of non-ferrous metal products can also affect the indicator. This is why labeling the measure simply as a mining-dependence index would be too narrow. The safer interpretation is the share of merchandise exports classified as ores and metals under the World Bank definition. Identifying which commodities drive an individual country’s value requires more detailed trade data by product.
Chile, Peru, and Bolivia form a prominent South American cluster
Chile records 56.14%, Peru 47.77%, and Bolivia 43.59%, placing all three among the five highest reported values. The cluster makes the importance of minerals and metals in the export structure of western South America clearly visible. Yet the three economies should not be treated as interchangeable. Their dominant commodities, processing stages, export destinations, and total merchandise-export values can differ. A percentage map can show relative concentration, but it cannot separate copper, zinc, iron, precious metals, scrap, or other included products. Product-level trade statistics are needed to explain the composition behind each national share.
High shares also appear across Africa, Oceania, and other regions
Australia records 34.16%, while Zimbabwe is at 33.84%, Mauritania 33.75%, Madagascar 32.86%, Namibia 32.29%, South Africa 29.17%, Mozambique 23.28%, and Togo 20.75%. The top of the ranking therefore crosses multiple regions rather than forming one simple geographic bloc. The composition behind those percentages can still be very different from one economy to another. In some cases metalliferous ores may dominate, while in others non-ferrous metals or other minerals may be more important. The broad category is useful for global comparison, but it should not replace commodity-specific analysis when the purpose is to understand production chains or export specialization.
| Country/economy | Ores and metals share |
|---|---|
| Zambia | 72.99% |
| Bahrain | 64.78% |
| Chile | 56.14% |
| Peru | 47.77% |
| Bolivia | 43.59% |
| Iceland | 34.31% |
| Australia | 34.16% |
| Zimbabwe | 33.84% |
| Mauritania | 33.75% |
| Madagascar | 32.86% |
The median is only 3.28%, far below the 8.15% mean
Across the 130 reported observations, the mean is 8.15% and the median is 3.28%. The first quartile is 1.49% and the third quartile is 7.93%. The large gap between the mean and median reflects a strongly right-skewed distribution: a relatively small group of economies with 20%, 30%, or even 70% shares pulls the average upward. Only 15 reporting economies are at or above 20%. Half of the reported values lie roughly between 1.49% and 7.93%. For describing a typical reporting economy, the median and quartile range are therefore more informative than the arithmetic mean alone.
Very low shares do not imply an absence of mineral resources
French Polynesia has the lowest reported value at about 0.0007%, followed by Bermuda at 0.0038%, Niger at 0.0226%, Benin at 0.0709%, and Kuwait at 0.1290%. These tiny shares should not be read as evidence that an economy has no mineral resources or no metal-related activity. The denominator is total merchandise exports, so fuels, agricultural products, machinery, manufactured goods, or other categories can dominate the export basket and push the ores-and-metals share down. Domestic use can also matter. The indicator describes export composition only; it does not measure reserves, production potential, or domestic consumption of minerals and metals.
| Lowest reported country/economy | Ores and metals share |
|---|---|
| French Polynesia | 0.001% |
| Bermuda | 0.004% |
| Niger | 0.023% |
| Benin | 0.071% |
| Kuwait | 0.129% |
| Brunei Darussalam | 0.137% |
| Argentina | 0.171% |
| Burkina Faso | 0.247% |
| Uruguay | 0.331% |
| Belize | 0.435% |
Missing observations must remain separate from genuine low values
The 2024 series contains 217 country and economy rows, but 87 have no reported value. Those missing observations are not 0%. Treating them as zero would incorrectly place non-reporting economies next to economies that genuinely have extremely low shares. Among the 130 reported values, 24 are at or above 10%, 15 are at or above 20%, and 21 are below 1%. Those counts describe the reporting set only. They should not be presented as percentages of every economy in the World Bank master list because the coverage is incomplete for 2024.
Export share and export value can produce very different rankings
A large merchandise exporter can have a modest ores-and-metals share and still export more ores and metals in dollar terms than a smaller economy with a much higher percentage. The reverse can also happen. This makes the indicator well suited to studying specialization and export composition, but poorly suited to questions about market size or global supply volumes. Those questions require absolute export values, quantities, or commodity-specific data. The percentage also changes when the denominator changes: a surge in non-mineral exports can lower the ores-and-metals share even if mineral exports remain stable. Interpreting year-to-year movements therefore requires looking at both the numerator and the broader merchandise-export basket.
A high share can be a starting point for studying export concentration
When ores and metals account for 40%, 50%, or 70% of merchandise exports, the ratio can flag an economy whose goods exports are strongly concentrated in a resource- and metal-related category. That can be useful for deeper work on exposure to commodity-price cycles, terms-of-trade shifts, and export diversification. But the ratio is not a complete diversification index. Services exports are outside the merchandise denominator, and the remaining goods categories may themselves be highly concentrated. In addition, raw ores and processed non-ferrous metals can have very different value chains. A robust assessment of economic vulnerability or diversification should combine this measure with product-level export shares, services trade, destination concentration, and longer time series.
The 2024 global pattern is defined by a small high-share group
The clearest 2024 pattern is the contrast between a small set of high-share economies and a much lower middle of the distribution. Zambia leads at 72.99%, Bahrain, Chile, Peru, and Bolivia follow, and several economies in Africa and Oceania also exceed 20%. At the same time, the median is only 3.28%. That contrast matters more than a simple continent-by-continent story. High values occur in multiple regions, and very low values do as well. The map is therefore most useful for identifying export-structure outliers and clusters, while the underlying causes require product-level and country-specific evidence.
Source and calculation method
The source is the World Bank indicator TX.VAL.MMTL.ZS.UN for 2024, expressed as a percentage of merchandise exports. Ores and metals cover SITC Rev. 3 sections 27, 28, and 68. Of 217 country and economy rows, 130 have reported values and 87 are missing. The mean (8.15%), median (3.28%), first quartile (1.49%), and third quartile (7.93%) are calculated directly from the 130 reported observations. Missing values are not imputed or treated as zero, and no other year is mixed into the comparison. If the World Bank later revises or adds 2024 observations, coverage and some ranks may change.
Frequently Asked Questions
Which economy had the highest ores-and-metals share of merchandise exports in 2024?
Zambia had the highest reported share at 72.99%, followed by Bahrain at 64.78% and Chile at 56.14%.
Does a higher share mean a larger dollar value of ores and metals exports?
No. The indicator is a percentage of total merchandise exports, so economies with very different total export values can rank differently by share and by dollars.
What products are included in ores and metals?
The World Bank definition covers SITC Rev. 3 sections 27, 28, and 68: crude fertilizers and minerals, metalliferous ores and scrap, and non-ferrous metals.
Are countries with no 2024 value treated as zero?
No. The 87 missing 2024 observations remain no data and are not converted to zero.
Related Articles
Green Map creates custom-edited map images using open geographic data sources such as geoBoundaries, Natural Earth, OpenStreetMap, and government open data. These maps are edited visual materials, not raw data files, and are provided for education, documents, presentations, and graphic reference.