California dominates the 2025 state distribution of estimated total solar generation assigned to the U.S. residential sector. The EIA value is 23,561.340 thousand MWh, compared with 4,844.483 thousand MWh in Texas, 4,756.958 in Florida, and 4,503.264 in Arizona. The 51 observations—50 states plus the District of Columbia—sum to 63,273.904 thousand MWh, and California alone represents 37.24% of that state-level total. The exact series identity matters here: fueltypeid=TSN, sectorid=8, field=generation, annual frequency, and 2025. TSN means estimated total solar. In EIA’s framework, that definition is broader than a utility-scale-only solar line, which is especially important for the residential sector where small-scale generation is a major part of the measure. The values are therefore best understood as estimated total solar generation associated with the residential sector, not as utility-scale residential solar.
The unit is thousand megawatthours, so the ranking measures annual electricity generation, not installed capacity. A state can have a large solar capacity base but a different generation outcome depending on when systems were installed, local solar resource, operating conditions, equipment performance, and other factors. The figures also do not represent household electricity sales or residential electricity demand. Generation and consumption are separate concepts, and customer-class sales can differ from the amount produced by solar systems associated with that sector. Finally, the state totals are absolute values. They are not normalized by population, number of households, owner-occupied housing units, or rooftop-solar installations. For that reason, a high rank should be read as a large total amount of residential-sector solar generation, not automatically as the highest adoption rate.
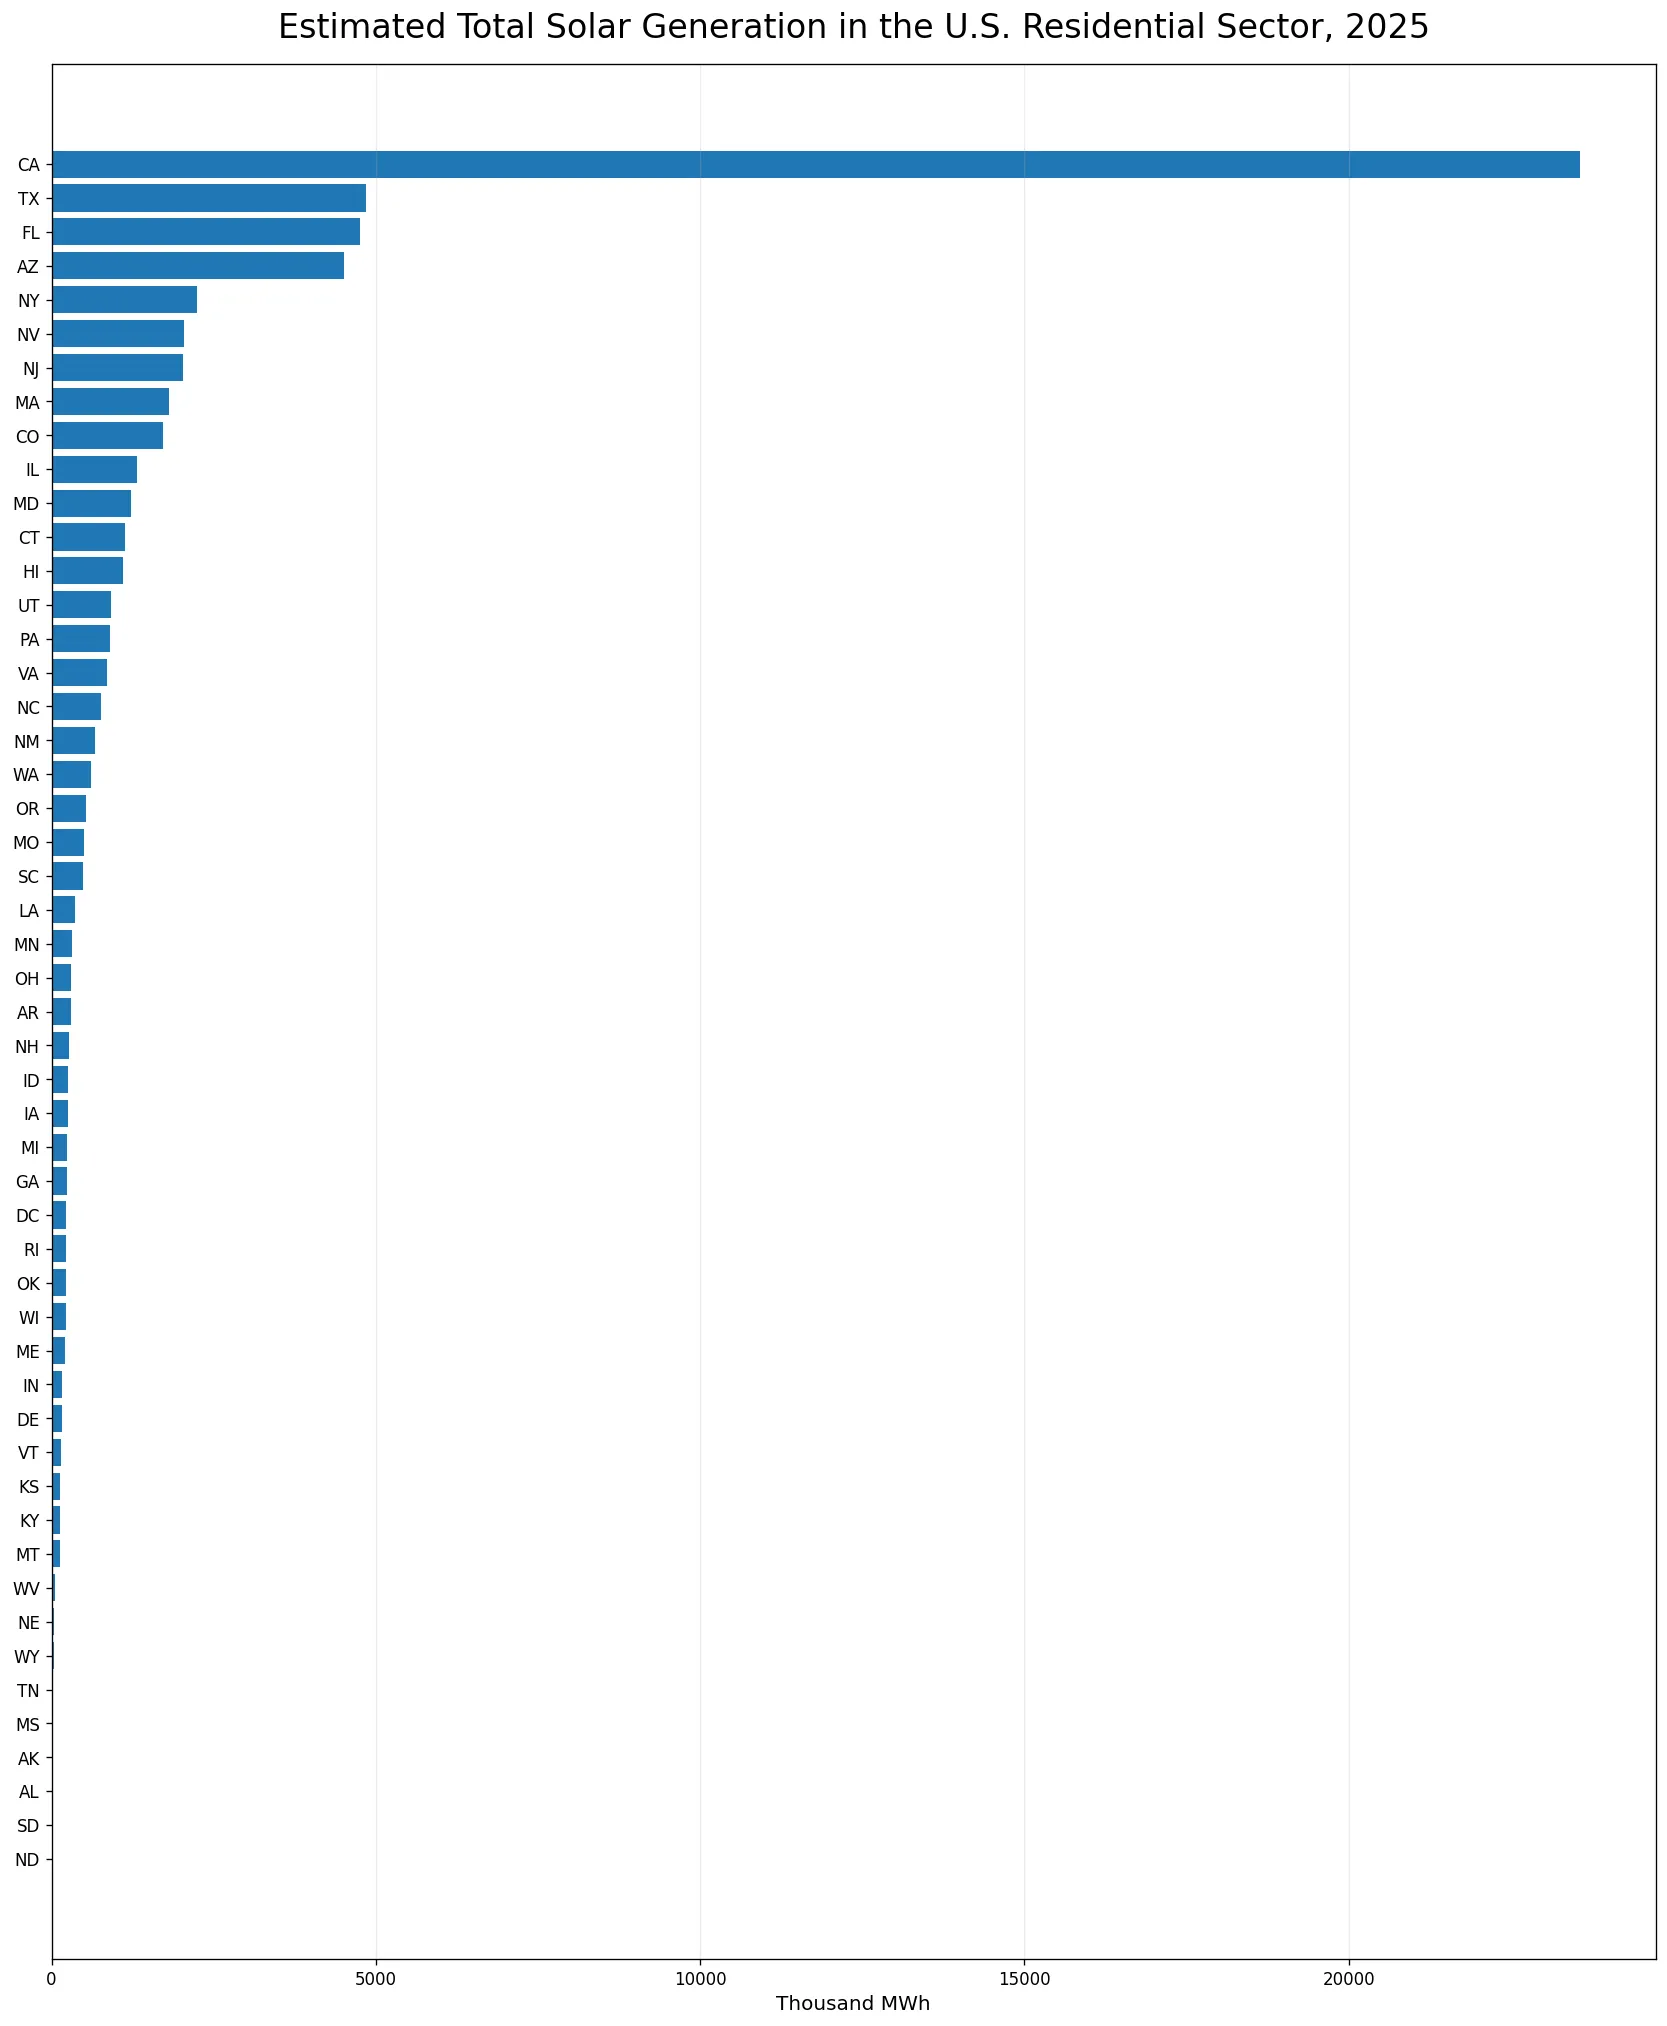
Table of Contents
California accounts for more than one-third of the 51-state total
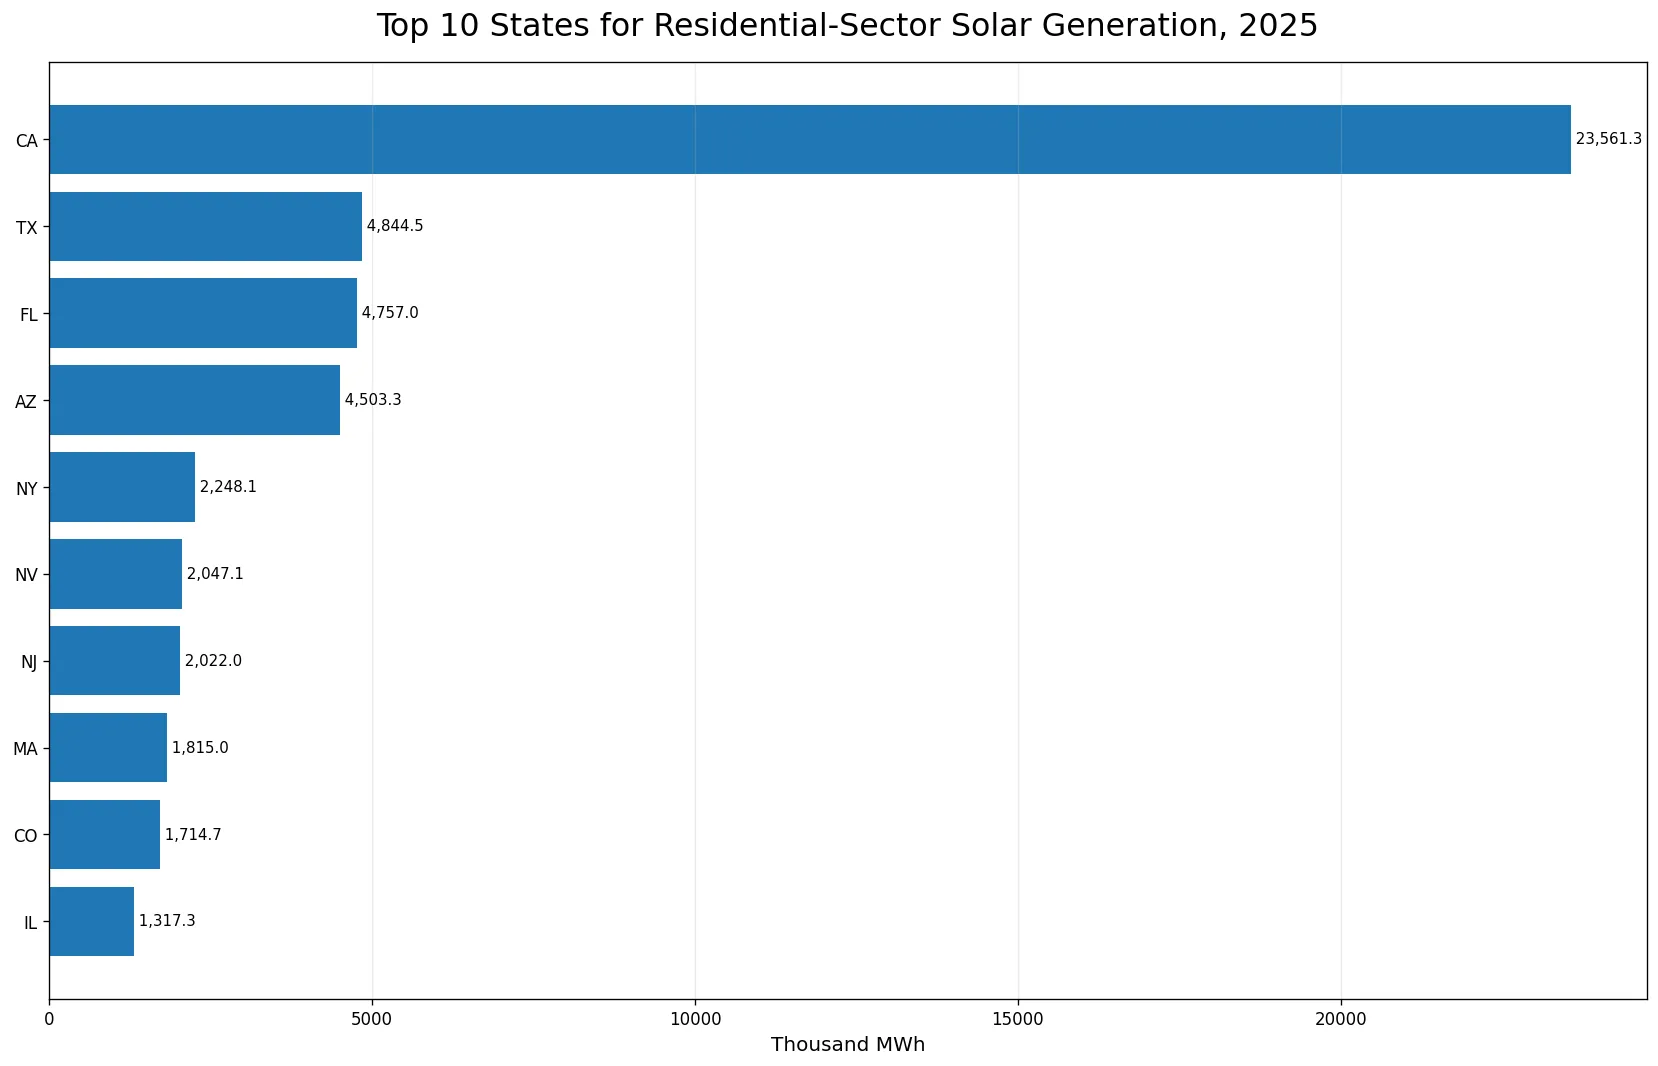
California’s 23,561.340 thousand MWh equals 37.24% of the sum of all 51 observations. Texas contributes 7.66%, Florida 7.52%, and Arizona 7.12%. The top three states together account for 52.41% of the total, the top five account for 63.08%, and the top ten account for 77.17%. This is a highly concentrated distribution, with the largest state separated from the rest by a substantial margin. The concentration also explains why a simple average can be misleading. The mean is 1,240.665 thousand MWh, but the median is only 295.754 thousand MWh. In other words, a handful of very large state observations pull the average far above the value of a middle-ranked state.
Texas, Florida, and Arizona form a close second tier
After California, Texas records 4,844.483 thousand MWh, Florida 4,756.958, and Arizona 4,503.264. Those three observations are relatively close to one another compared with the much larger gap back to California. New York follows at 2,248.080 thousand MWh, then Nevada, New Jersey, Massachusetts, Colorado, and Illinois. The top group spans the West, South, and Northeast rather than lining up along a single geographic gradient. That pattern suggests why solar generation should not be interpreted from sunlight alone. The size of the residential market, cumulative installations, policy history, interconnection practices, housing stock, and the timing of capacity additions may all matter. Those explanatory variables are not part of this indicator, so the ranking can establish where generation is high without proving why each state reached that level.
| State | Generation (thousand MWh) | Share of 51-state sum |
|---|---|---|
| California | 23,561.340 | 37.24% |
| Texas | 4,844.483 | 7.66% |
| Florida | 4,756.958 | 7.52% |
| Arizona | 4,503.264 | 7.12% |
| New York | 2,248.080 | 3.55% |
| Nevada | 2,047.143 | 3.24% |
| New Jersey | 2,022.041 | 3.20% |
| Massachusetts | 1,815.017 | 2.87% |
| Colorado | 1,714.699 | 2.71% |
| Illinois | 1,317.314 | 2.08% |
The median state is far below the national state-level average
The median observation is 295.754 thousand MWh, while the mean is 1,240.665. The first quartile is 154.613 and the third quartile is 1,011.215 thousand MWh. Half of the reporting jurisdictions therefore sit inside a range that is tiny compared with California’s value. This right-skewed shape is a central feature of the dataset. When distributions are this uneven, reporting only the average obscures the experience of most states. The median and quartiles make it clearer that the majority of jurisdictions produce a fraction of the amount recorded by the leading states. The full 51-state chart is useful for seeing that long lower tail, while the top-ten chart makes the differences within the upper group easier to read.
All 51 jurisdictions have positive reported values
There are no missing observations and no exact zeros in the 2025 observations. Every state and the District of Columbia therefore has a positive reported value. North Dakota is the minimum at 1.875 thousand MWh, followed by South Dakota at 7.158, Alabama at 8.390, Alaska at 15.394, and Mississippi at 21.581 thousand MWh. These very small observations are still genuine values in the source, not placeholders for missing data. That distinction matters in mapping and ranking. If a state had no observation, it should remain no data rather than be assigned zero. Because the series has complete 51-jurisdiction coverage, the state distribution can be compared without mixing observed values with imputed ones.
| Lowest-value state | Generation (thousand MWh) |
|---|---|
| North Dakota | 1.875 |
| South Dakota | 7.158 |
| Alabama | 8.390 |
| Alaska | 15.394 |
| Mississippi | 21.581 |
| Tennessee | 27.856 |
| Wyoming | 36.036 |
| Nebraska | 45.146 |
| West Virginia | 58.504 |
| Montana | 125.805 |
Estimated total solar should not be reduced to a utility-scale-only label
The TSN fuel facet stands for estimated total solar. In EIA’s electricity summaries, estimated total solar is a broader total-solar concept and is distinct from a utility-scale-only solar line. That matters especially for the residential sector, where small-scale solar is central to the meaning of the series. Calling these figures ‘utility-scale residential solar’ would imply a facility type that does not match the way residential solar is represented in this EIA framework. The more accurate interpretation is estimated total solar generation in the residential sector, which preserves the selected TSN and Residential definitions without narrowing the measure to utility-scale facilities.
A high generation total is not the same as a high adoption rate
Absolute state generation is influenced by state size. A state with many households can produce a large total even if the share of homes with solar is not the highest. Conversely, a smaller state may have strong household adoption but still rank lower in total MWh. To compare adoption, the numerator would need to be paired with a denominator such as households, housing units, customers, installations, or residential meters. To compare productivity, generation would need to be paired with installed solar capacity. Those normalized measures answer different questions. The present dataset answers a simpler one: how much estimated total solar generation is associated with the residential sector in each state during 2025. Keeping that question narrow avoids turning a generation ranking into an adoption ranking.
Generation also differs from residential electricity demand
Residential-sector solar generation should not be read as residential electricity consumption. Demand depends on population, household size, weather, heating and cooling technologies, building characteristics, appliance use, and prices. Solar electricity generated at a residence may be consumed behind the meter, exported to the grid, or accounted for through different utility arrangements. Meanwhile, electricity sales data measure transactions with customers and can include electricity supplied from many generation sources. These datasets can be compared in a broader analysis, but they are not interchangeable. The 2025 TSN generation series is best used to measure the production side of residential solar, while electricity sales or load datasets are needed to describe how much electricity households use.
What the 2025 state distribution can tell us
The 2025 cross-section supports several direct observations: California is the largest state by a wide margin, Texas, Florida, and Arizona form the next tier, the top ten account for 77.17% of the 51-state total, and every jurisdiction has a positive value. It also shows a large difference between the median state and the leading states. These are descriptive facts from the annual state values. The 2025 state values do not establish long-term growth rates, policy effectiveness, household payback periods, or causal explanations. Those questions require time series, policy variables, capacity data, prices, or household-level denominators. A future year-over-year comparison should keep the same TSN fuel facet, residential sector, generation field, frequency, and unit so that the change is measured on a consistent basis.
Source and calculation method
The source is the U.S. Energy Information Administration electricity/electric-power-operational-data annual series. The 2025 values are defined by fueltypeid=TSN (estimated total solar), sectorid=8 (Residential), field=generation, and the unit thousand megawatthours. The sum (63,273.904), mean (1,240.665), median (295.754), quartiles, rankings, and shares were calculated directly from the 51 published state-level observations. No observation was imputed, no missing value was converted to zero, and no other year was blended into the results. State shares use the sum of the same 51 observations as the denominator. If EIA later revises the 2025 series, the comparison can be updated using the same definitions.
Frequently Asked Questions
Which state had the most estimated residential-sector total solar generation in 2025?
California ranked first at 23,561.340 thousand MWh, about 37.24% of the sum of the 51 state-level observations.
Is this a utility-scale-only solar series?
No. The selected EIA facets are TSN, meaning estimated total solar, and sectorid=8 for Residential. The article therefore does not describe the values as utility-scale-only residential solar.
Does higher generation mean a higher household solar adoption rate?
No. These are absolute generation totals. Adoption comparisons require a denominator such as households, housing units, customers, or installations.
Are any state values missing or zero?
No. All 50 states and the District of Columbia have positive 2025 observations in the supplied dataset.
Related Articles
Green Map creates custom-edited map images using open geographic data sources such as geoBoundaries, Natural Earth, OpenStreetMap, and government open data. These maps are edited visual materials, not raw data files, and are provided for education, documents, presentations, and graphic reference.