U.S. renewable energy consumption for electricity generation varied sharply by state in 2024. In the annual U.S. Energy Information Administration (EIA) series used here, the 50 states and District of Columbia summed to 2,856.7 million MMBtu. Texas recorded 570.2 million MMBtu, equal to 20.0% of the 51-jurisdiction total. California followed with 331.0 million MMBtu, or 11.6%. Together, those two states accounted for 31.5% of the total.
This comparison is not a ranking of renewable shares in each state and it is not a table of electricity generation in megawatthours. The underlying EIA field is consumption-for-eg-btu, the fuel category is fixed to all renewables, and the year is fixed to 2024. The published unit is million MMBtu, which is retained throughout this article. A larger value therefore means a larger absolute amount in this specific EIA energy-consumption series; it does not by itself mean that renewables supplied a larger percentage of a state’s electricity.
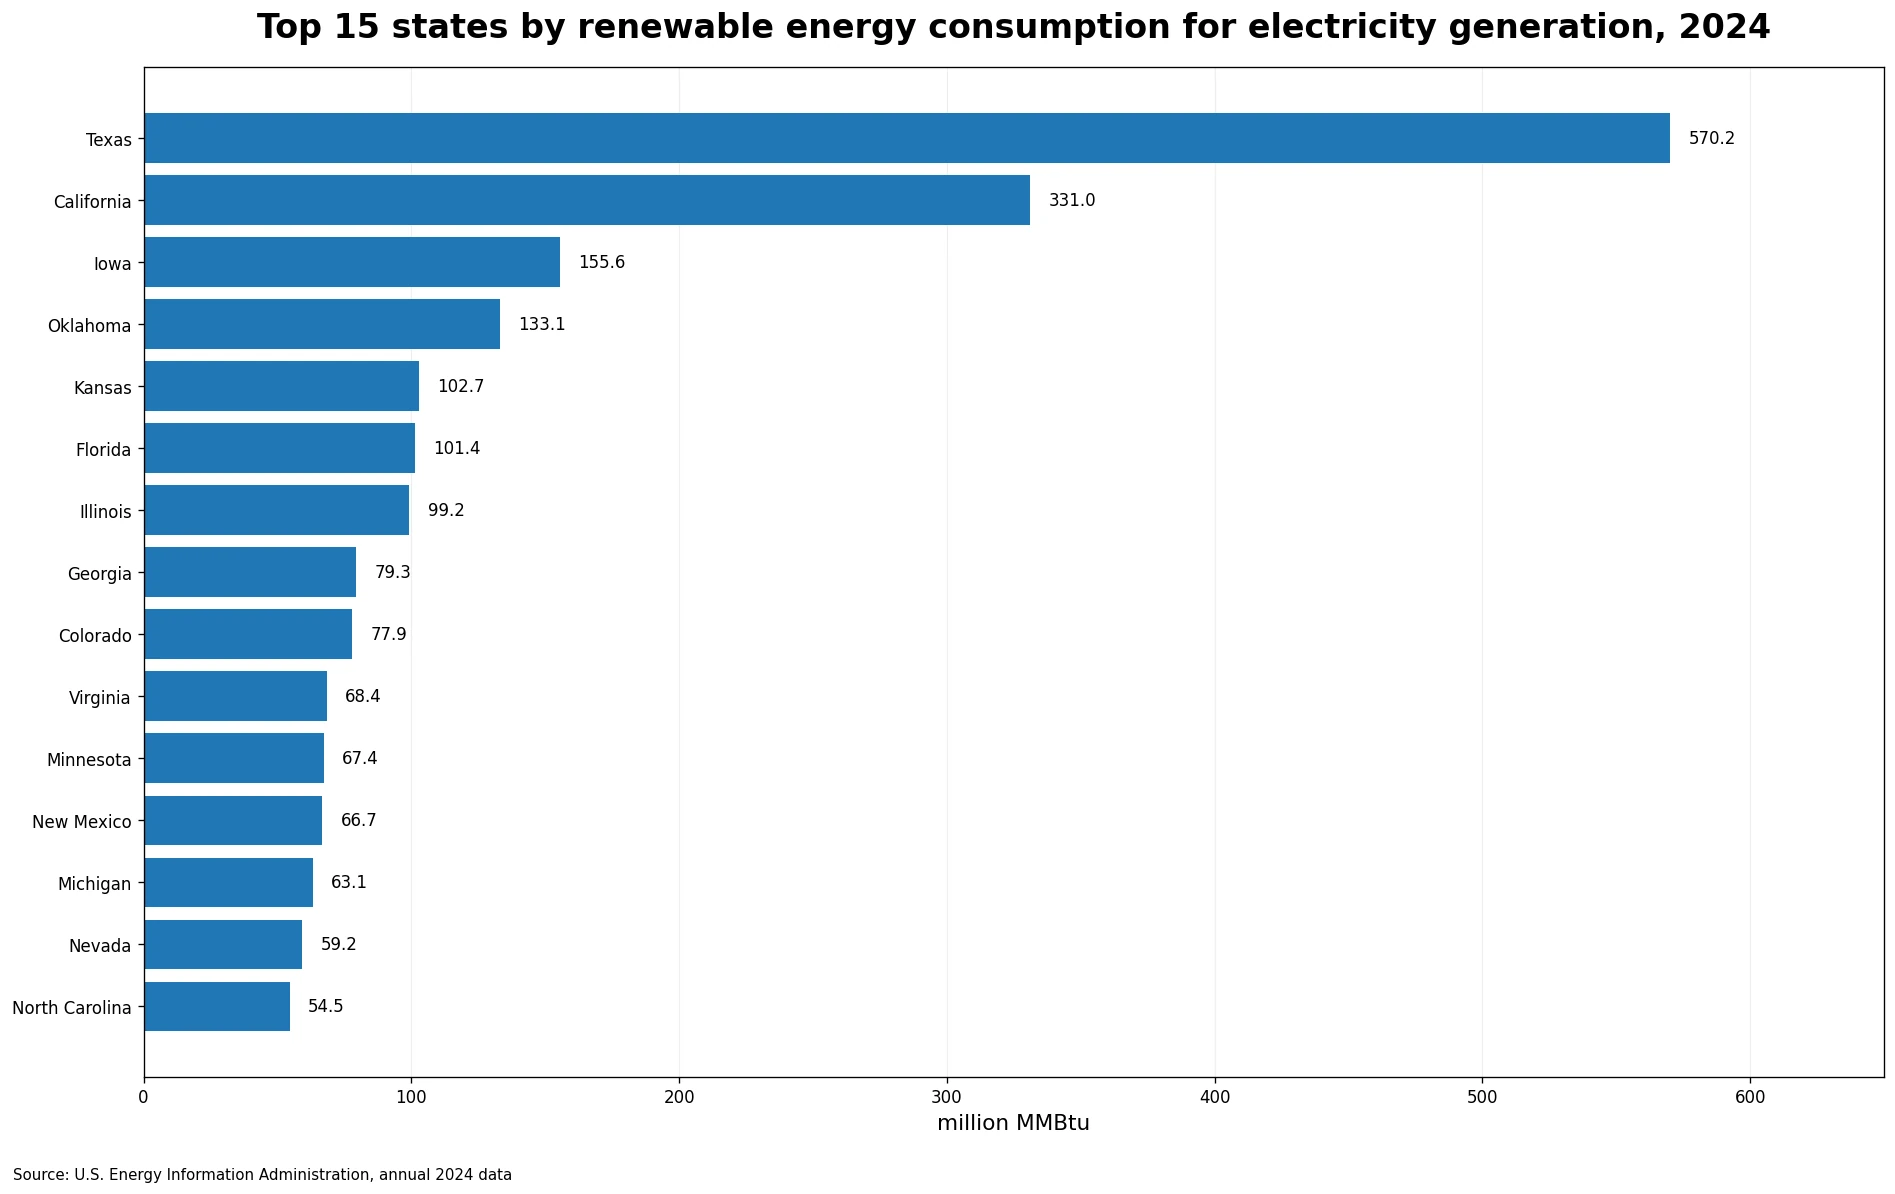
Table of Contents
What this EIA measure represents
The consumption-for-eg-btu measure expresses energy associated with electricity generation in a common heat unit. Energy sources are normally reported in different physical units, so a Btu-based series provides a common accounting scale for comparison. In this dataset, the fuel facet is AOR, or all renewables. That makes the series distinct from EIA tables limited to petroleum, natural gas, coal, or another single fuel family. The geographic comparison is also consistent: one annual observation is supplied for every state and for the District of Columbia.
The word “consumption” also needs careful interpretation. Renewable energy can include sources that are not burned as a physical fuel, so a Btu accounting value should not be read as if every renewable source involved a measured volume of combustible material. The safest use of this dataset is to compare the scale and distribution of the EIA-reported energy values across states. Questions about efficiency, capacity, cost, generation share, or policy performance require different measures and should not be inferred from this one series.
Texas and California together represented 31.5% of the total
Texas was the clear leader at 570.2 million MMBtu, representing 19.96% of the total. California ranked second at 331.0 million MMBtu and 11.59%. Their combined value was 901.2 million MMBtu, or 31.55% of all 51 jurisdictions. Adding third-ranked Iowa raised the top-three share to 36.99%.
Oklahoma ranked fourth, followed by Kansas, Florida, and Illinois. The top five states together accounted for 45.25% of the total, while the top ten reached 60.17%. Those percentages show why the national distribution should not be described as even. Every jurisdiction had a positive value, but a comparatively small group of states contributed a large fraction of the total, and the size gap between the highest and middle-ranked states was substantial.
The leaders span several U.S. regions
The top 15 are not confined to one region. Texas and California occupy the first two places, while Iowa, Oklahoma, and Kansas place the central United States prominently in the upper ranks. Florida, Georgia, and Virginia add large values from the South and East, while Colorado, New Mexico, and Nevada add western states. The result is a geographically mixed upper tier rather than a simple coastal, southern, or Midwestern pattern.
That geographic mix does not, by itself, identify which renewable sources created each state’s value. The dataset supplied for this article is an all-renewables aggregate and does not break the number into wind, solar, hydro, biomass, geothermal, or other components. Explaining why one state ranks above another would require additional fuel-specific generation, capacity, or operating data. The present series can describe where the absolute Btu values were larger, but it cannot assign a causal explanation to those differences.
Top 15 jurisdictions in 2024
| State | Renewable energy consumption for electricity generation (million MMBtu) | Share of 51-jurisdiction total |
|---|---|---|
| Texas | 570.2 | 19.96% |
| California | 331.0 | 11.59% |
| Iowa | 155.6 | 5.45% |
| Oklahoma | 133.1 | 4.66% |
| Kansas | 102.7 | 3.60% |
| Florida | 101.4 | 3.55% |
| Illinois | 99.2 | 3.47% |
| Georgia | 79.3 | 2.78% |
| Colorado | 77.9 | 2.73% |
| Virginia | 68.4 | 2.39% |
| Minnesota | 67.4 | 2.36% |
| New Mexico | 66.7 | 2.33% |
| Michigan | 63.1 | 2.21% |
| Nevada | 59.2 | 2.07% |
| North Carolina | 54.5 | 1.91% |
The table highlights how uneven the spacing between ranks is. Texas was more than ten times the value of North Carolina, which still ranked fifteenth. California was more than twice Iowa’s value. Farther down the list, the differences become smaller and individual shares generally fall toward two percent or less. A ranking position therefore does not tell the whole story: the absolute value and percentage share are needed to understand how concentrated the distribution really was.
The mean was 56.0 million MMBtu, but the median was only 28.4
Across the 51 jurisdictions, the arithmetic mean was 56.0 million MMBtu and the median was 28.4. Only 14 jurisdictions were above the mean. The first quartile was about 12.6 million MMBtu and the third quartile was about 61.2. The large gap between the mean and median is a sign of a right-skewed distribution in which a handful of very large state values pull the average upward.
For a reader trying to understand a “typical” state, the median is therefore more informative than the mean on its own. Half of the jurisdictions were below 28.4 million MMBtu and half were above it, even though the average was roughly twice as high. Combining the median with the top-three, top-five, and top-ten concentration shares gives a clearer picture: renewable energy consumption for electricity generation was present across the country, but the absolute volume was heavily weighted toward the upper part of the ranking.
Small values do not imply a small renewable share
The District of Columbia had the smallest value at 0.6658 million MMBtu. Alaska and Delaware were also below 1 million MMBtu, while Kentucky, Rhode Island, and Tennessee remained in the single digits. Those low absolute values should not be interpreted as proof of a low renewable percentage or weak renewable policy. Absolute consumption is influenced by the size and structure of the electricity system, where generation facilities are located, and how electricity moves across state borders.
A small jurisdiction can have a small absolute number even if renewables are important within its own electricity mix. Conversely, a large state can record a high absolute value while renewables make up a more modest share of all generation. To compare relative dependence on renewables, a denominator such as total generation or total energy consumption is required. Per-capita values, installed capacity, and renewable generation shares answer different questions and should be kept separate from this absolute Btu series.
Why this ranking differs from petroleum consumption or generation rankings
EIA publishes related state-level series for petroleum fuel consumption used in electricity generation. Those datasets filter the fuel category to petroleum, so they can emphasize states with very different energy systems, including places where oil-fired generation remains important. This article instead filters the data to all renewables. A state can rank high in one list and low in the other without any contradiction because the fuel scope is different.
The same distinction applies to electricity generation. Generation is normally reported in megawatthours, while this dataset reports an energy-consumption measure in Btu. The concepts are related to the electricity system but they are not interchangeable. Comparing the numerical magnitudes directly would mix two different units and two different metrics. When using EIA state data, the field name, fuel facet, sector facet, year, and unit are all part of the definition of the statistic.
Source and calculation method
The source is the U.S. Energy Information Administration electric power operational data API. The annual query fixes the field to consumption-for-eg-btu, fueltypeid to AOR (all renewables), sectorid to 99, and the year to 2024. The verified dataset contains exactly one observation for each of the 50 states and the District of Columbia. No missing values were replaced with zero and no observations from other years or fuel categories were added.
The national-style total used in this article is simply the sum of the 51 jurisdiction values; it is a comparison total for this state dataset rather than a separately reported national observation. Each state share is its value divided by that 51-row sum. The mean, median, quartiles, and top-three, top-five, and top-ten shares were calculated from the same values. The chart displays the top 15 states, but all 51 jurisdictions are included in the summary statistics.
Five points to keep in mind
- These are absolute 2024 energy-consumption values, not renewable percentages.
- The fuel scope is EIA all renewables; petroleum, natural gas, and other fuel categories are outside this series.
- The unit is million MMBtu, so the values should not be numerically compared with MWh generation figures.
- The comparison total includes all 50 states and the District of Columbia.
- Explaining why states differ requires additional data on renewable source mix, generation, capacity, and electricity-market structure.
The clearest feature of the 2024 distribution is concentration at the top. Texas alone represented about one-fifth of the 51-jurisdiction sum, and Texas plus California exceeded 31%. The top three states accounted for 37.0% and the top ten for 60.2%. At the same time, every jurisdiction had a positive observation, so the data do not describe renewable energy use as limited to only a few locations. Read as an absolute EIA energy-consumption measure, the series provides a useful view of where the largest state-level values were recorded in 2024.
Frequently Asked Questions
Which state had the highest renewable energy consumption for electricity generation in 2024?
Texas led with 570.2 million MMBtu, or 20.0% of the total across the 50 states and District of Columbia.
Is this the same as a ranking of renewable electricity share?
No. This series is an absolute EIA energy-consumption measure in Btu. Renewable share requires a denominator such as total electricity generation.
How concentrated were the 2024 values?
The top three states accounted for 37.0% of the total and the top ten for 60.2%. The mean was 56.0 and the median 28.4 million MMBtu.
Related Articles
Green Map creates custom-edited map images using open geographic data sources such as geoBoundaries, Natural Earth, OpenStreetMap, and government open data. These maps are edited visual materials, not raw data files, and are provided for education, documents, presentations, and graphic reference.