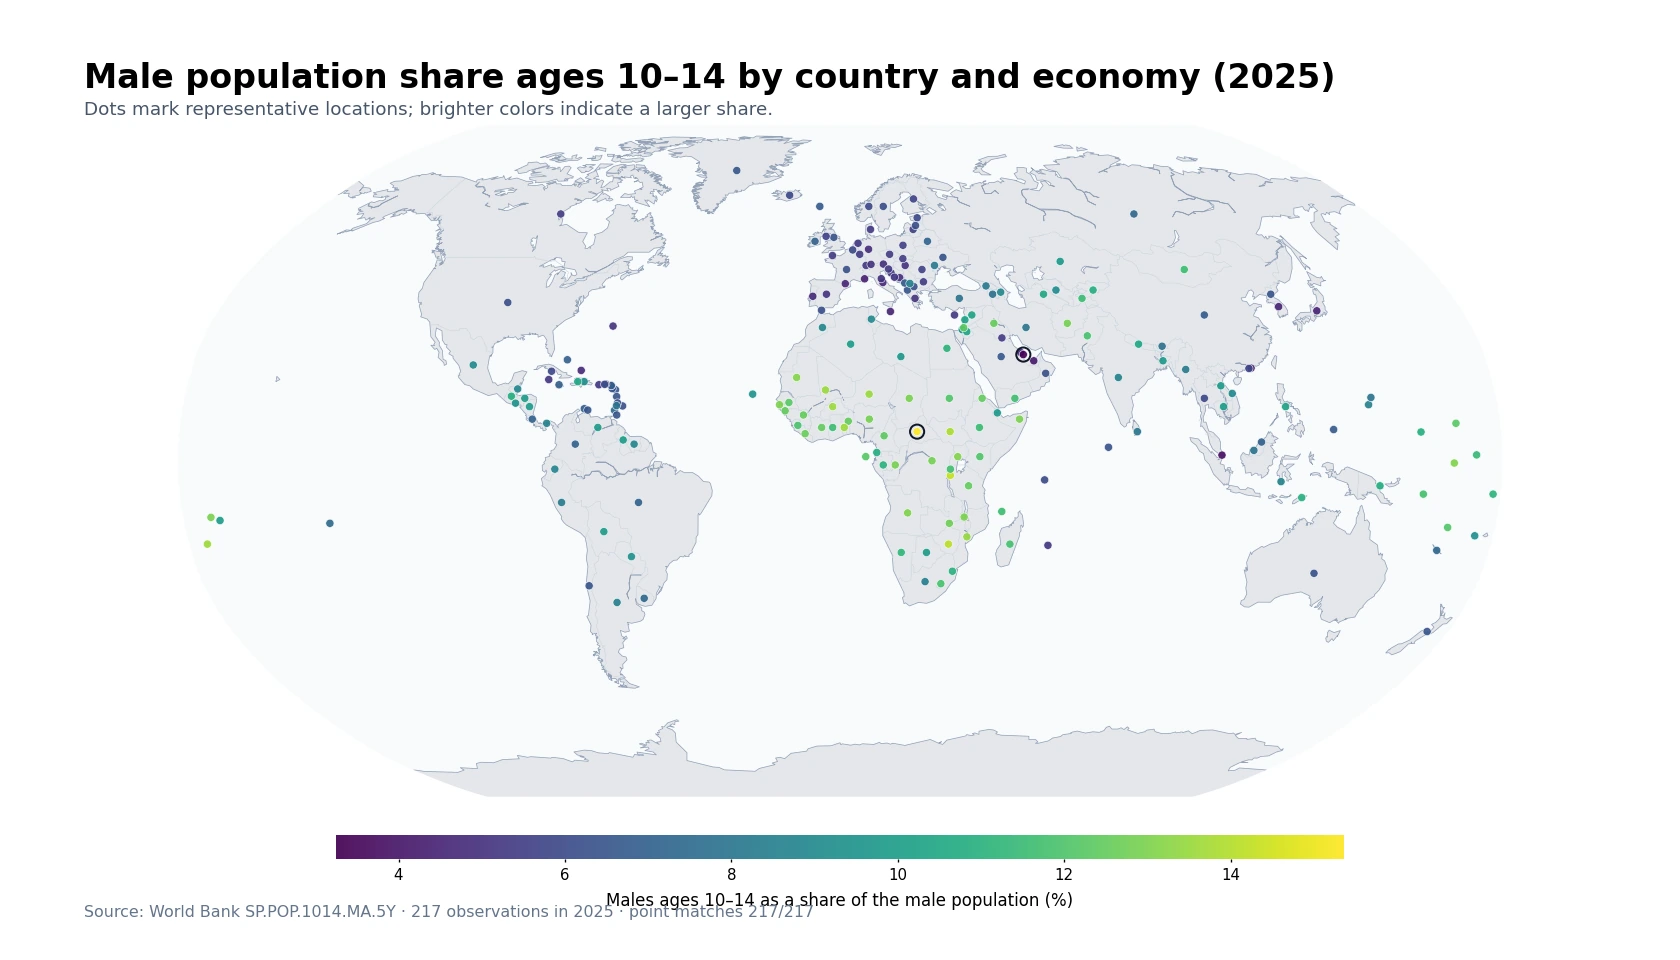
Total government health spending naturally looks larger in countries with larger populations. World Bank indicator SH.XPD.GHED.PC.CD removes that population-size effect by expressing health expenditure financed from domestic general government sources on a per-person basis in current US dollars. The result is a nominal dollar measure of government-financed health spending per resident, not a measure of total national health spending.
The latest-available dataset contains 193 economies. Of those observations, 184 are from 2023 and seven are from 2024; Cuba is represented by 2020 and Ukraine by 2021. The map shows each economy’s latest available value, but the ranking and distribution statistics below use only the 184 observations from 2023 so that nominal dollar values from different years are not mixed in the same comparison.
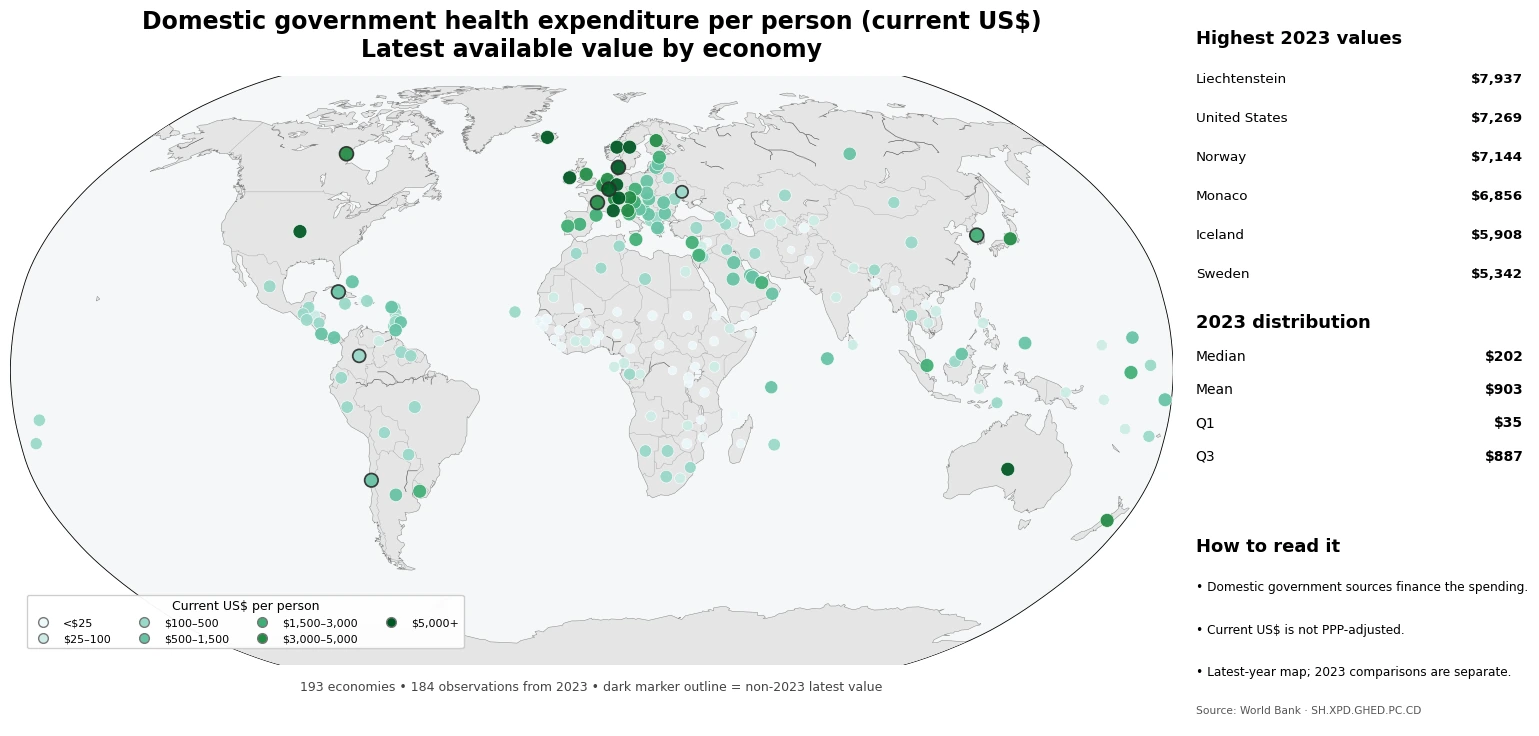
Table of Contents
This is a per-person dollar amount, not the government-financing share
A value of US$500 means that health expenditure financed from domestic general government sources was equivalent to 500 current US dollars per resident in that observation year. It does not mean that government financed 500 percent, or that government paid the same share of health expenditure as another country with the same dollar amount. The percentage of health spending financed by government is a different indicator with a different denominator.
Current US dollars are not purchasing-power adjusted. They are useful for understanding the nominal dollar scale of government-financed health spending per person. PPP-adjusted measures answer a different question by accounting for differences in local purchasing power. Current-dollar and PPP values should therefore not be merged into one ranking as though they were interchangeable.
The 2023 median was about US$202 per person
Across the 184 economies with 2023 observations, the median was US$202.04 per person and the simple mean was US$902.92. The first quartile was US$35.28 and the third quartile was US$886.75. The mean is more than four times the median because the distribution has a long upper tail: a relatively small group of countries reports several thousand dollars per person.
| 2023 current US$ per person | Economies |
|---|---|
| <$25 | 39 |
| $25–100 | 30 |
| $100–500 | 52 |
| $500–1,500 | 31 |
| $1,500–3,000 | 14 |
| $3,000–5,000 | 9 |
| $5,000+ | 9 |
The largest band is US$100–500, containing 52 economies. Another 39 are below US$25 and 30 fall between US$25 and US$100. At the other end, 18 economies exceed US$3,000 per person. This wide spread is why a single global average is not enough to describe the distribution.
The highest 2023 values cluster among wealthy countries
Liechtenstein records the highest 2023 value at about US$7,937 per person, followed by the United States at US$7,269, Norway at US$7,144 and Monaco at US$6,856. Iceland, Sweden, Ireland, Australia and Germany are also around or above US$5,000 per person. On the map, many of the highest markers appear across high-income Europe, North America and parts of Oceania.
| Economy | 2023 government-financed health expenditure per person |
|---|---|
| Liechtenstein | US$7,937 |
| United States | US$7,269 |
| Norway | US$7,144 |
| Monaco | US$6,856 |
| Iceland | US$5,908 |
| Sweden | US$5,342 |
| Ireland | US$5,268 |
| Australia | US$5,142 |
| Germany | US$5,059 |
| Austria | US$4,795 |
These figures are not a league table of health-system quality. They measure nominal government-financed health spending per resident. Outcomes, access, waiting times, coverage and efficiency require separate evidence. High income and high local prices can also raise the current-dollar amount, while small populations can make per-capita measures sensitive to changes in total spending.
Low current-dollar values need context too
The lowest 2023 observation is Afghanistan at about US$0.98 per person, with South Sudan, Somalia, Yemen and Burundi also near the bottom of the distribution. A low current-dollar amount does not by itself prove that government plays a small role in health financing. Income levels, fiscal capacity, exchange rates, local health-care prices and the size of the overall health system all affect the nominal dollar value.
Domestic government financing is only one component of health financing. Domestic private sources, households, insurance arrangements and external financing can all contribute to total health expenditure. To understand a country’s financing structure, the per-capita government amount is best read alongside total health expenditure per person and the shares financed by government, private and external sources.
Latest available and same-year comparisons should be separated
The map uses the latest available observation to maximize geographic coverage. Seven economies have a 2024 value—Canada, Chile, Colombia, Denmark, France, South Korea and Luxembourg—while Cuba and Ukraine have latest values from 2020 and 2021. Those nine observations are excluded from the 2023 ranking and summary statistics.
This distinction matters especially for a current-US-dollar indicator. Exchange-rate changes can move the dollar value even when the underlying real quantity of health resources changes less. For broad coverage, a latest-available map is useful; for a clean cross-country comparison, a common-year panel is preferable.
Three rules for reading the map
- The map covers 193 economies using the latest available observation, while the same-year 2023 statistics use 184 economies.
- Current US dollars are not PPP-adjusted, so current-dollar and PPP figures should not be treated as one common unit.
- A high value means more nominal government-financed health spending per resident; it does not by itself indicate better outcomes or greater efficiency.
Source: World Bank World Development Indicators, SH.XPD.GHED.PC.CD. The map and tables use the indicator’s latest available observations and the common-year 2023 subset described above.
Frequently Asked Questions
Does this indicator show the percentage of health spending financed by government?
No. It is domestic general government health expenditure per person in current US dollars. The government-financing share is a separate percentage indicator.
How is current US$ different from PPP-adjusted health spending per person?
Current US dollars show nominal dollar amounts, while PPP adjustment accounts for differences in purchasing power. They answer different questions and should not be mixed as one unit.
Why does the map cover more economies than the 2023 ranking?
The map uses the latest available value for 193 economies. The ranking and summary statistics use only the 184 economies with a 2023 observation so that different nominal-dollar years are not mixed.
Related Articles
Green Map creates custom-edited map images using open geographic data sources such as geoBoundaries, Natural Earth, OpenStreetMap, and government open data.
These maps are edited visual materials, not raw data files, and are provided for education, documents, presentations, and graphic reference.