World Bank indicator TX.VAL.MRCH.R2.ZS measures the share of a reporting economy’s total merchandise exports that goes to low- and middle-income economies in Europe and Central Asia. It is a destination-composition measure, not a ranking of export size. A value of 20% means that roughly one-fifth of the reporting economy’s merchandise exports by value were shipped to this partner group.
The latest-available file contains 204 countries and areas. 192 observations are dated 2023, while 12 use an earlier latest-available year. Among the 192 observations from 2023, the median is 0.94% and the unweighted mean is 5.10%. The mean is much higher because a small set of economies has shares above 20%, 30%, or even 50%, producing a long upper tail.
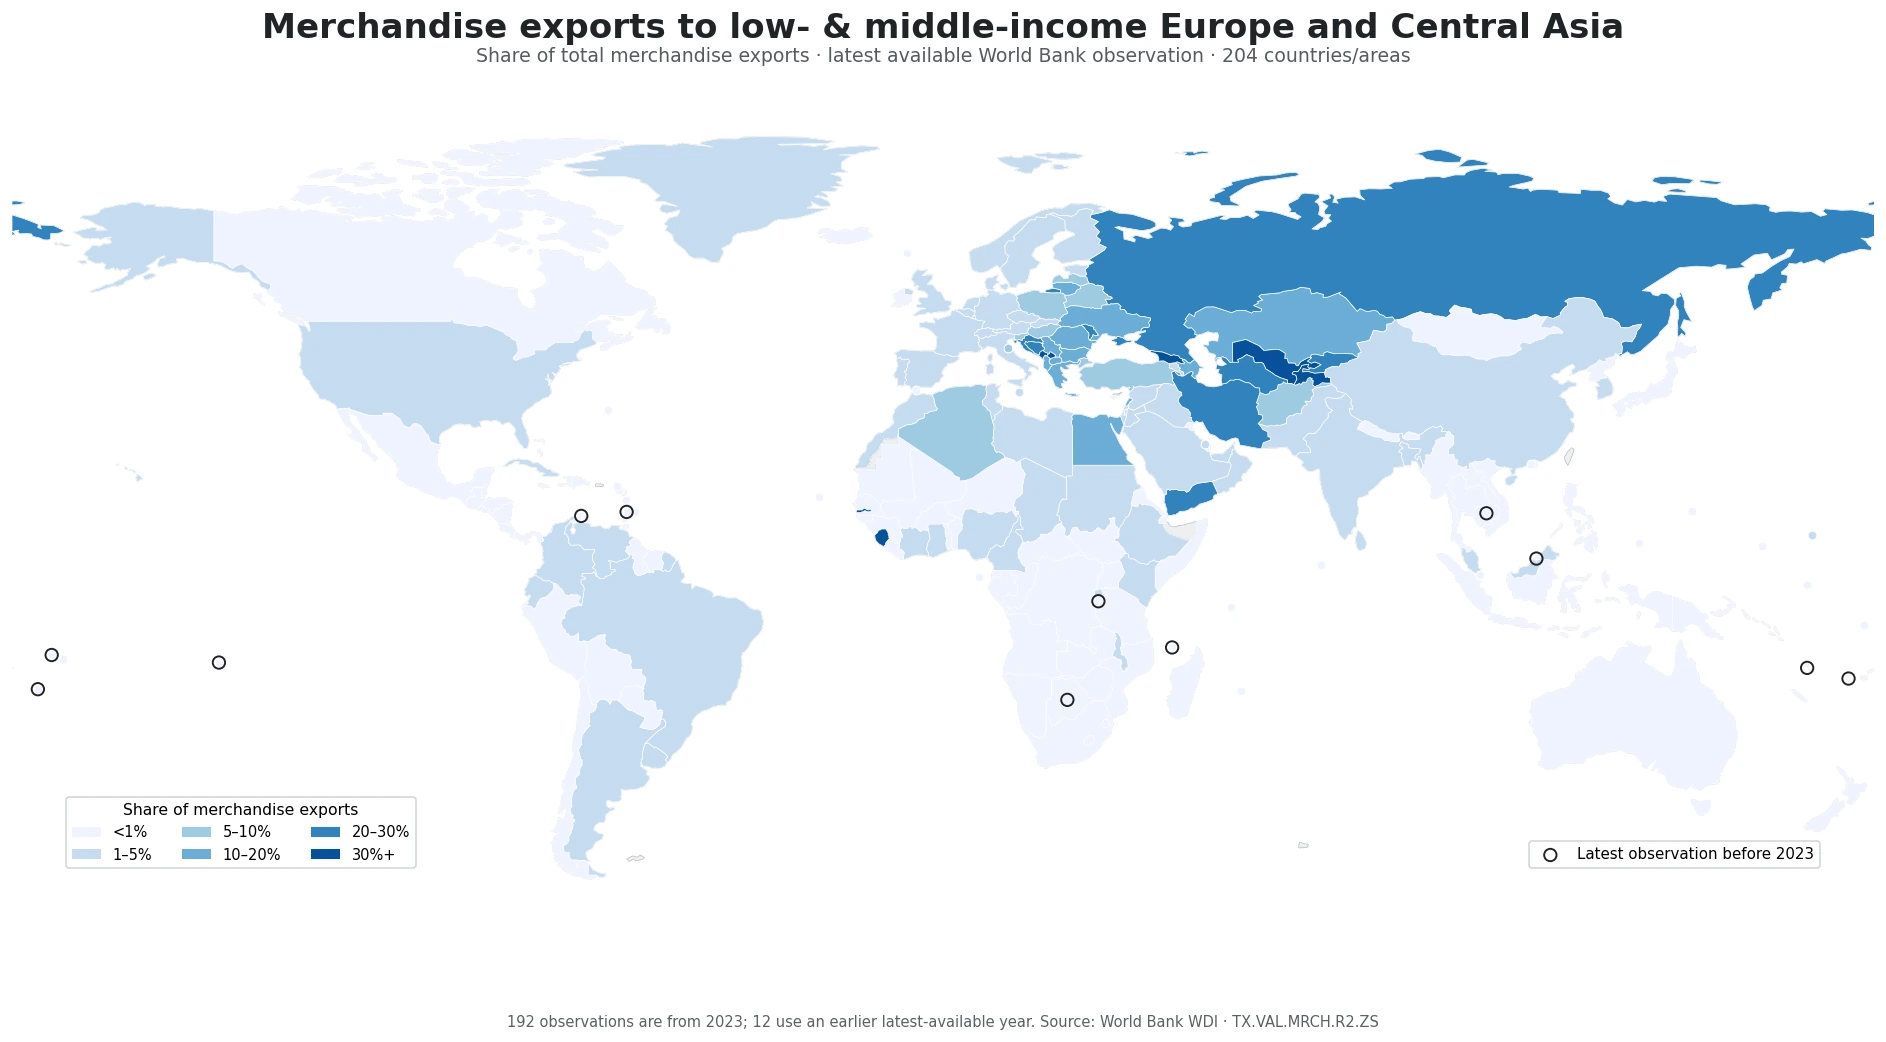
Table of Contents
What the indicator actually measures
The numerator is merchandise exports from the reporting economy to low- and middle-income economies classified by the World Bank in Europe and Central Asia. The denominator is the reporting economy’s total merchandise exports. This means the percentage answers a destination-mix question: what portion of goods exports went to this particular partner group? It does not answer how large the country’s exports were in dollars, how important exports were relative to GDP, or whether the country ran a trade surplus.
The partner definition also needs care. The numerator does not simply include every economy geographically located in Europe and Central Asia. It follows the World Bank’s regional and income classifications used by the indicator. The World Bank notes that the measure is computed only when sufficient partner-group data are available. The series is therefore best treated as a standardized partner-group share, not as a complete bilateral trade matrix or a direct measure of economic dependence.
More than half of the 2023 observations are below 1%
Of the 192 observations dated 2023, 97 are below 1% and another 59 are between 1% and 5%. Together, 156 countries and areas, about 81% of the same-year sample, are below 5%. Only 27 are at or above 10%, 15 are at or above 20%, and seven reach 30% or more. For most reporting economies, low- and middle-income Europe and Central Asia is therefore a relatively small destination group within total merchandise exports.
| 2023 share | Countries/areas |
|---|---|
| Below 1% | 97 |
| 1–5% | 59 |
| 5–10% | 9 |
| 10–20% | 12 |
| 20–30% | 8 |
| 30% or more | 7 |
The distribution is strongly right-skewed. A simple global mean of 5.10% would make the typical observation look much larger than it is, because the median is only 0.94%. For a typical-country comparison, the median and the band counts are more informative than the mean alone. The map adds the spatial dimension by showing where the unusually high shares are concentrated and where neighboring countries diverge.
The upper tail is concentrated in the Caucasus, Central Asia and parts of the Balkans
The highest 2023 observation is The Gambia at 96.95%. Georgia follows at 61.99%, Montenegro at 51.62%, Tajikistan at 45.07%, Kosovo at 42.90%, Uzbekistan at 36.37%, and Sierra Leone at 34.30%. The Islamic Republic of Iran records 29.26%, the Kyrgyz Republic 28.31%, and the Russian Federation 26.34%. Many high observations sit in or near Europe and Central Asia, but The Gambia and Sierra Leone show that the pattern is not simply geographic proximity.
| Rank | Country/area | Share of merchandise exports |
|---|---|---|
| 1 | Gambia, The | 96.95% |
| 2 | Georgia | 61.99% |
| 3 | Montenegro | 51.62% |
| 4 | Tajikistan | 45.07% |
| 5 | Kosovo | 42.90% |
| 6 | Uzbekistan | 36.37% |
| 7 | Sierra Leone | 34.30% |
| 8 | Iran, Islamic Rep. | 29.26% |
| 9 | Kyrgyz Republic | 28.31% |
| 10 | Russian Federation | 26.34% |
The map is descriptive rather than causal. Proximity may matter for some economies, but destination shares can also reflect rail and road links, ports, commodity flows, re-exports, established commercial networks, trade agreements, tariffs, and the composition of exported products. A high value far from the partner region is a reminder that distance alone cannot explain the ratio. Identifying the mechanism requires bilateral destination data and, in many cases, product-level trade records.
Neighboring countries can have very different export destination shares
Central Asia illustrates the spread clearly. Tajikistan is at 45.07%, Uzbekistan 36.37%, Turkmenistan 25.35%, and Kazakhstan 13.21%. In the Caucasus, Georgia reaches 61.99% while Azerbaijan is 19.40%. The Russian Federation is 26.34%, Ukraine 12.27%, and Türkiye 9.26%. These gaps show that broad geography does not determine the result by itself; actual trade relationships differ sharply within the same part of the world.
Major Western European exporters are much lower: Germany is 3.52%, France 2.94%, the United Kingdom 2.73%, and Italy 4.14%. Parts of the Balkans are higher, with Montenegro at 51.62%, Croatia at 21.44%, Bosnia and Herzegovina at 20.44%, Serbia at 18.94%, and North Macedonia at 15.20%. The contrast is more informative than a single Europe-wide average because the indicator is calculated for each reporting economy separately.
| Country/area | 2023 share |
|---|---|
| Gambia, The | 96.95% |
| Georgia | 61.99% |
| Montenegro | 51.62% |
| Tajikistan | 45.07% |
| Kosovo | 42.90% |
| Uzbekistan | 36.37% |
| Iran, Islamic Rep. | 29.26% |
| Russian Federation | 26.34% |
| Turkmenistan | 25.35% |
| Kazakhstan | 13.21% |
| Ukraine | 12.27% |
| Turkiye | 9.26% |
| Germany | 3.52% |
| France | 2.94% |
| Italy | 4.14% |
| United Kingdom | 2.73% |
| China | 3.46% |
| India | 2.45% |
| United States | 1.02% |
| Japan | 0.88% |
Several large exporters outside the region have low shares
China records 3.46%, India 2.45%, the United States 1.02%, Brazil 1.30%, Japan 0.88%, Canada 0.28%, and Mexico 0.11%. These small percentages do not mean that the economies have small export sectors. They mean that only a relatively small part of merchandise exports was directed to this specific World Bank partner group. Absolute export value is a separate measure and can be very large even when the percentage reported here is low.
The reverse is also important. A high percentage is not automatically a positive or negative trade outcome. It indicates concentration in one destination group. An economy with diversified destinations may post a lower share, while an economy tied closely to a few markets in the partner group may post a higher one. Evaluating resilience or diversification would require additional measures such as destination concentration, top-partner shares, product concentration, export values, and changes over time.
The Gambia is an extreme outlier in the 2023 distribution
The Gambia’s 96.95% observation is 34.96 percentage points above Georgia, the second-highest 2023 value. That extreme upper value helps explain why the mean is 5.10% even though the median is below 1%. A statement such as “the average country sends about 5% of exports to this group” would therefore be misleading without context. Most observations are much lower, and the mean is being pulled upward by a small number of very large ratios.
An outlier should not be assumed to be an error, but it deserves careful interpretation. Because total merchandise exports are the denominator, the ratio can rise sharply when export destinations become concentrated in a particular year. The indicator does not identify re-exports, individual products, or specific bilateral partners within the group. Explaining why such a high share occurs requires a deeper look at destination and product-level trade records rather than an inference from the percentage alone.
Twelve latest observations predate 2023
Twelve of the 204 latest-available observations are older than 2023. Samoa is from 2009; Tonga and Vanuatu from 2011; Burundi and Cambodia from 2014; Fiji from 2017; Comoros from 2020; Botswana and French Polynesia from 2021; and Aruba, Brunei Darussalam, and St. Vincent and the Grenadines from 2022. They remain on the map for coverage but are marked with hollow dark rings and are excluded from the 2023 distribution and ranking statements above.
| Country/area | Latest year | Share |
|---|---|---|
| Samoa | 2009 | 0.00% |
| Tonga | 2011 | 0.01% |
| Vanuatu | 2011 | 0.31% |
| Burundi | 2014 | 0.01% |
| Cambodia | 2014 | 0.48% |
| Fiji | 2017 | 0.05% |
| Comoros | 2020 | 0.27% |
| Botswana | 2021 | 0.00% |
| French Polynesia | 2021 | 0.00% |
| Aruba | 2022 | 0.00% |
| Brunei Darussalam | 2022 | 0.00% |
| St. Vincent and the Grenadines | 2022 | 0.00% |
A latest-available map is useful for seeing broad coverage, but it is not a perfectly synchronized same-year panel. The time gap is especially important for observations from 2009 to 2017, because trade structures may have changed materially since then. For strict country rankings, use the 192 observations that are actually dated 2023. For older observations, treat the map as a reference to the latest value available in the supplied series rather than as a current 2023 reading.
Three checks before comparing countries
- Check the denominator. The percentage is a share of total merchandise exports, not exports as a share of GDP or a share of total trade.
- Check the partner definition. The numerator covers low- and middle-income economies in the World Bank Europe and Central Asia group, not every economy geographically located there.
- Check the observation year. 192 values are from 2023, while 12 are older latest observations and should not be mixed into a strict same-year ranking.
The source is the World Bank World Development Indicators series TX.VAL.MRCH.R2.ZS. The map and tables preserve the reported observation year and percentage for each country or area. Missing values and older observations are not converted to zero. The 2023 median, mean, ranking, and distribution counts use only the 192 records actually dated 2023.
Frequently Asked Questions
Does a high percentage mean the economy exports a large amount in absolute terms?
No. The indicator measures the destination composition of merchandise exports, not the absolute value of exports.
Does the partner group include every economy in Europe and Central Asia?
No. It covers low- and middle-income economies in the World Bank Europe and Central Asia group according to the indicator definition.
Why are some map values older than 2023?
The file uses each economy’s latest non-empty observation. 192 values are dated 2023 and 12 are older; the older observations are marked separately and excluded from strict 2023 rankings.
Related Articles
Green Map creates custom-edited map images using open geographic data sources such as geoBoundaries, Natural Earth, OpenStreetMap, and government open data. These maps are edited visual materials, not raw data files, and are provided for education, documents, presentations, and graphic reference.