Export taxes can play a very different role in government revenue from one economy to another. World Bank series GC.TAX.EXPT.ZS measures export taxes as a share of total tax revenue. Export taxes become payable when goods leave the economic territory or when services are delivered to non-residents. This article compares only the 28 economies in the source extract that actually have a 2024 observation.
The underlying file contains 100 latest non-missing observations, but 72 of them are dated between 1980 and 2023. Combining those older values with 2024 data would mix tax systems from very different periods. For that reason, every map class, ranking, mean and median below is calculated from the 28 observations dated 2024. The result is a synchronized but incomplete 2024 comparison, not a full-world census.
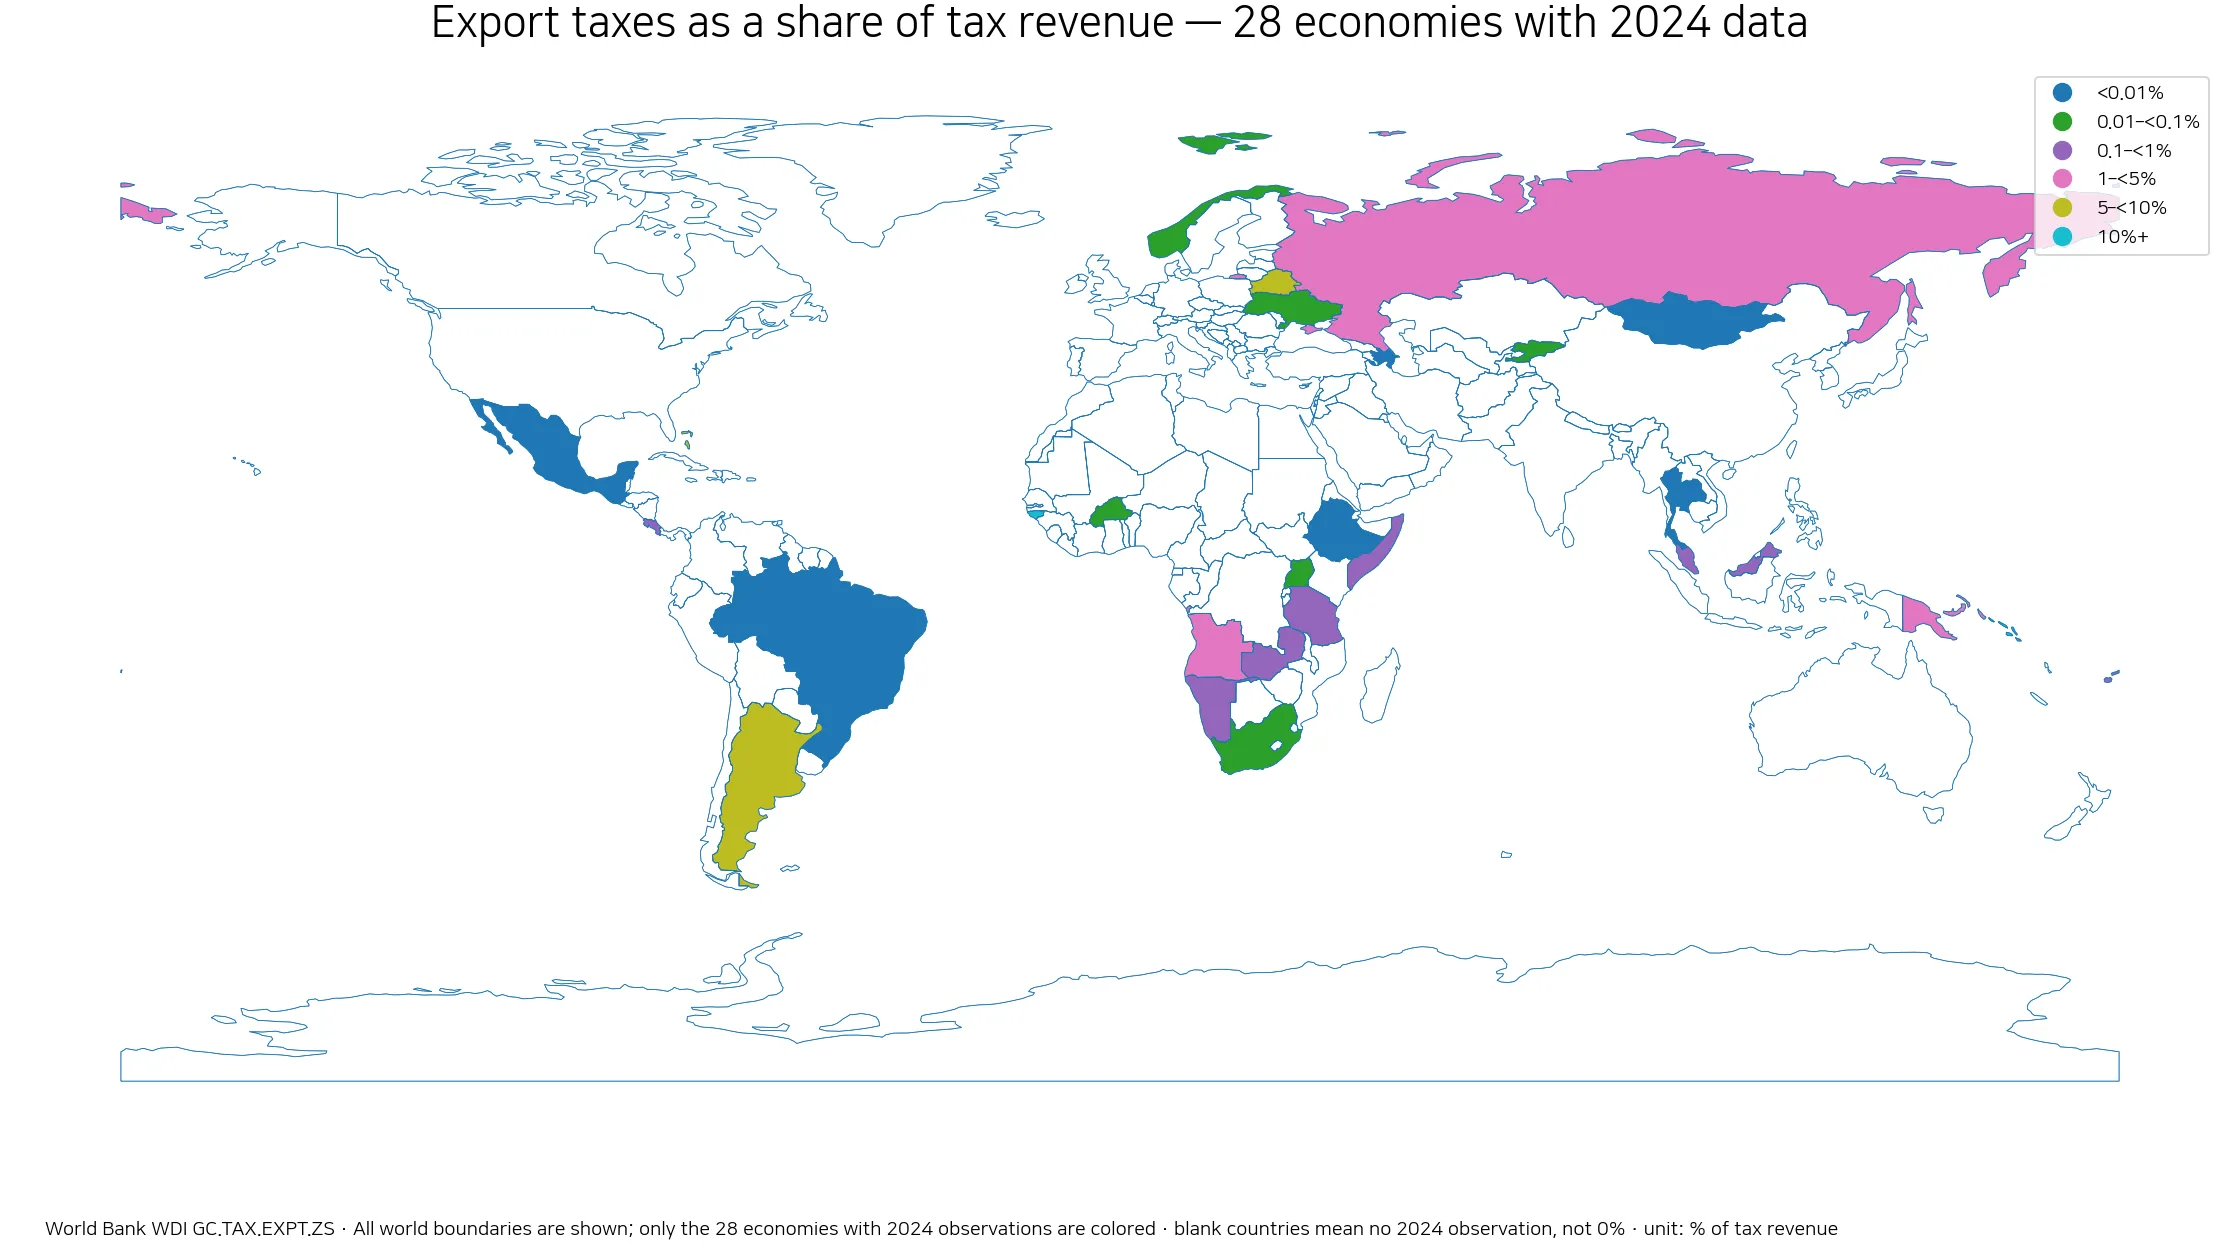
Table of Contents
What export taxes as a share of tax revenue measure
World Bank metadata defines export taxes as taxes on goods or services that become payable to government when goods leave the economic territory or when services are supplied to non-residents. The denominator is total tax revenue, which covers compulsory and unrequited payments in cash or in kind to government units. The indicator therefore measures tax-revenue composition rather than an export tax rate.
A value of 10% means that export taxes account for about one tenth of total tax revenue under the statistical definition. It does not mean that exports face a 10% tax rate. A country can have high export volumes and a low indicator if export taxes are small or if other taxes dominate government revenue. Conversely, a narrower economy can show a high share when export-tax receipts are important relative to the total tax base.
The median is 0.228%, compared with a 2.05% mean
Among the 28 observations dated 2024, the simple mean is 2.05% and the median is only 0.228%. The large gap reflects a strongly right-skewed distribution. Thirteen observations are below 0.1%, 20 are below 1%, only five reach at least 5%, and only two exceed 10%.
| 2024 export-tax share | Countries/economies |
|---|---|
| Below 0.01% | 7 |
| 0.01–<0.1% | 6 |
| 0.1–<1% | 7 |
| 1–<5% | 3 |
| 5–<10% | 3 |
| 10%+ | 2 |
The median shows that export taxes make up a very small fraction of tax revenue for the middle observation in this limited 2024 sample. The mean is much higher because Guinea-Bissau and Solomon Islands exceed 10%, while Argentina and The Bahamas are near 9%. Reporting both statistics avoids making the upper-tail values look typical.
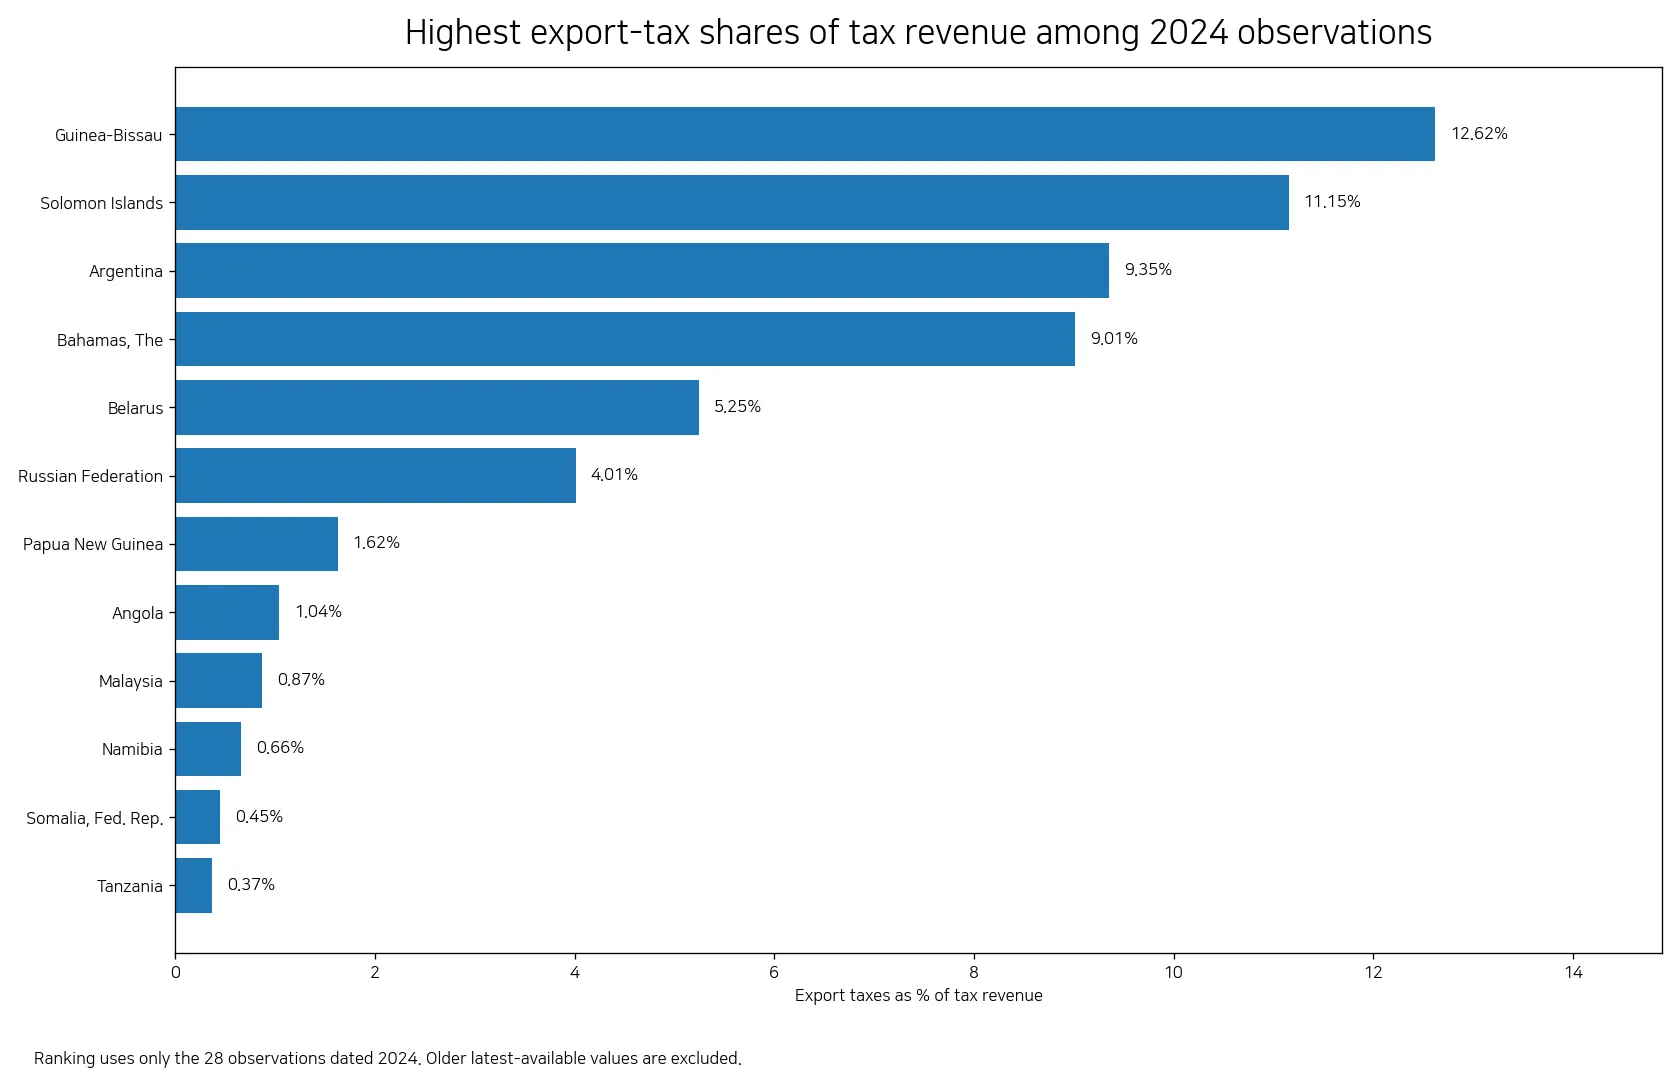
Guinea-Bissau and Solomon Islands exceed 10%
Guinea-Bissau records the highest 2024 value at 12.619%, followed by Solomon Islands at 11.152%. Argentina is at 9.352%, The Bahamas 9.010%, Belarus 5.249%, and the Russian Federation 4.011%. Papua New Guinea reaches 1.625% and Angola 1.043%. Those eight are the only observations above 1% in the 2024 subset.
| Country/economy | Export taxes as % of tax revenue |
|---|---|
| Guinea-Bissau | 12.619% |
| Solomon Islands | 11.152% |
| Argentina | 9.352% |
| Bahamas, The | 9.010% |
| Belarus | 5.249% |
| Russian Federation | 4.011% |
| Papua New Guinea | 1.625% |
| Angola | 1.043% |
| Malaysia | 0.871% |
| Namibia | 0.661% |
Malaysia is at 0.871%, Namibia 0.661%, Somalia 0.449%, Tanzania 0.372%, Fiji 0.312%, and Zambia 0.293%. Costa Rica is at 0.163%. Uganda, Ukraine, Norway, South Africa, Burkina Faso and the Kyrgyz Republic are below 0.1%, while Azerbaijan, Ethiopia, Thailand, Brazil, Mongolia, Mexico and Guatemala are below 0.01%.
A high share is not the same as a large export sector
The indicator does not measure exports, trade openness or the statutory tax rate on exported products. It measures how much export-tax revenue contributes to the government’s total tax take. A major exporting economy can show a low ratio when export taxes are absent or when revenue from income, consumption and other taxes is much larger.
Similarly, a high ratio does not establish that a country exports more than its peers. Export composition matters, as do the design of export duties, exemptions, the breadth of the domestic tax base and the relative size of other tax sources. Physical export volumes and trade values must be studied with separate trade datasets.
The 2024 observations do not form one regional bloc
The highest values are geographically dispersed: Guinea-Bissau in West Africa, Solomon Islands in the Pacific, Argentina in South America, The Bahamas in the Caribbean, and Belarus in Eastern Europe. That pattern argues against treating export-tax reliance as a single regional phenomenon. National tax design and export structure appear more important for interpreting this small same-year sample.
Differences within regions are also large. Among African observations, Guinea-Bissau is at 12.619%, while Angola is at 1.043%, Namibia 0.661%, Somalia 0.449%, Tanzania 0.372%, Zambia 0.293%, Uganda 0.069%, Burkina Faso 0.014%, and Ethiopia 0.001%. In Europe and Eurasia, Belarus and Russia are above 4%, while Norway and Ukraine are around 0.04%.
The biggest limitation is coverage: only 28 observations are from 2024
The source query retrieves the most recent non-missing value for each economy rather than a complete panel for one year. That produces 100 rows, but their dates span several decades. Treating all 100 as if they represented 2024 would create a false impression of contemporaneous global coverage. This article therefore accepts narrower geography in exchange for a consistent year.
An unshaded country on the map should not be read as having a zero export-tax share. It usually means that the source extract does not contain a 2024 observation for that economy, or that a very small location does not match directly to the simplified world boundary. A more complete global map would require a new synchronized-year pull with sufficient country coverage.
Very low shares can still coexist with economically important export taxes
A ratio below 0.01% means export taxes contribute very little to total tax revenue, but it does not prove that every export tax is economically irrelevant. A narrowly targeted duty can influence a specific commodity market while generating little revenue relative to the government’s overall tax base. This series is designed to describe revenue composition, not the broader economic incidence of export taxation.
The reverse is also true: a high revenue share is not by itself evidence that an export-tax policy is beneficial or harmful. Export taxes may be used for revenue, domestic supply objectives, or incentives for local processing, but assessing their effects requires product-level trade data, prices, production and the wider tax system. This indicator answers a narrower fiscal question.
All 2024 observations in the source
Because the synchronized sample contains only 28 observations, the full set can be shown rather than limiting the article to a top-ten table. Very small values are retained instead of being rounded to zero.
| Country/economy | Export taxes as % of tax revenue |
|---|---|
| Guinea-Bissau | 12.619% |
| Solomon Islands | 11.152% |
| Argentina | 9.352% |
| Bahamas, The | 9.010% |
| Belarus | 5.249% |
| Russian Federation | 4.011% |
| Papua New Guinea | 1.625% |
| Angola | 1.043% |
| Malaysia | 0.871% |
| Namibia | 0.661% |
| Somalia, Fed. Rep. | 0.449% |
| Tanzania | 0.372% |
| Fiji | 0.312% |
| Zambia | 0.293% |
| Costa Rica | 0.163% |
| Uganda | 0.069% |
| Ukraine | 0.043% |
| Norway | 0.041% |
| South Africa | 0.028% |
| Burkina Faso | 0.014% |
| Kyrgyz Republic | 0.013% |
| Azerbaijan | 0.010% |
| Ethiopia | 0.001% |
| Thailand | 0.001% |
| Brazil | 0.000% |
| Mongolia | 0.000% |
| Mexico | 0.000% |
| Guatemala | 0.000% |
Data source and calculation method
The numeric source is World Bank World Development Indicators series GC.TAX.EXPT.ZS. World Bank metadata identifies the IMF Government Finance Statistics Yearbook and related data files as the underlying source. Every ranking, average, median and map category in this article is calculated from the 28 observations dated 2024.
The other 72 latest-available observations in the extracted file are intentionally excluded from the same-year analysis because they are dated 2023 or earlier, with some values reaching back to the 1980s and 1990s. That choice prevents stale tax structures from being presented as if they were current 2024 conditions.
Frequently Asked Questions
Does a 10% export-tax share mean exports are taxed at 10%?
No. The indicator measures export-tax revenue as a share of total tax revenue. It is not the statutory tax rate applied to exported goods or services.
Which economy has the highest 2024 value in this dataset?
Among the 28 observations dated 2024, Guinea-Bissau is highest at about 12.62%, followed by Solomon Islands at about 11.15% and Argentina at about 9.35%.
Why are only 28 observations used when the source has 100 rows?
The 100 rows are latest non-missing values with years ranging from 1980 to 2024. Only 28 are actually dated 2024, so the same-year analysis excludes the older observations.
Does an unshaded country on the map have a 0% export-tax share?
No. It usually means that the extracted dataset does not contain a 2024 observation for that economy or the location is not directly represented in the simplified map boundary.
Related Articles
Green Map creates custom-edited map images using open geographic data sources such as geoBoundaries, Natural Earth, OpenStreetMap, and government open data.
These maps are edited visual materials, not raw data files, and are provided for education, documents, presentations, and graphic reference.