The Netherlands has only 12 provinces, but their population sizes differ substantially. Statistics Netherlands (CBS) StatLine table 37259ENG provides a consistent snapshot for 1 January 2025. Summing the 12 province observations gives 18,044,027 people. The extract uses the total-sex category and province codes PV20 through PV31, while national and municipal rows are outside this comparison.
Zuid-Holland is the largest province by population at 3,863,397. Noord-Holland follows with 2,992,016, Noord-Brabant with 2,664,047, and Gelderland with 2,161,358. At the other end, Zeeland has 392,969 residents. The largest province therefore has about 9.83 times the population of the smallest.
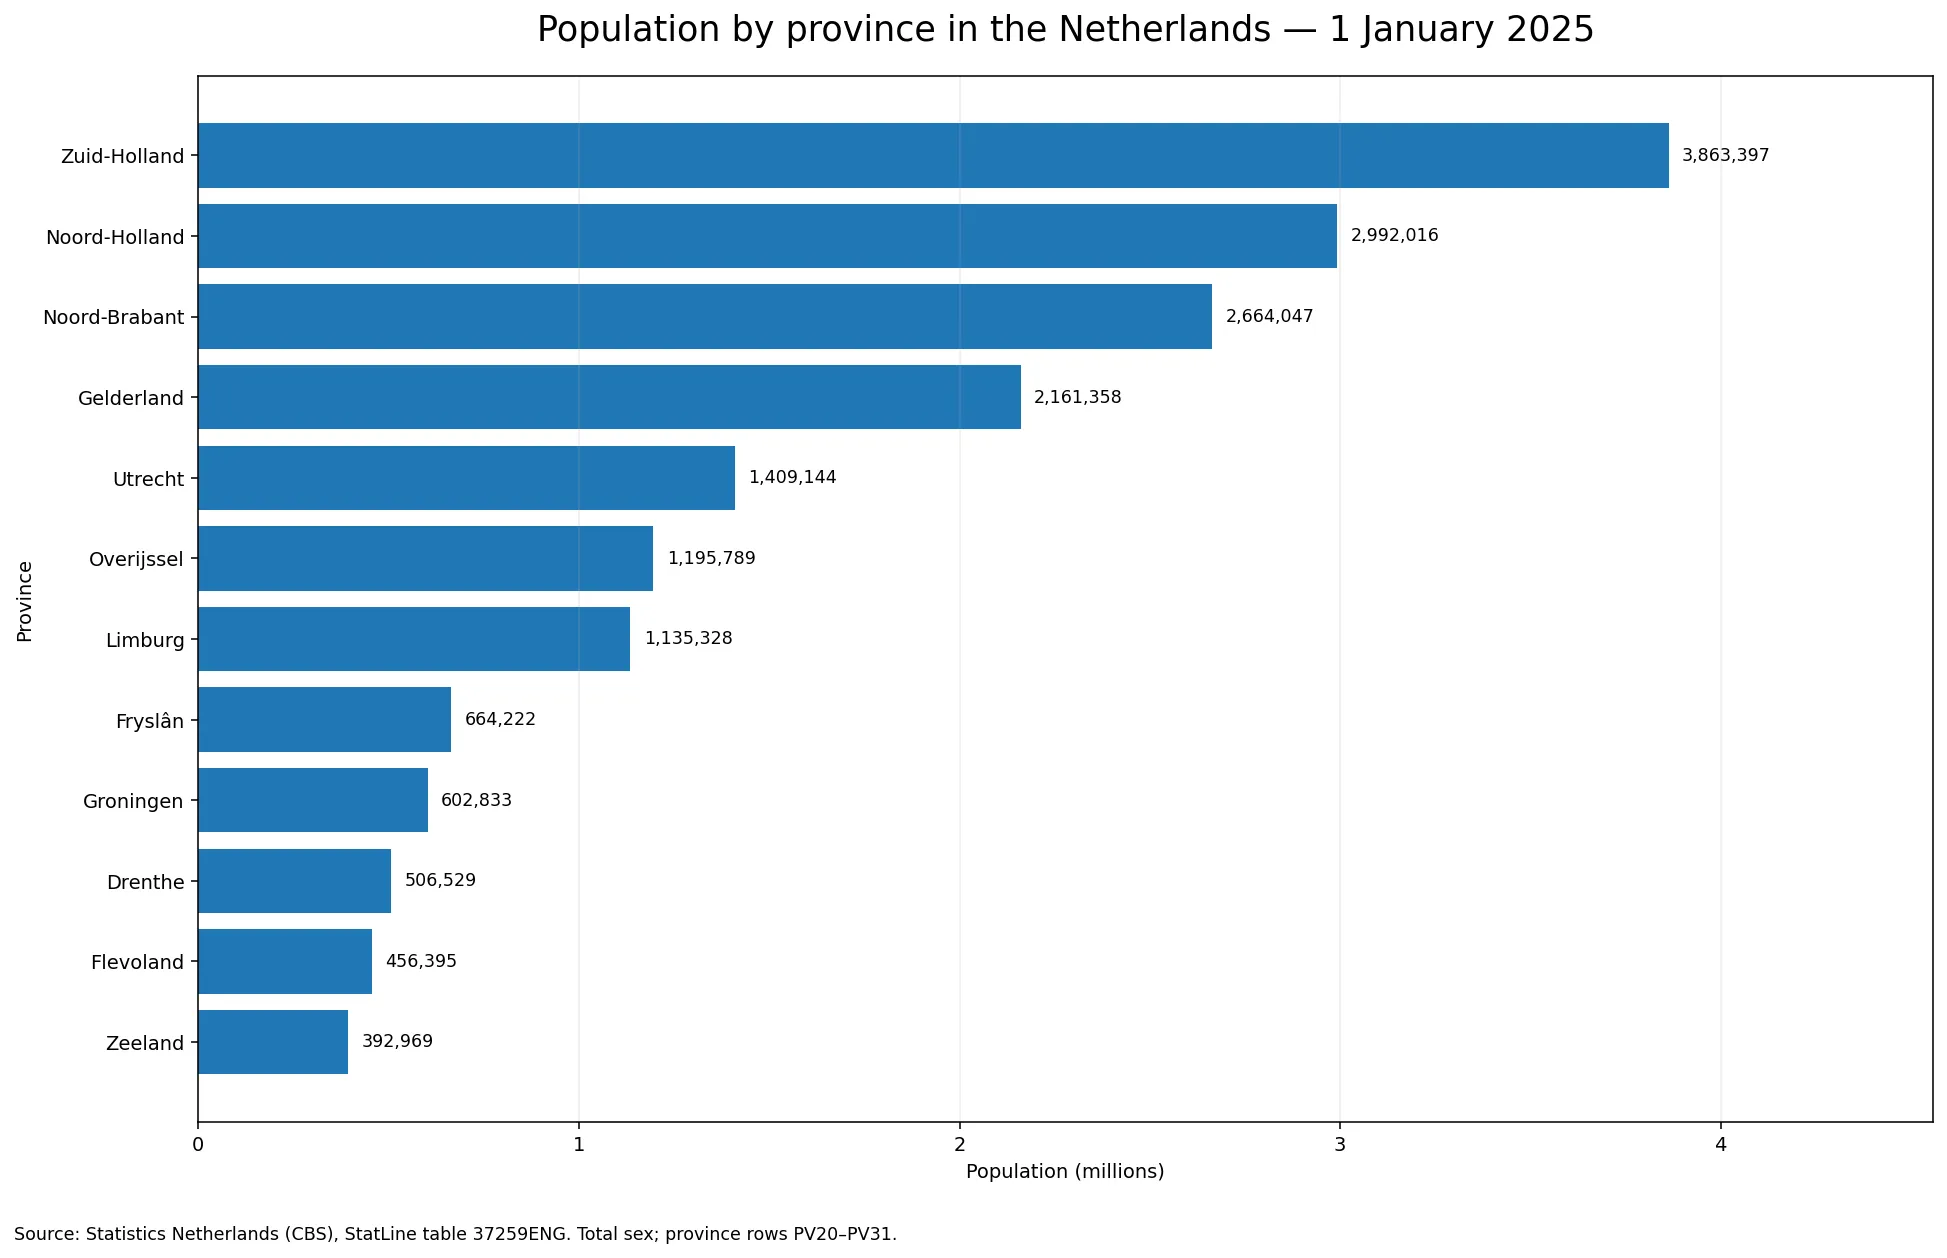
Table of Contents
Population across all 12 provinces on 1 January 2025
The 12 province observations sum to 18,044,027 people. The simple mean is 1,503,669, while the median is 1,165,558.5. The mean sits roughly 338,110 above the median because several very populous provinces pull the average upward. The first quartile is 578,757 and the third quartile is 2,287,030, placing the middle half of provinces between roughly 579,000 and 2.29 million residents.
7 provinces have at least one million residents, while 3 have fewer than 600,000. With only 12 units, every province is easy to inspect individually, but the distribution still spans a wide range. A single average therefore hides important differences between the largest western and southern population concentrations and the smaller provinces.
| Province | Population | Share of 12-province total |
|---|---|---|
| Zuid-Holland | 3,863,397 | 21.41% |
| Noord-Holland | 2,992,016 | 16.58% |
| Noord-Brabant | 2,664,047 | 14.76% |
| Gelderland | 2,161,358 | 11.98% |
| Utrecht | 1,409,144 | 7.81% |
| Overijssel | 1,195,789 | 6.63% |
| Limburg | 1,135,328 | 6.29% |
| Fryslân | 664,222 | 3.68% |
| Groningen | 602,833 | 3.34% |
| Drenthe | 506,529 | 2.81% |
| Flevoland | 456,395 | 2.53% |
| Zeeland | 392,969 | 2.18% |
Which provinces have the largest populations?
Zuid-Holland accounts for 21.41% of the 12-province total with 3,863,397 residents. Noord-Holland contributes 16.58% with 2,992,016, followed by Noord-Brabant at 14.76% with 2,664,047. Gelderland adds another 11.98% with 2,161,358.
The three largest provinces together contain 52.76% of the 12-province population. Expanding the group to the five largest raises the share to 72.54%. In other words, fewer than half of the provinces account for more than seven-tenths of the population represented in the province rows.
How do the middle and smaller provinces compare?
Overijssel has 1,195,789 residents and Limburg 1,135,328, keeping both above the one-million mark. Fryslân stands at 664,222 and Groningen at 602,833. Drenthe has 506,529, Flevoland 456,395, and Zeeland 392,969. These lower-population provinces are not “small” in every geographic or economic sense; the figures describe resident counts only.
The median of 1,165,558.5 lies between Overijssel and Limburg. The ratio between Zuid-Holland and Zeeland is about 9.83 to one. That difference is useful for understanding scale, but it should not be converted into a judgment about economic strength, urbanization, prosperity or public-service quality without additional data.
What does the concentration of population tell us?
Zuid-Holland and Noord-Holland together represent almost 38% of the 12-province total. Adding Noord-Brabant pushes the combined share above one-half. Each province is one administrative unit, yet the number of residents represented by those units is very uneven. This matters whenever province-level totals are compared without adjusting for population size.
For example, two provinces can report the same number of facilities, jobs, housing completions or incidents but have very different per-capita rates. Absolute population is therefore a useful denominator and a baseline for demand, but it is not itself a measure of policy performance or living conditions.
A population level is not a population growth rate
These figures describe the population on 1 January 2025. They do not show whether a province was growing or shrinking during 2024, nor do they identify migration, births or deaths as causes of change. Growth requires at least one earlier observation measured with the same geography and definition.
A time series built from the same CBS measure could answer those questions more directly. Comparing 1 January values across multiple years would show absolute and percentage change, while demographic-flow tables could separate natural increase from migration. This article deliberately stays with the point-in-time population level so that a stock measure is not confused with a change measure.
Population size and population density answer different questions
A large population does not necessarily mean a province is more densely settled. Density requires land area as a denominator, and a geographically large province can have a high population but a moderate density. Conversely, a compact province can rank lower in absolute population while still having a high number of residents per square kilometre.
Absolute population is best used to understand scale: the number of people living within an administrative area. Density is more useful for spatial concentration. Age structure, households, employment, housing and commuting indicators add further context. Keeping these measures separate prevents a simple population ranking from being interpreted more broadly than the data support.
Source, coverage and calculation method
The source is Statistics Netherlands (CBS), StatLine table 37259ENG. The measure is “Population on 1 January,” using the total-sex category, the 2025 reference period and province codes PV20 through PV31. The unit is people. All 12 province rows contain observed values; there are no missing or suppressed observations in the extract.
The sum of the 12 values is 18,044,027. Province shares are calculated by dividing each province value by that 12-row total. The visual uses exactly the same observations. Because no province-boundary geometry was supplied with the verified data, the comparison is shown as a complete ranking chart rather than a choropleth whose boundaries could not be independently verified.
Frequently Asked Questions
What is the combined population of the 12 Dutch provinces on 1 January 2025?
The 12 province observations sum to 18,044,027 people. National and municipal aggregate rows are not part of this 12-province comparison.
Which Dutch province has the largest population?
Zuid-Holland is largest at 3,863,397, followed by Noord-Holland at 2,992,016 and Noord-Brabant at 2,664,047.
Does this dataset show which province is growing fastest?
No. It is a point-in-time population snapshot for 1 January 2025. Growth requires an earlier observation using the same geographic and statistical definition.
Related Articles
Green Map creates custom-edited map images using open geographic data sources such as geoBoundaries, Natural Earth, OpenStreetMap, and government open data.
These maps are edited visual materials, not raw data files, and are provided for education, documents, presentations, and graphic reference.