Financial access looks very different when the comparison is limited to adults with primary education or less. In the World Bank’s 2024 FX.OWN.TOTL.PL.ZS observations, 139 reporting economies have a numeric value. The median is 57.3% and the mean is 59.3%. The denominator matters: these percentages describe people age 15 and older within the primary-education-or-less subgroup, not the entire adult population and not the share of a country that has low educational attainment.
The source contains 217 country and economy rows. Of those, 78 do not have a 2024 value. Rankings and distribution statistics use only the 139 numeric observations. Missing rows are not converted to zero. On the map, a gray or hatched area therefore means that no mapped 2024 value is available or that the low-resolution boundary set does not contain a separate polygon for that economy; it does not mean that financial access is 0%.
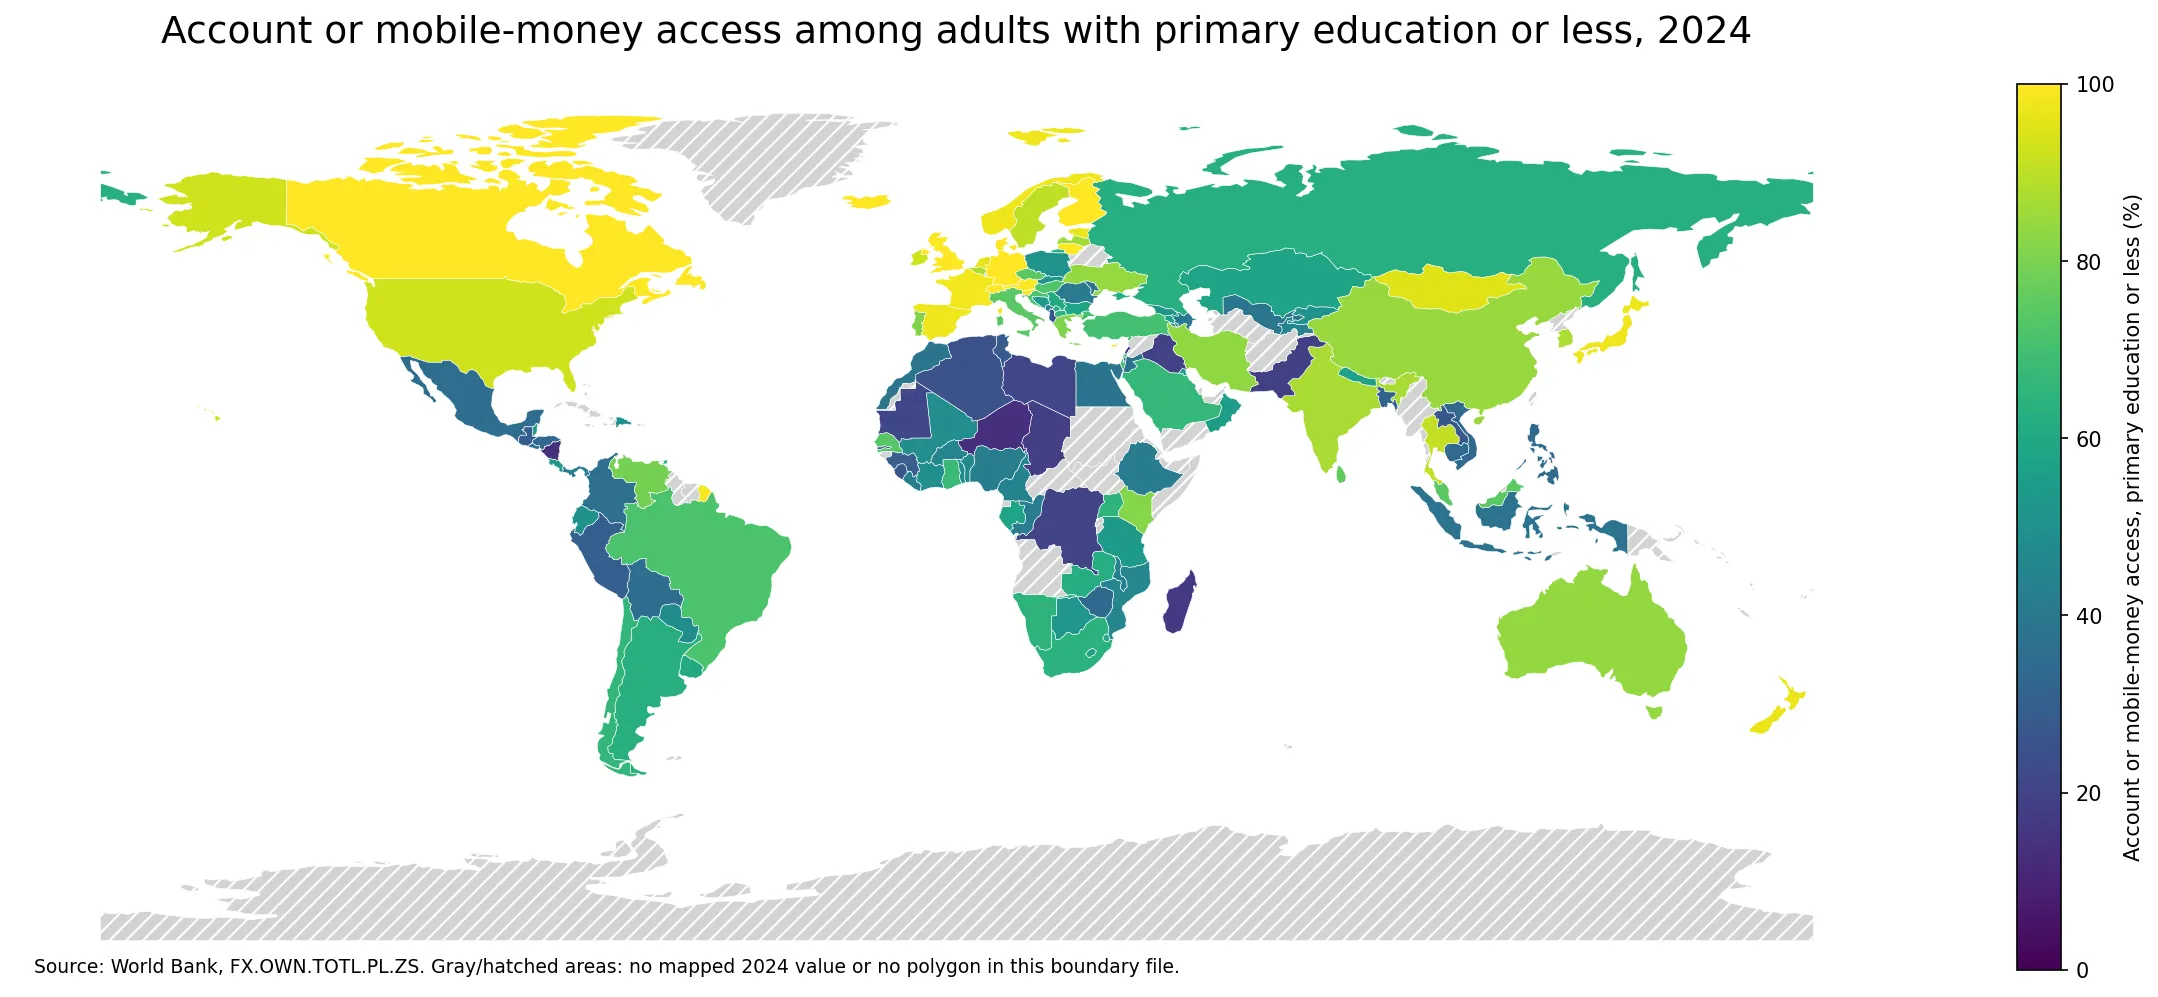
Table of Contents
The middle of the distribution still spans a wide range
The 25th percentile is 39.1% and the 75th percentile is 82.6%, so the middle half of reporting economies covers more than forty percentage points. The 10th percentile is 27.2% and the 90th percentile is 97.4%. There are 23 economies at or above 90%, while 56 are below 50% and 19 fall below 30%. Even after the most extreme observations are set aside, the subgroup’s access to an account or mobile money varies substantially across countries.
The lowest reported value is Nicaragua at 13.3%, while the maximum is Austria at 100.0%. The spread is about 86.7 percentage points. Several economies are recorded at 100%, so fine ranking within the top group adds little. Broad bands such as “near-universal,” “around the middle,” and “below one-half” are usually more informative than ordering countries by tiny decimal differences.
What “primary education or less” changes about the comparison
This indicator is conditional on education level. It asks, among adults age 15 and older whose educational attainment is primary education or less, what share reports owning an account at a financial institution or personally using a mobile-money service during the previous 12 months. It does not tell us what percentage of all adults have primary education or less. It also should not be substituted for the World Bank’s all-adult account-ownership indicator, because the two measures use different denominators.
That distinction affects cross-country interpretation. The low-education subgroup can represent a very different share of the adult population from one country to another. A country with a small subgroup and a 90% access rate is not directly comparable in population counts to a country where the subgroup is much larger. The indicator is best used to compare access within the same subgroup, while questions about the size of the subgroup require separate education-attainment data.
Near-universal values appear in several economies
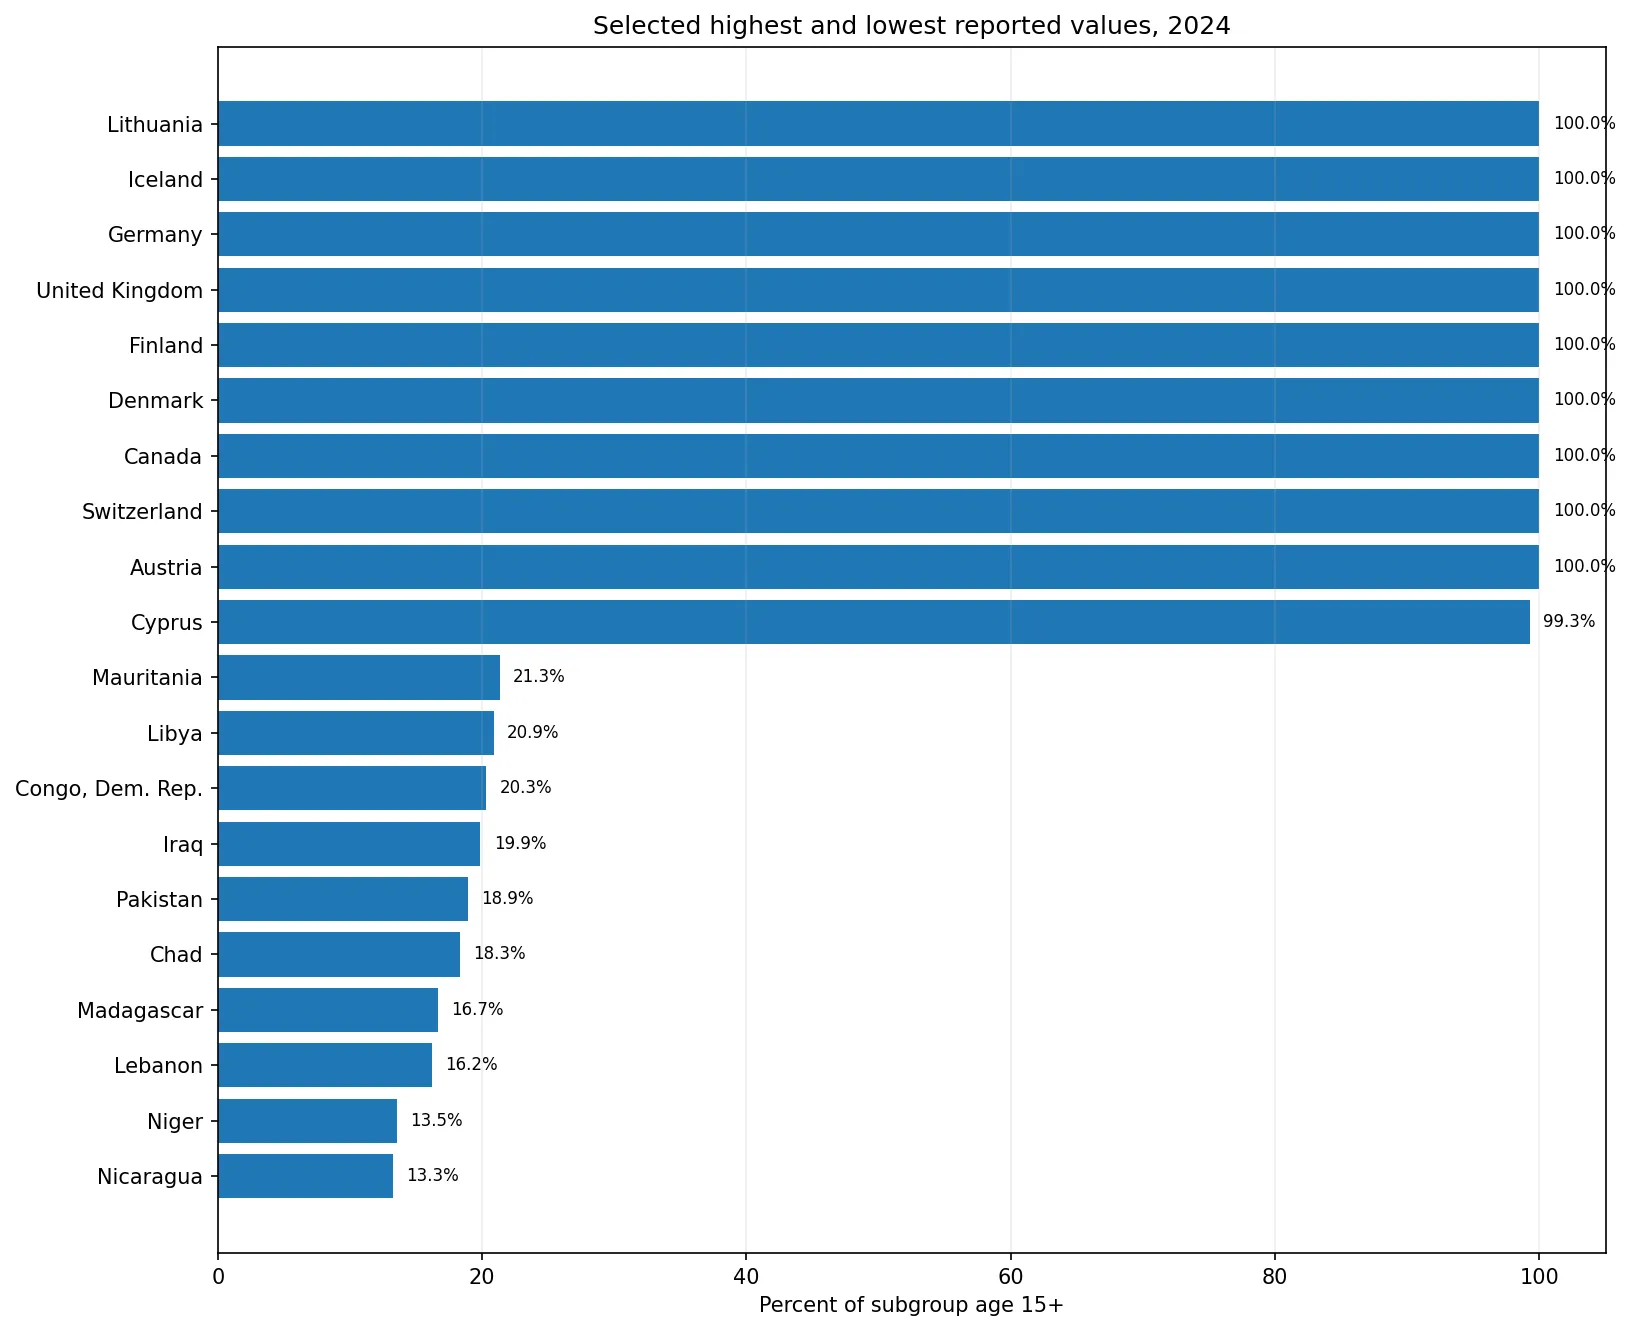
Austria, Canada, Switzerland, Germany, Denmark, Finland, the United Kingdom, Iceland and Lithuania are all reported at 100%. France stands at 98.1%, Japan at 97.6% and Norway at 97.4%. These values indicate that account ownership or mobile-money use is reported by almost the entire measured subgroup in those economies. They do not show how frequently accounts are used, how much money is held in them, whether credit is affordable, or whether users have access to a broad range of financial products.
At the lower end, Nicaragua is 13.3%, Niger 13.5%, Lebanon 16.2%, Madagascar 16.7% and Chad 18.3%. Pakistan is 18.9%. These observations demonstrate a large access gap within the same education subgroup, but they do not identify the cause of that gap. Explaining the difference would require additional evidence about banking infrastructure, mobile networks, income, regulation, remittance systems, urban-rural access and other conditions.
Large countries do not follow a single pattern
The United States is 92.7%, China 84.4%, India 87.1% and Brazil 71.7%. Indonesia is lower at 37.6%, as are Mexico at 35.2% and Nigeria at 42.2%. Kenya is 81.7%, South Africa 63.7% and Bangladesh 31.2%. The range among populous countries is a reminder that geography, national systems and the mix of financial channels can matter as much as broad regional labels.
The Republic of Korea records 87.4% for this subgroup. It is one peer observation within the wider 139-economy distribution rather than a separate benchmark. Because the denominator is restricted to adults with primary education or less, this value should not be mixed with an all-adult rate or with the prevalence of low educational attainment in the population.
Highest and lowest reported observations
The table lists the ten highest and ten lowest numeric observations. Ties at 100% mean that the top group should not be read as a precise ordinal ranking. At the lower end, the useful information is the size of the gap and the concentration of observations under 20% or 30%, rather than a one-place difference in decimal rank.
| Country or economy | Account/mobile-money access in subgroup |
|---|---|
| Austria | 100.0% |
| Canada | 100.0% |
| Switzerland | 100.0% |
| Germany | 100.0% |
| Denmark | 100.0% |
| Finland | 100.0% |
| United Kingdom | 100.0% |
| Iceland | 100.0% |
| Lithuania | 100.0% |
| Cyprus | 99.3% |
| Nicaragua | 13.3% |
| Niger | 13.5% |
| Lebanon | 16.2% |
| Madagascar | 16.7% |
| Chad | 18.3% |
| Pakistan | 18.9% |
| Iraq | 19.9% |
| Congo, Dem. Rep. | 20.3% |
| Libya | 20.9% |
| Mauritania | 21.3% |
What the map can and cannot show
The choropleth makes the geographic contrast visible. Many European economies and several other high-income economies appear in the upper bands, while lower values are found across parts of Africa, the Middle East, South Asia, Southeast Asia and Latin America. That visual pattern is descriptive, not causal. Neighboring countries can share a color for different reasons, and similar national percentages can reflect different combinations of bank accounts and mobile-money services.
Small islands and territories can also be present in the source statistics without appearing as separate shapes in the low-resolution world boundary file. Those observations remain part of the mean, median, percentiles and ranking calculations. A missing polygon is a cartographic limitation; a missing source value is a data limitation. Keeping the two separate avoids turning an unmapped area into a false zero.
Three interpretation traps to avoid
- The measure is not the percentage of a country’s population with primary education or less; it is the access rate inside that education subgroup.
- A high percentage does not demonstrate active account use, savings, borrowing, insurance access, affordability or financial resilience.
- The cross-country pattern does not prove that education level causes financial access outcomes. Causal claims require other data and a different analytical design.
Why this subgroup is useful
An education-specific measure can reveal whether basic financial channels reach people who may be missed by an all-adult national average. A country can have high overall account ownership while still leaving some demographic groups behind. Conversely, a high rate within the primary-education-or-less subgroup suggests that formal accounts or mobile-money channels reach broadly across educational attainment. The subgroup view is therefore useful for inclusion analysis, provided it is not confused with the total adult population.
The measure also recognizes that access does not have to come only through a conventional bank branch. Personal mobile-money use during the previous 12 months qualifies under the indicator definition. That matters in places where digital or agent-based payment networks may extend beyond the reach of traditional branch infrastructure. The single percentage, however, does not separate how much of the result comes from bank accounts and how much from mobile money.
Data and method
The analysis uses World Bank indicator FX.OWN.TOTL.PL.ZS for 2024. The unit is percent of the population age 15 and older within the primary-education-or-less subgroup who report an account at a financial institution or personal mobile-money use during the previous 12 months. Of 217 source rows, 139 numeric observations with data status OK are used in the calculations; the other 78 rows remain missing. The mean, median, percentiles and highest/lowest values are calculated directly from those 139 observations.
The map joins ISO3 codes to a low-resolution Natural Earth boundary file. Known blank ISO entries for France and Norway are repaired by country name before the join. Of the 139 numeric observations, 133 have a polygon in this boundary set and can be shaded. Observations for small islands or territories without a separate polygon still remain in the statistical summaries.
Frequently Asked Questions
Does this indicator cover all adults?
No. It covers people age 15 and older within the primary-education-or-less subgroup, not the entire adult population.
Does the measure include mobile money?
Yes. It includes an account at a financial institution or personal use of a mobile-money service during the previous 12 months.
How many economies have a numeric 2024 observation?
There are 139 numeric observations. The remaining 78 source rows are missing and are not treated as zero.
Can the country differences be interpreted as an effect of education?
No. The indicator describes access within an education subgroup. It does not establish that education level causes the observed country differences.
Related Articles
Green Map creates custom-edited map images using open geographic data sources such as geoBoundaries, Natural Earth, OpenStreetMap, and government open data.
These maps are edited visual materials, not raw data files, and are provided for education, documents, presentations, and graphic reference.