Chickasaw County sits in northeastern Iowa, with New Hampton near the center of a landscape of small communities, branching streams, and rolling uplands. The maps on this page are designed to answer different practical questions without forcing every detail onto one crowded image. You can locate the county and its roads, compare the positions of several major communities, trace named rivers and creeks, and see where the land rises and falls. The same map set is also available as high-resolution JPG files in the download box below.
The strongest pattern becomes clear when the maps are compared rather than viewed in isolation. New Hampton anchors the road network in the middle of the county. Nashua and Fredericksburg sit much farther south, while Lawler lies east of New Hampton, Ionia to the west, and Alta Vista to the north. The western side includes the Little Cedar River and Wapsipinicon River, while central and eastern drainage is strongly associated with the Little Wapsipinicon and East Fork Wapsipinicon systems. The elevation surface adds another layer, showing higher ground across much of the north and north-central area and lower terrain toward the southwest.
Table of Contents
New Hampton anchors the county road pattern
On the county map, New Hampton is the most obvious central reference point. U.S. 63 runs north to south through the city, giving the map a clear vertical spine. Iowa 24 extends eastward toward Lawler, while the southern part of the county shows Iowa 346 approaching from the Nashua side and U.S. 18 continuing through the Fredericksburg area. Looking at these routes together makes it easier to understand why New Hampton works as the best starting point for orientation: it sits between the northern communities, the western edge near Nashua, and the east-southeast corridor toward Lawler and Fredericksburg.
The map also places smaller communities and neighboring counties into context. Nashua appears at the western edge near the southwest corner of Chickasaw County. Fredericksburg lies in the southeast, Lawler east of New Hampton, Ionia west of the county center, and Alta Vista farther north. Names outside the boundary include Bremer, Floyd, Mitchell, Howard, Butler, Fayette, and Winneshiek counties, so the map can be used to see where Chickasaw County fits within northeastern Iowa rather than treating the county as an isolated rectangle.
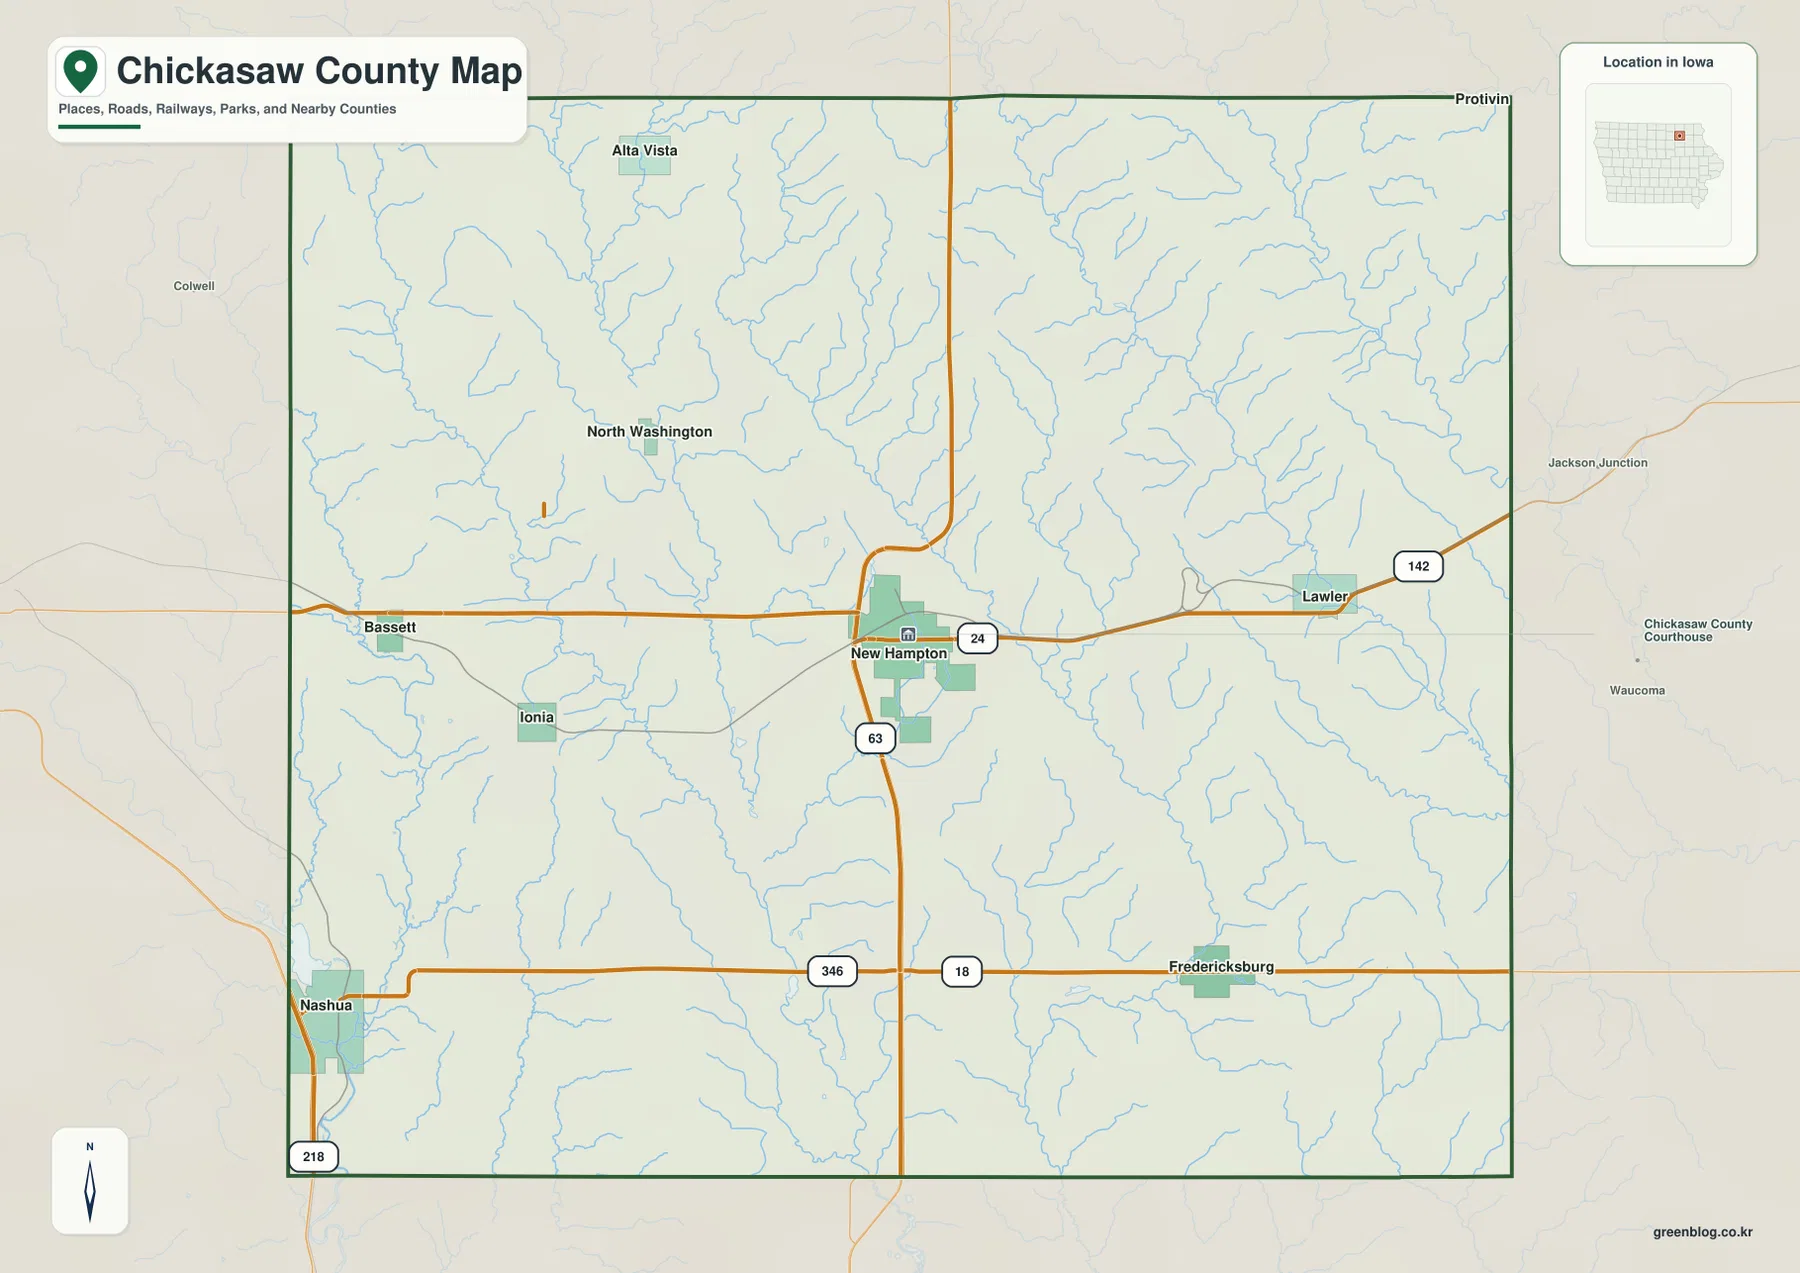
This is an orientation map, not a turn-by-turn navigation product. It is best used to understand the broad direction of travel and the relationship between communities before checking current road conditions or a dedicated navigation service. That distinction matters in a rural county where a road that looks like a simple line on a regional map may have local conditions, seasonal work, or access details that change over time.
A ranked city view shows how communities are spread across the county
The city-distribution map highlights six places from the supplied ranking: New Hampton, Nashua, Fredericksburg, Lawler, Ionia, and Alta Vista. New Hampton is near the middle, while the other five create a useful geographic spread around it. Nashua is far to the southwest, Fredericksburg to the southeast, Lawler to the east, Ionia to the west, and Alta Vista to the north. Because the markers are separated by wide rural areas, the map quickly communicates that Chickasaw County does not have one continuous urbanized strip.
The official Chickasaw County website lists nine communities in the county, so this ranked-city map should not be read as a complete municipal inventory. It is a selected view of the principal places represented in the supplied map. That makes it useful for comparing location and relative prominence without implying that places omitted from the city index do not exist. Visitors who need the county’s full community list can follow the official county reference link in the sources section.
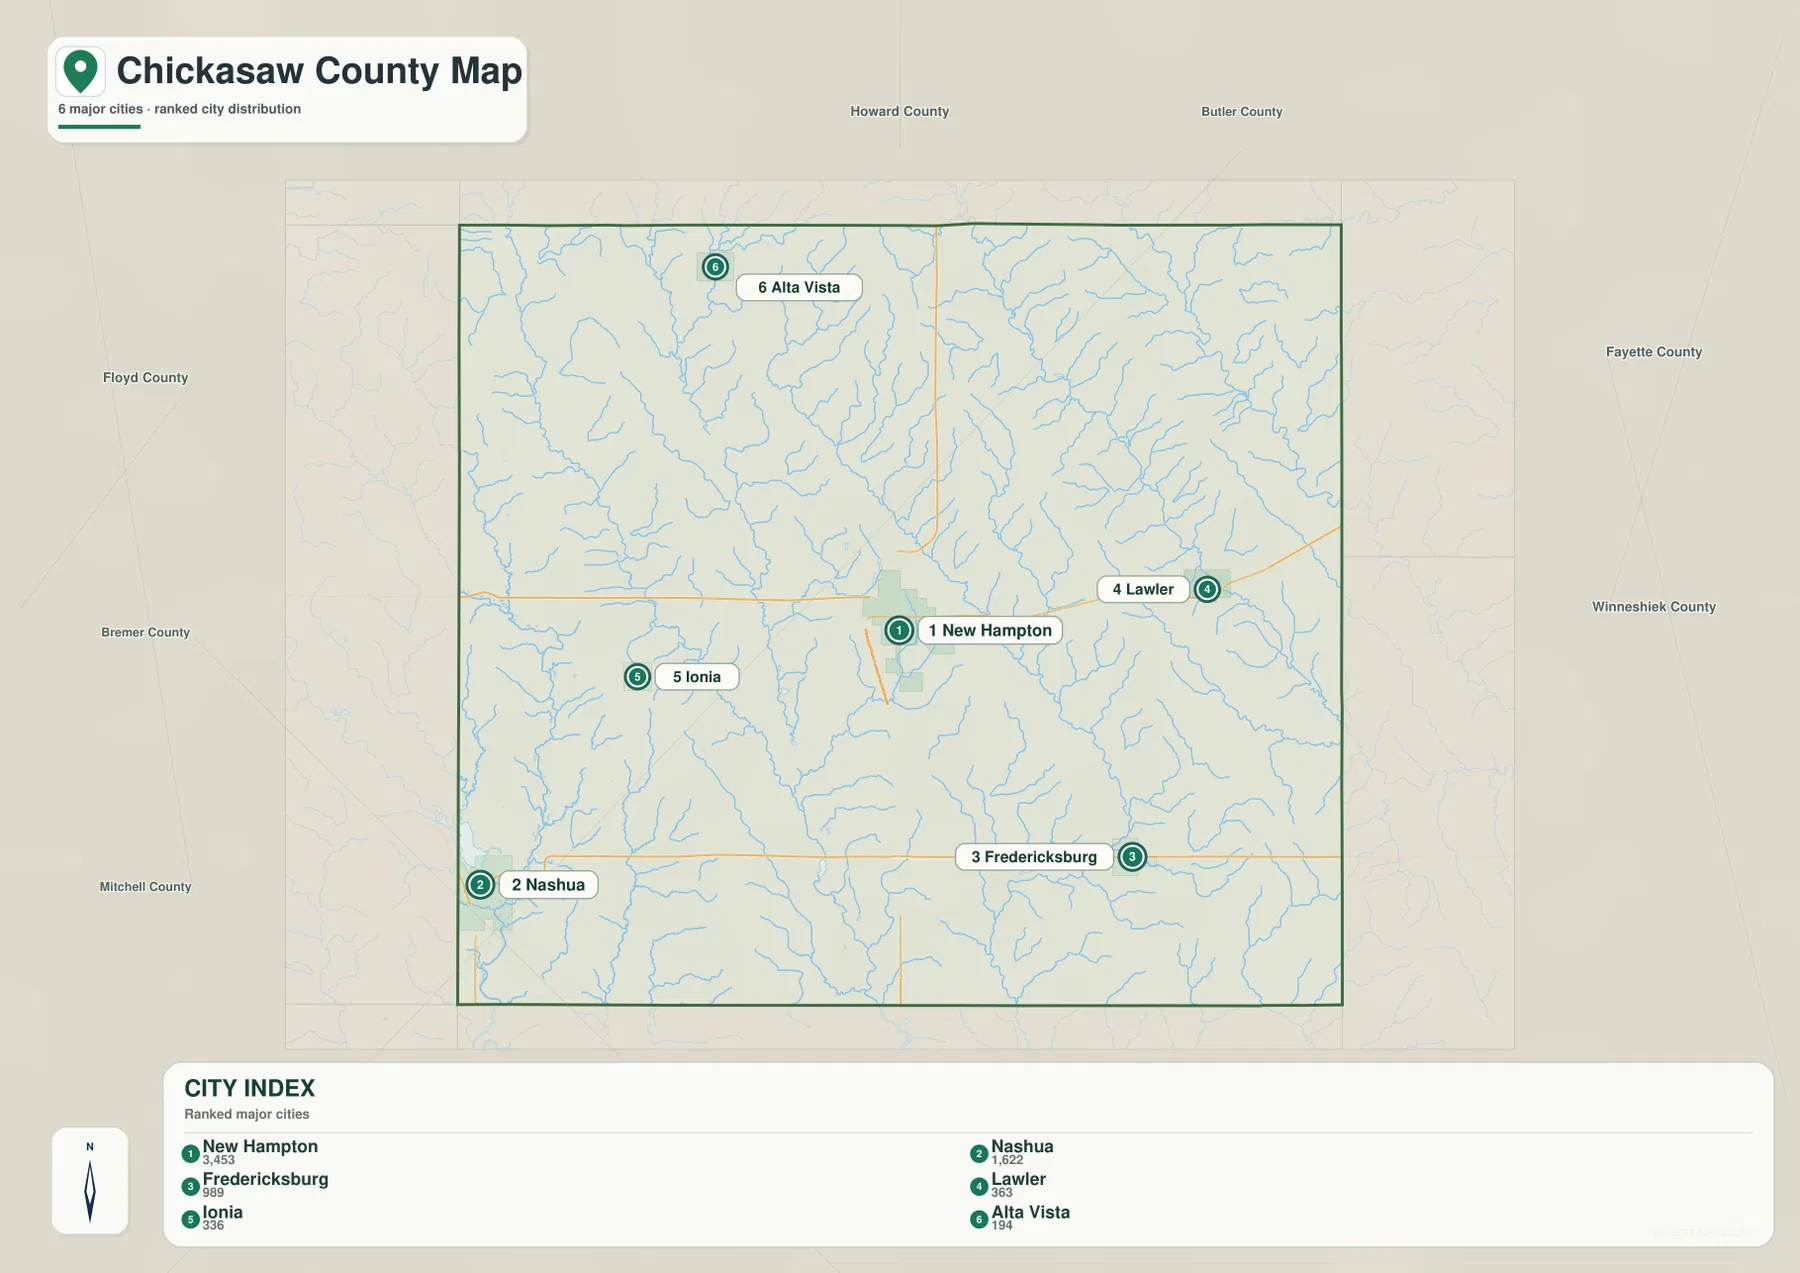
When the city map is compared with the road map, the settlement pattern becomes easier to interpret. New Hampton and Lawler line up with the central-to-eastern road corridor. Nashua and Fredericksburg occupy opposite ends of the southern part of the county, while Alta Vista stands apart in the north. This is especially useful for readers who recognize a town name but do not yet know whether it lies near the county center, close to a boundary, or along the same corridor as another community.
The Little Cedar and Wapsipinicon systems divide the water map
The terrain-and-water map is dense with named streams. On the western side, the Little Cedar River and Wapsipinicon River run through long north-south valleys. Between them is the Little Wapsipinicon River. Farther east, the East Fork Wapsipinicon River forms one of the most prominent channels on the map, with many short tributaries feeding into it. In the northeast, Crane Creek and the Little Turkey River stand out, while labels such as Beaver Creek, Otter Creek, Spring Branch, Spring Creek, Plum Creek, and Simpson Creek identify smaller parts of the drainage network.
The useful feature here is not simply the number of blue lines. The map shows that different parts of the county connect to different river systems. Western drainage is closely associated with the Little Cedar and Wapsipinicon channels, while central and eastern valleys feed the Wapsipinicon branches and other northeastern streams. Numerous unnamed tributaries fill the spaces between the labeled channels, making the county appear much more dissected by small valleys than a simple road map suggests.
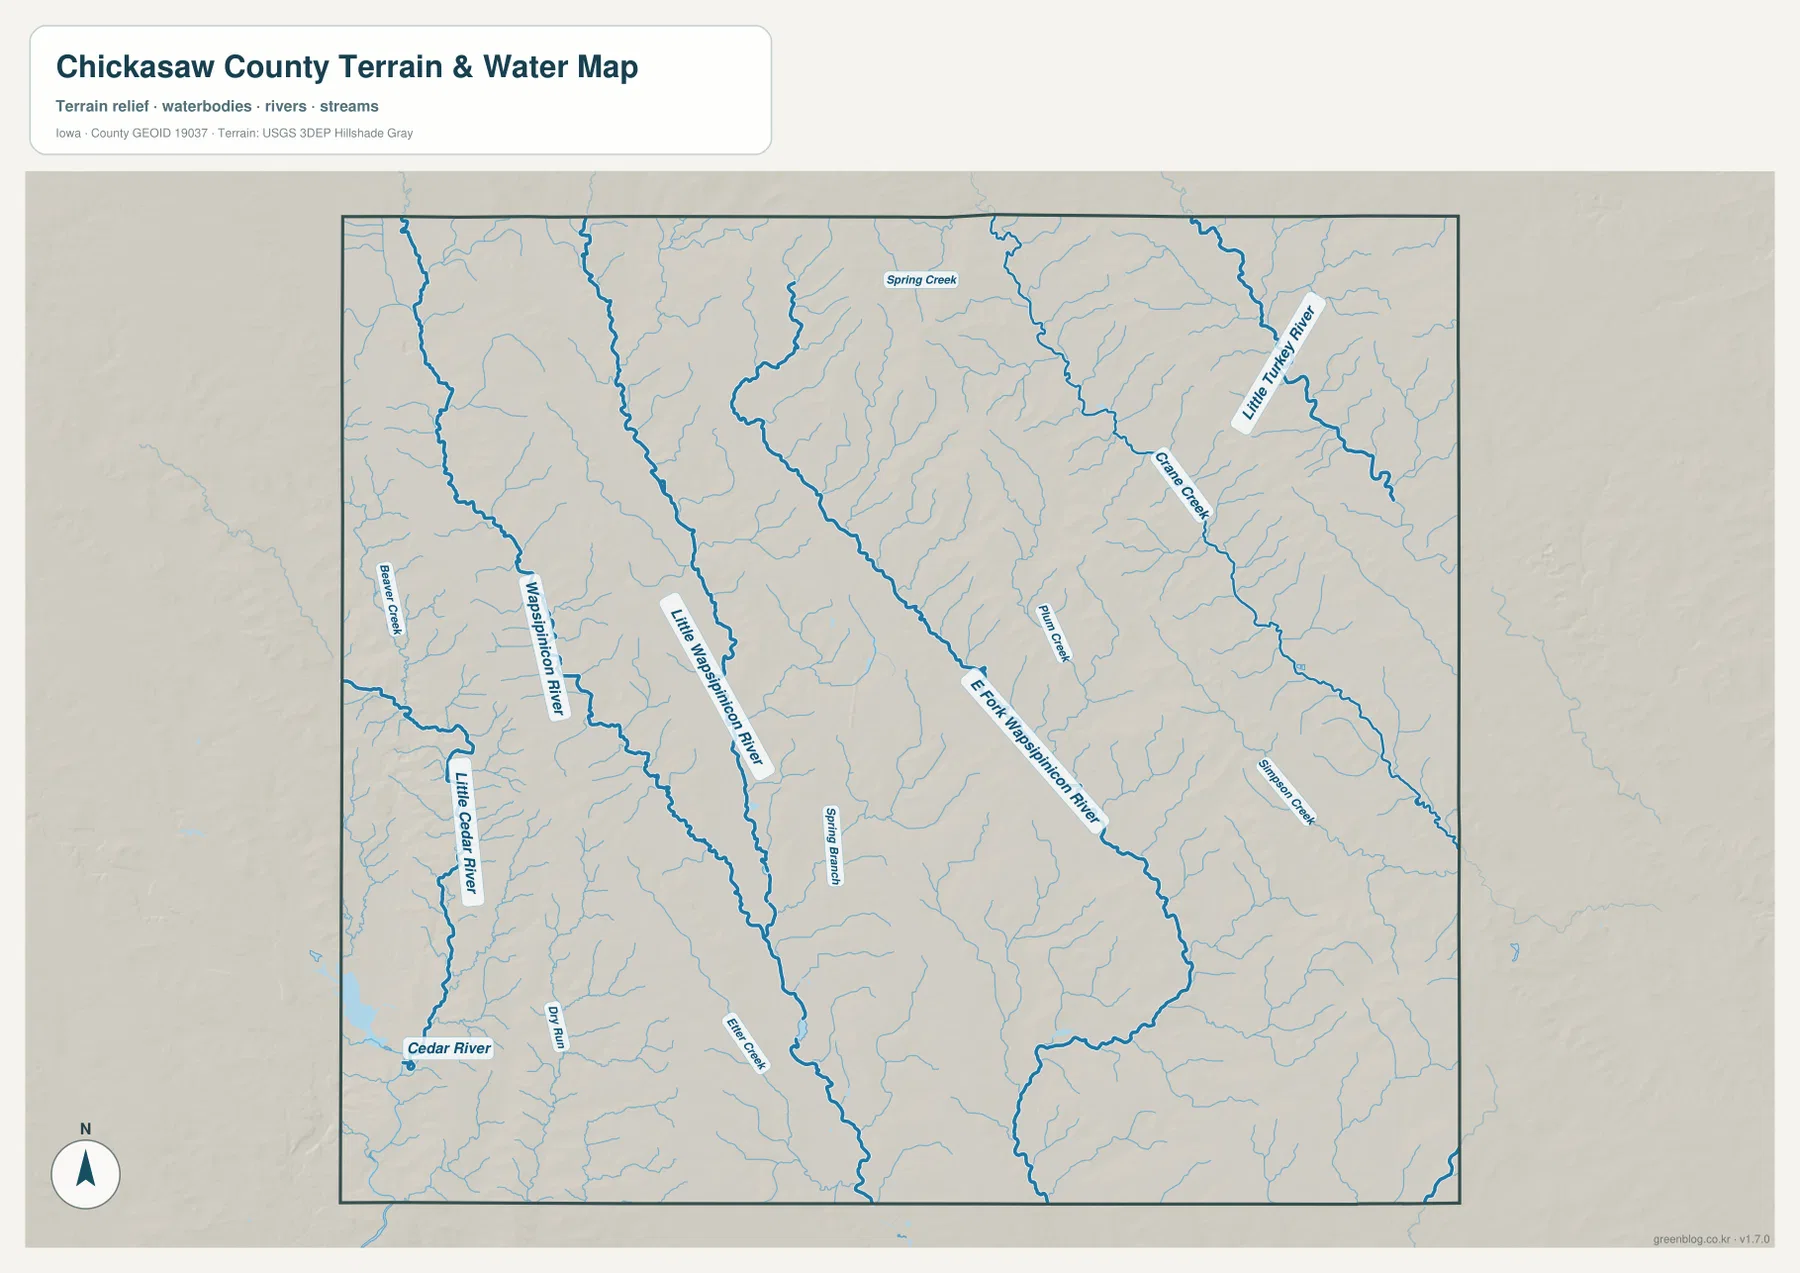
Use this water map as a geographic reference, not as a flood-zone, property-boundary, legal-waterline, or navigation map. It can help you identify the general position and direction of a stream before a field visit, but access conditions, flood status, water levels, and regulated boundaries require current information from the responsible agencies. The map is strongest when paired with the elevation image because the channels often occupy the lower corridors visible on the relief surface.
Higher northern ground gives way to lower southwest valleys
The elevation map shows an actual mapped range of about 285 to 401 meters, with a mean elevation of 343 meters printed on the legend. Browns and darker tan shades represent higher terrain, while greens indicate lower ground. A broad area of higher relief appears across the north and north-central portion of the county. In contrast, the southwest is dominated by lower green terrain. The southeast includes another set of ridges and higher strips, so the county does not slope uniformly in only one direction.
Shaded relief makes the valley pattern especially visible. In the north-central area, narrow valleys cut into the higher surface and create a branching texture. The southwest has broader low corridors, while the central and eastern portions show long, curving valleys separated by elongated uplands. When these shapes are compared with the water map, the reason for many of the stream paths becomes easier to see: the rivers and creeks occupy lower channels between the higher ridges.
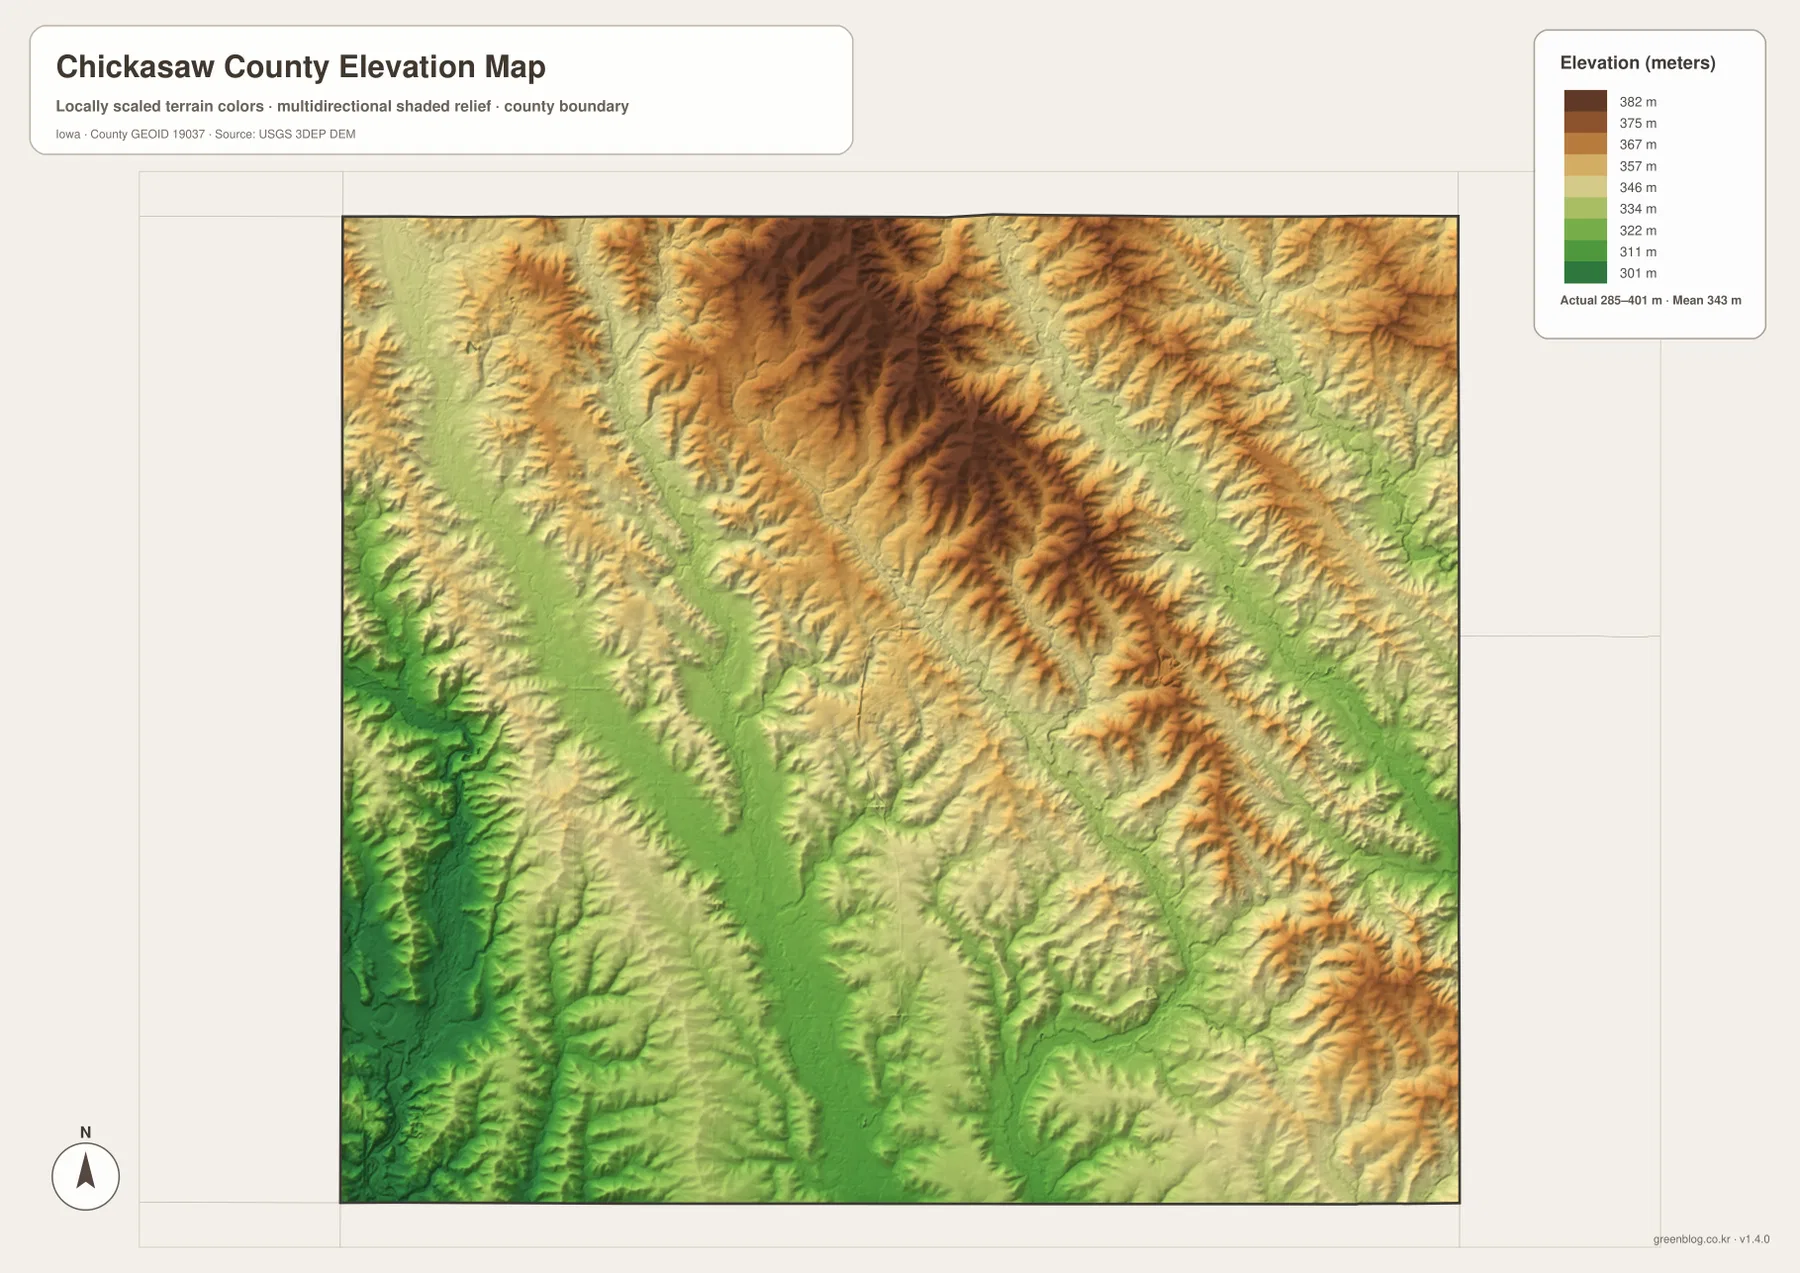
This is a generalized elevation surface intended for county-scale comparison. It should not be used as survey-grade or engineering-grade elevation at a specific parcel, road crossing, building site, or bridge. Its value is visual: it helps readers see which parts of Chickasaw County are relatively high or low and how those differences relate to the valleys visible on the water map.
What becomes visible when roads, towns, water, and relief are compared
The four views complement one another. New Hampton is central on the road map, but the water and relief maps show that the county center is not simply a flat, featureless crossroads. Small tributaries pass through the surrounding terrain, and longer valleys extend away from the city. To the west, Ionia and Nashua sit closer to the Little Cedar and Wapsipinicon side of the drainage network. East of New Hampton, the East Fork Wapsipinicon and its tributaries become increasingly important, while Lawler lies in a landscape threaded by smaller streams.
Fredericksburg is useful for another comparison. It appears on the southern road corridor, away from New Hampton, yet the elevation map shows that southern Chickasaw County is not all at the same height. The southwest is notably lower, while ridges become more pronounced toward the east and southeast. Alta Vista provides the opposite perspective: the city map places it in the north, and the elevation surface around the northern part of the county is generally higher and more strongly dissected than the southwest.
Choosing the map that matches the question
Start with the county map when your main question is where a community lies, which direction a major road runs, or how Chickasaw County relates to neighboring counties. It keeps transportation and settlement information together without the heavier terrain coloring of the elevation map. If you know a town name but not its relative position, the ranked-city map is a faster visual index because its markers immediately separate north, south, east, and west locations.
Choose the terrain-and-water map when rivers, creeks, or drainage are the main subject. It is the clearest file for following the Little Cedar River, Wapsipinicon River, Little Wapsipinicon River, and East Fork Wapsipinicon River along with smaller named tributaries. For landform questions, the elevation map is the better starting point. The most informative workflow is often to view the elevation and water maps side by side so that lower valleys can be matched with the stream network.
High-resolution files for printing and offline reference
The WebP images embedded in the article are optimized for on-page viewing. The downloadable archive contains the original high-resolution JPG versions of the same four map subjects, making them more suitable for printing, presentations, offline notes, or a larger display. Each subject is stored as a separate file, so you can use the road-and-place map without the elevation colors or select the water map without carrying unrelated information onto the page.
For a classroom or report, pick the simplest map that answers the question being discussed. The county map works well for orientation, the ranked-city map for settlement distribution, the water map for named rivers and tributaries, and the elevation map for relief. Keeping those jobs separate makes labels easier to read and reduces the chance that a viewer mistakes a generalized reference layer for a legal or engineering product.
Frequently Asked Questions
Which map is best for seeing the main roads around New Hampton?
Use the county road-and-community map. It places New Hampton near the center and shows U.S. 63, Iowa 24, the southern Iowa 346 corridor, and U.S. 18 in relation to Nashua, Fredericksburg, Lawler, and other nearby places. For actual driving, pair it with a current navigation or road-condition source.
Which file makes it easiest to compare the Wapsipinicon branches with the Little Cedar River?
The terrain-and-water map is the clearest choice. It labels the Little Cedar River, Wapsipinicon River, Little Wapsipinicon River, and East Fork Wapsipinicon River, plus several smaller creeks and branches. The elevation map can then be used to see how those channels fit into the lower terrain.
Can the 285–401 meter elevation range be used for surveying or construction?
No. The range is useful for county-scale geographic comparison, but the map is a generalized elevation surface rather than a survey or engineering product. Use an authoritative project-specific elevation source when precise site measurements are required.
Map File Information
Download the original high-resolution JPG versions of the county map, ranked-city map, terrain-and-water map, and elevation map shown on this page.
- Included Files: 4 high-resolution JPG maps
Related Maps
Sources and references
The following official sources provide county context and authoritative background for boundaries, waterways, and elevation data.
- Chickasaw County, Iowa official website
- Chickasaw County Communities and Cities
- U.S. Census Bureau TIGER/Line Shapefiles
- USGS National Hydrography
- USGS 3D Elevation Program
These maps are intended for geographic reference and general understanding. They do not replace legal boundary records, flood-regulation products, land surveys, or engineering-grade elevation data. When a decision depends on an official or current measurement, use the responsible agency’s source material.
Green Map creates custom-edited map images using open geographic data sources such as geoBoundaries, Natural Earth, OpenStreetMap, and government open data.
These maps are edited visual materials, not raw data files, and are provided for education, documents, presentations, and graphic reference.