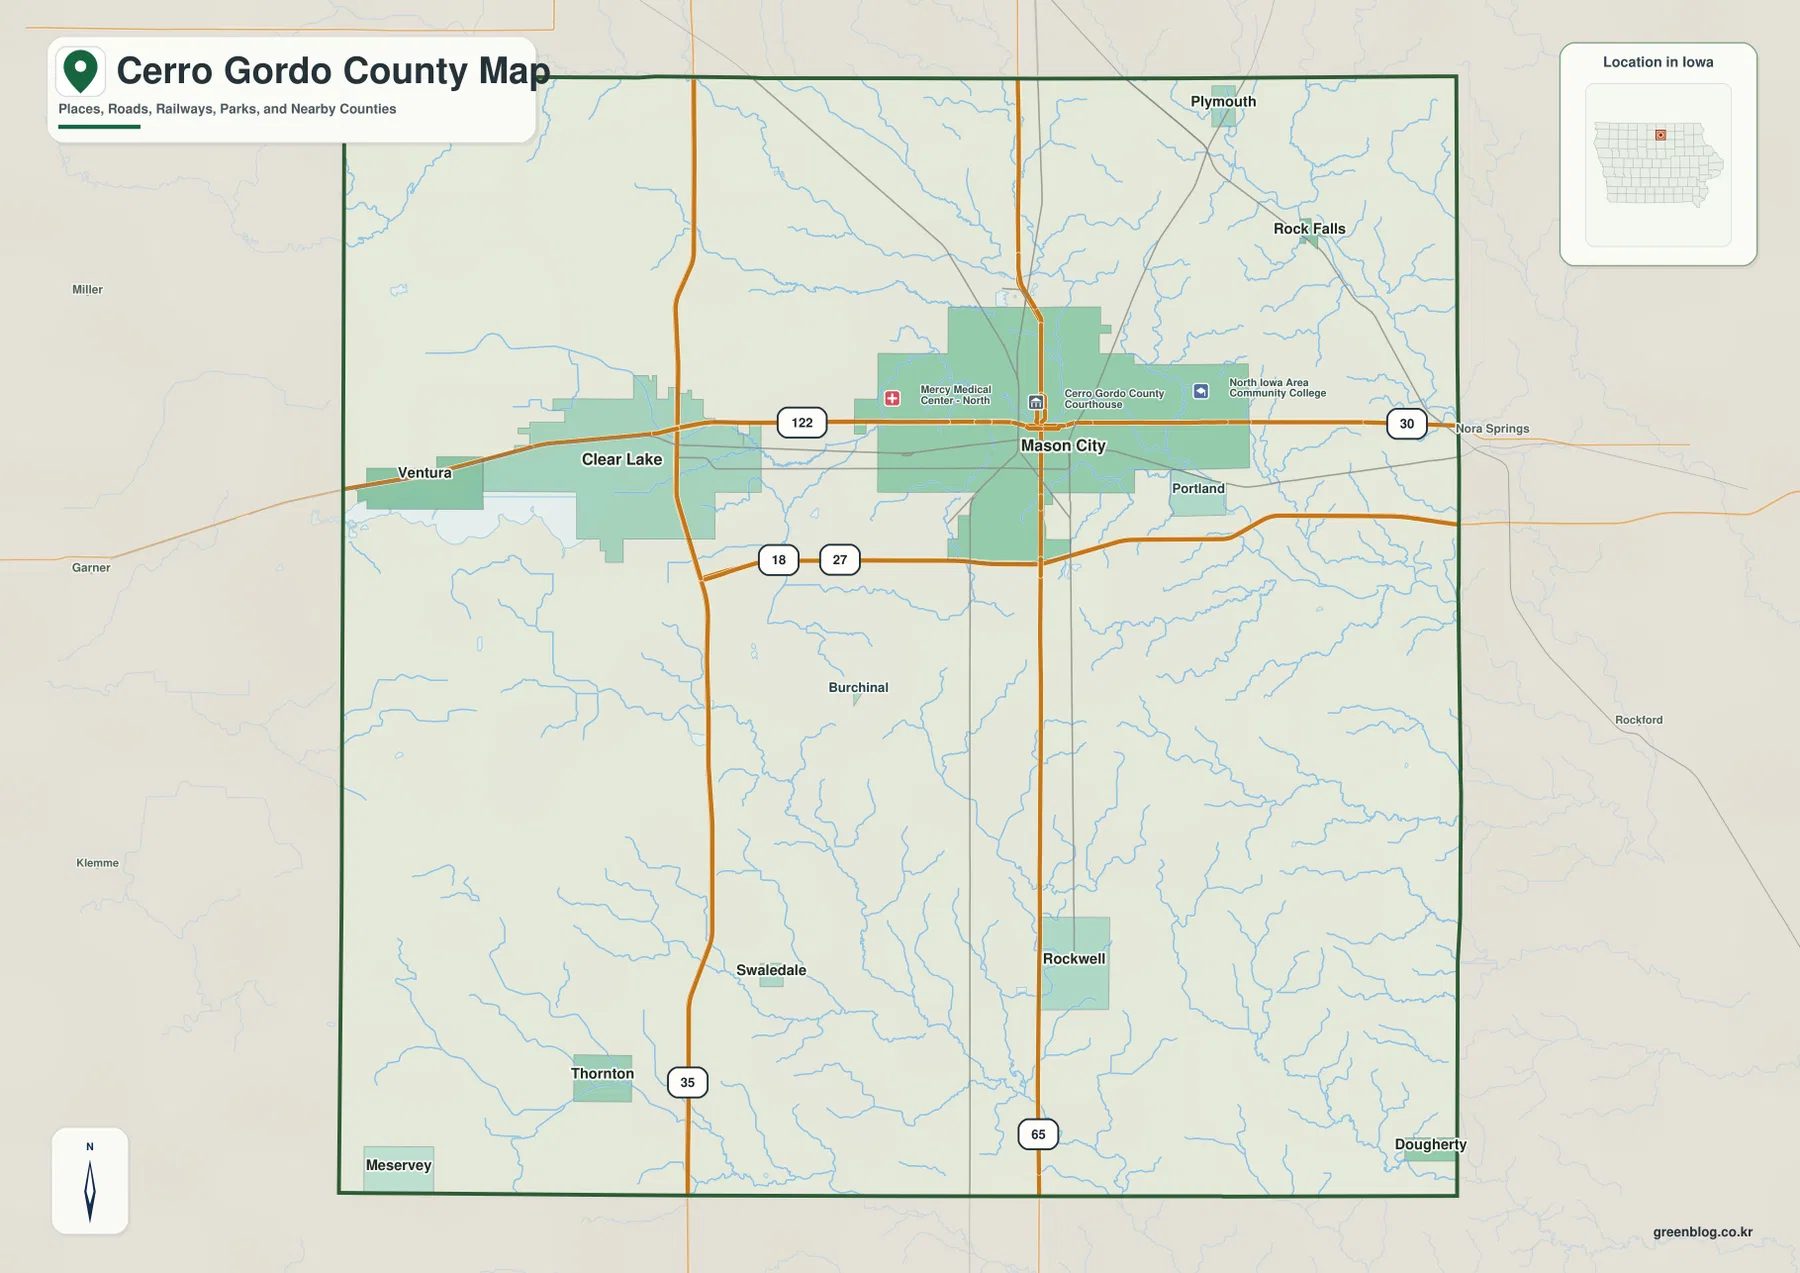
Cerro Gordo County in north-central Iowa is easiest to understand by starting with Mason City and Clear Lake. The two largest places highlighted on the supplied city map sit close together in the northern part of the county, while smaller communities such as Rockwell, Thornton, Ventura, and Plymouth spread toward the south and county edges. The general map gives a road framework with I-35, U.S. 65, U.S. 18/Iowa 27, and Iowa 122. The terrain-and-water map then separates Clear Lake from the Winnebago River, Shell Rock River, Willow Creek, Beaverdam Creek, and other drainage lines. High-resolution 3638 × 2572 JPG versions of all supplied maps are available in the ZIP download on this page.
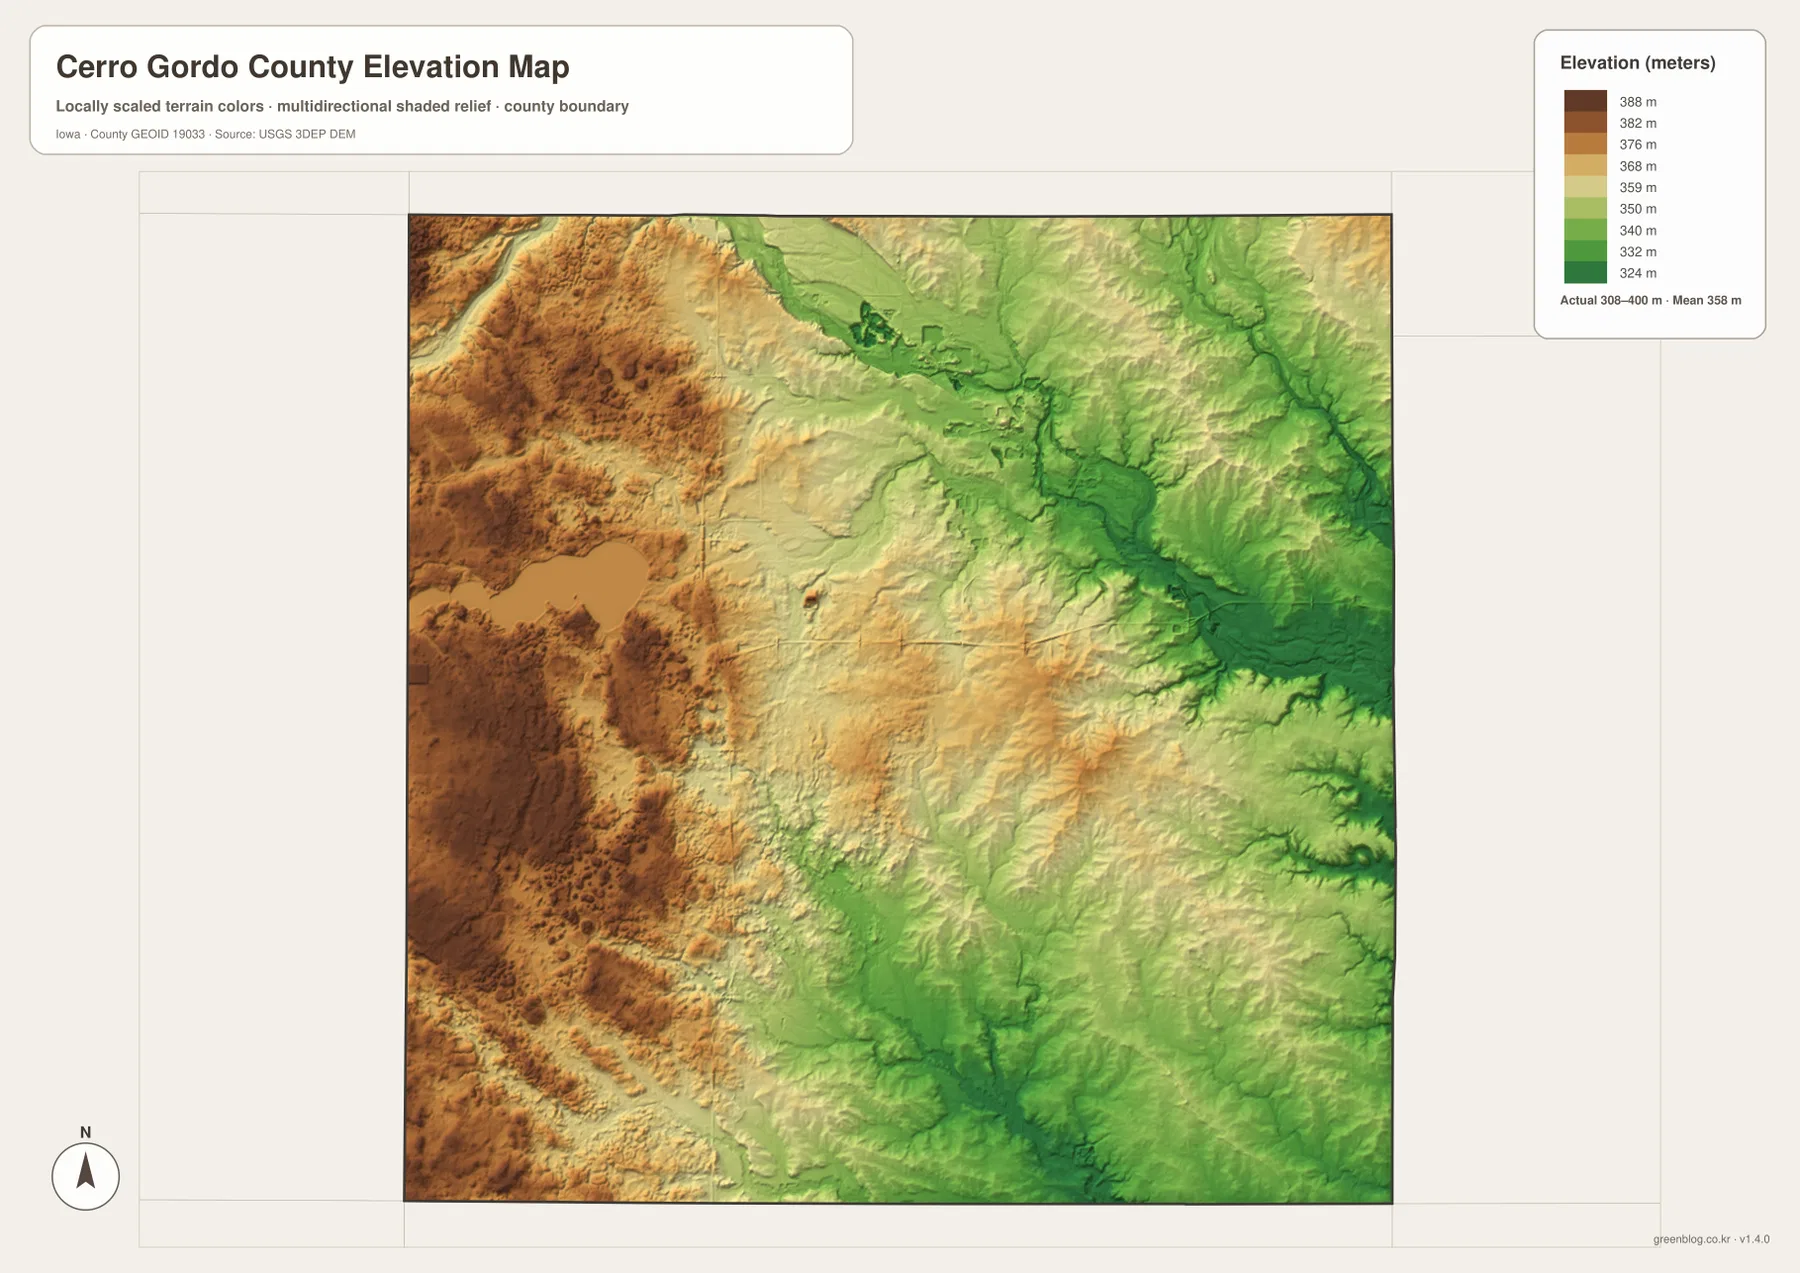
The county is not a uniform flat surface. Clear Lake occupies a broad water body on the western side, while the northeastern and eastern portions contain lower river valleys cut by the Winnebago and Shell Rock systems. The elevation image shows higher ground concentrated more strongly toward the west and lower green corridors along eastern and southern waterways. This contrast makes Cerro Gordo County especially useful for comparing a lake-centered landscape with river-cut lowlands inside one county. The sections below connect those physical features with the roads and communities shown on the other maps.
Table of Contents
Use Mason City and Clear Lake to organize the northern road network
Mason City is the clearest starting point on the general county map. U.S. 65 runs north-south through the city and continues toward Rockwell in the southern half of the county. South of Mason City, U.S. 18 and Iowa 27 are shown together on an east-west route, while Iowa 122 connects the Clear Lake side with Mason City. Farther west, I-35 forms another north-south reference line near Clear Lake and continues toward Thornton. Finding these routes first makes it much easier to place the county’s towns before looking at the smaller roads and streams.
Clear Lake sits in the northwest with Ventura just to its west, while Mason City occupies the north-central part of the county. Plymouth and Rock Falls appear farther north and northeast, and Nora Springs is labeled just beyond the eastern county edge. To the south, Rockwell is close to U.S. 65, Thornton lies near the I-35 side, and Swaledale appears between the main north-south corridors. Meservey is labeled near the southwest edge. The result is a strong northern concentration of population and services with smaller communities distributed across a much broader southern area.
The neighboring-county labels on the city map help with orientation as well. Worth County is north, Floyd and Mitchell counties are east, Butler County is south, and Hancock, Franklin, and Wright counties are shown to the west and southwest. Those labels are useful when looking at edge communities such as Clear Lake, Ventura, or Plymouth because they make the county boundary easier to understand. The map is designed for geographic orientation rather than live navigation, so road construction, closures, and current travel conditions should be checked with up-to-date transportation sources.
The highlighted city pattern is strongly weighted toward the north
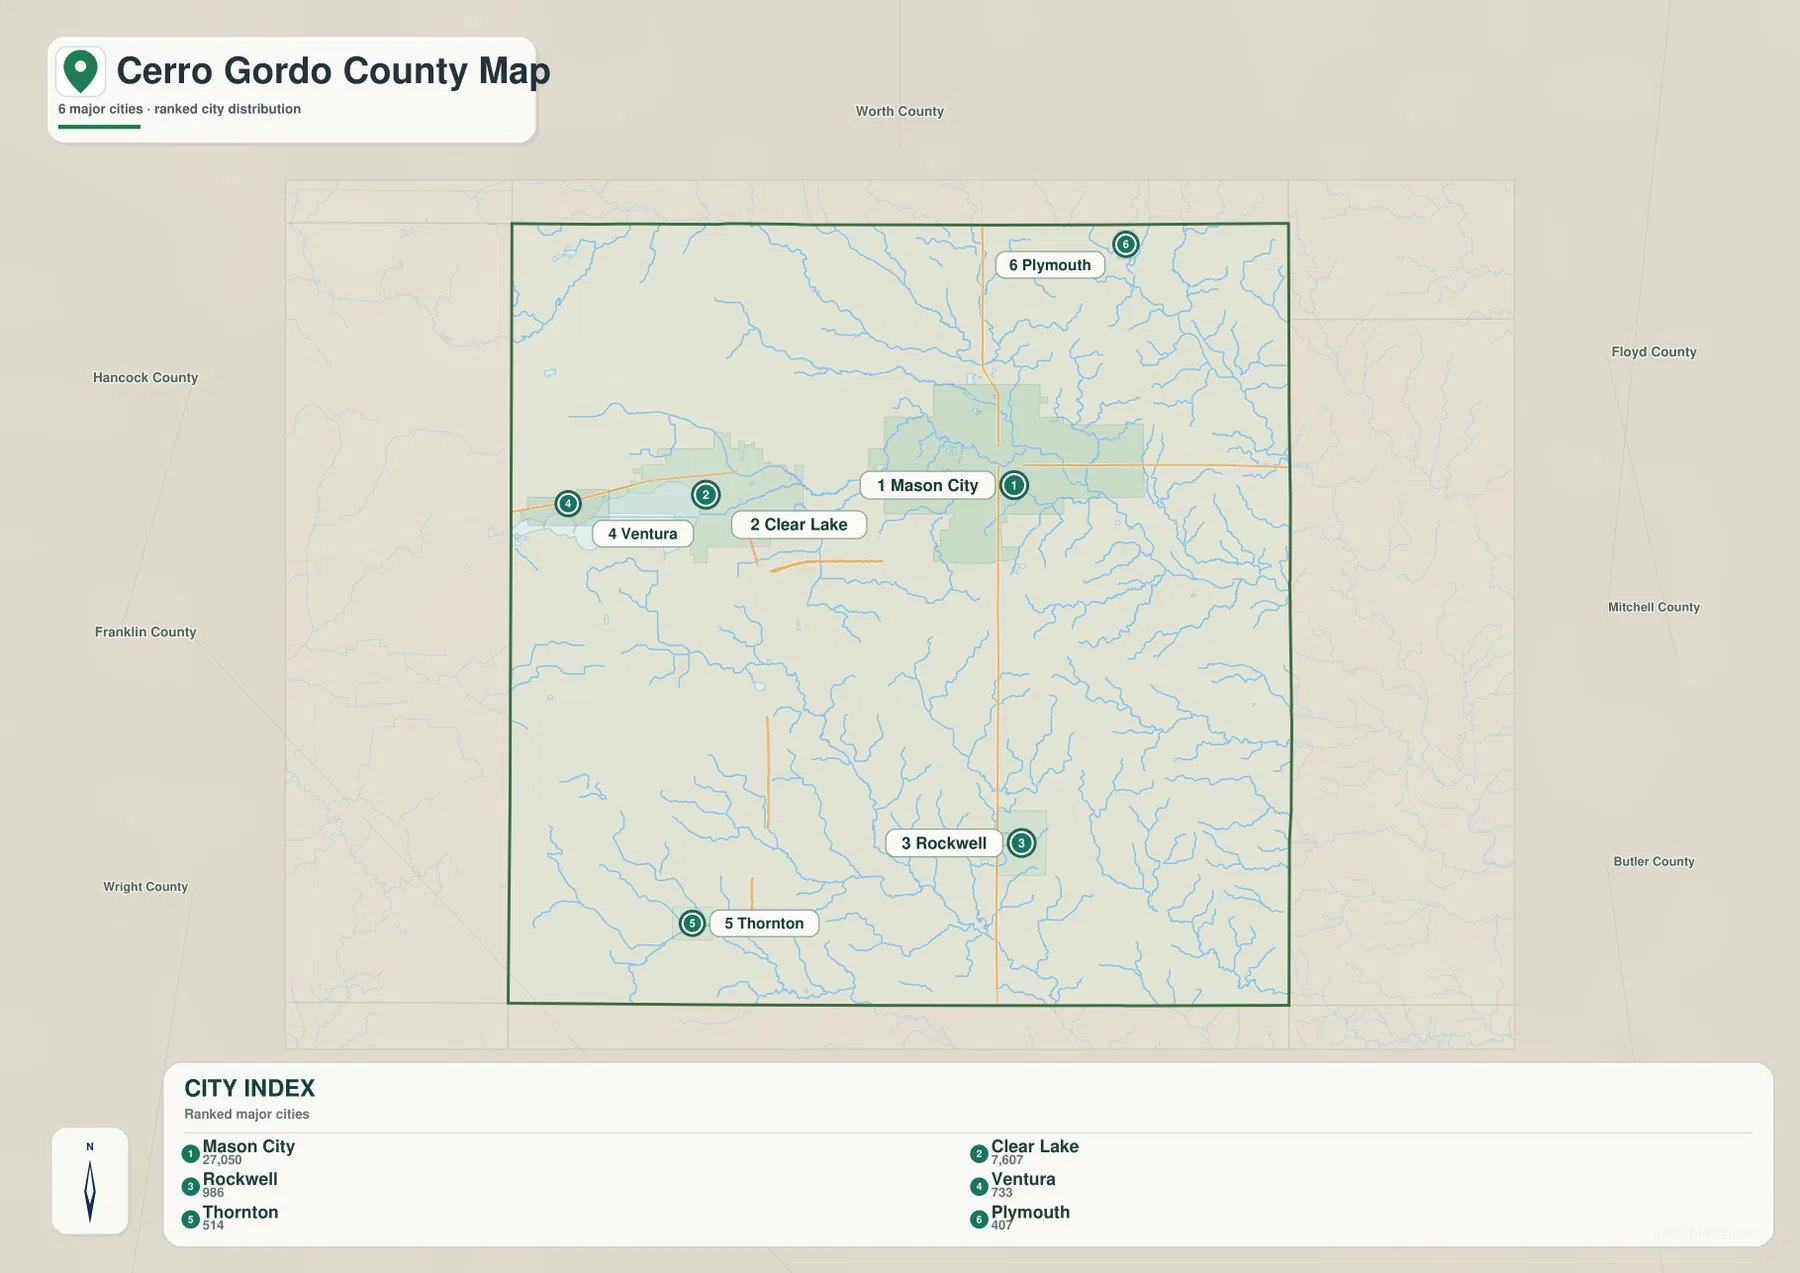
The supplied city-distribution map ranks six highlighted places. Its displayed comparison values are Mason City 27,050, Clear Lake 7,607, Rockwell 986, Ventura 733, Thornton 514, and Plymouth 401. These are values printed on the supplied map and should not be treated as a claim about the latest official population estimates. Their main value here is comparative: they show how dominant Mason City and Clear Lake are within this simplified city set and where the smaller communities sit relative to them.
Mason City and Clear Lake are close to one another in the northern tier, but the remaining highlighted places spread in different directions. Rockwell is south of Mason City near U.S. 65, Thornton is farther southwest, Plymouth is near the northern boundary, and Ventura sits on the west side of Clear Lake. This distribution makes the map useful for seeing why a north-south route such as U.S. 65 matters differently from I-35: each corridor connects a different set of places and passes through a different part of the county.
The Cerro Gordo County government website notes that the county was established in 1851 and is home to 10 communities. That means the six places highlighted on the ranked city map are intentionally a simplified selection rather than a complete list of every community. The general map includes additional place names and is better for broader county orientation, while the city map removes some detail so the major settlement pattern can be read quickly. Using both avoids confusing a ranking graphic with a complete municipal inventory.
Clear Lake and the Winnebago River create two very different northern water settings
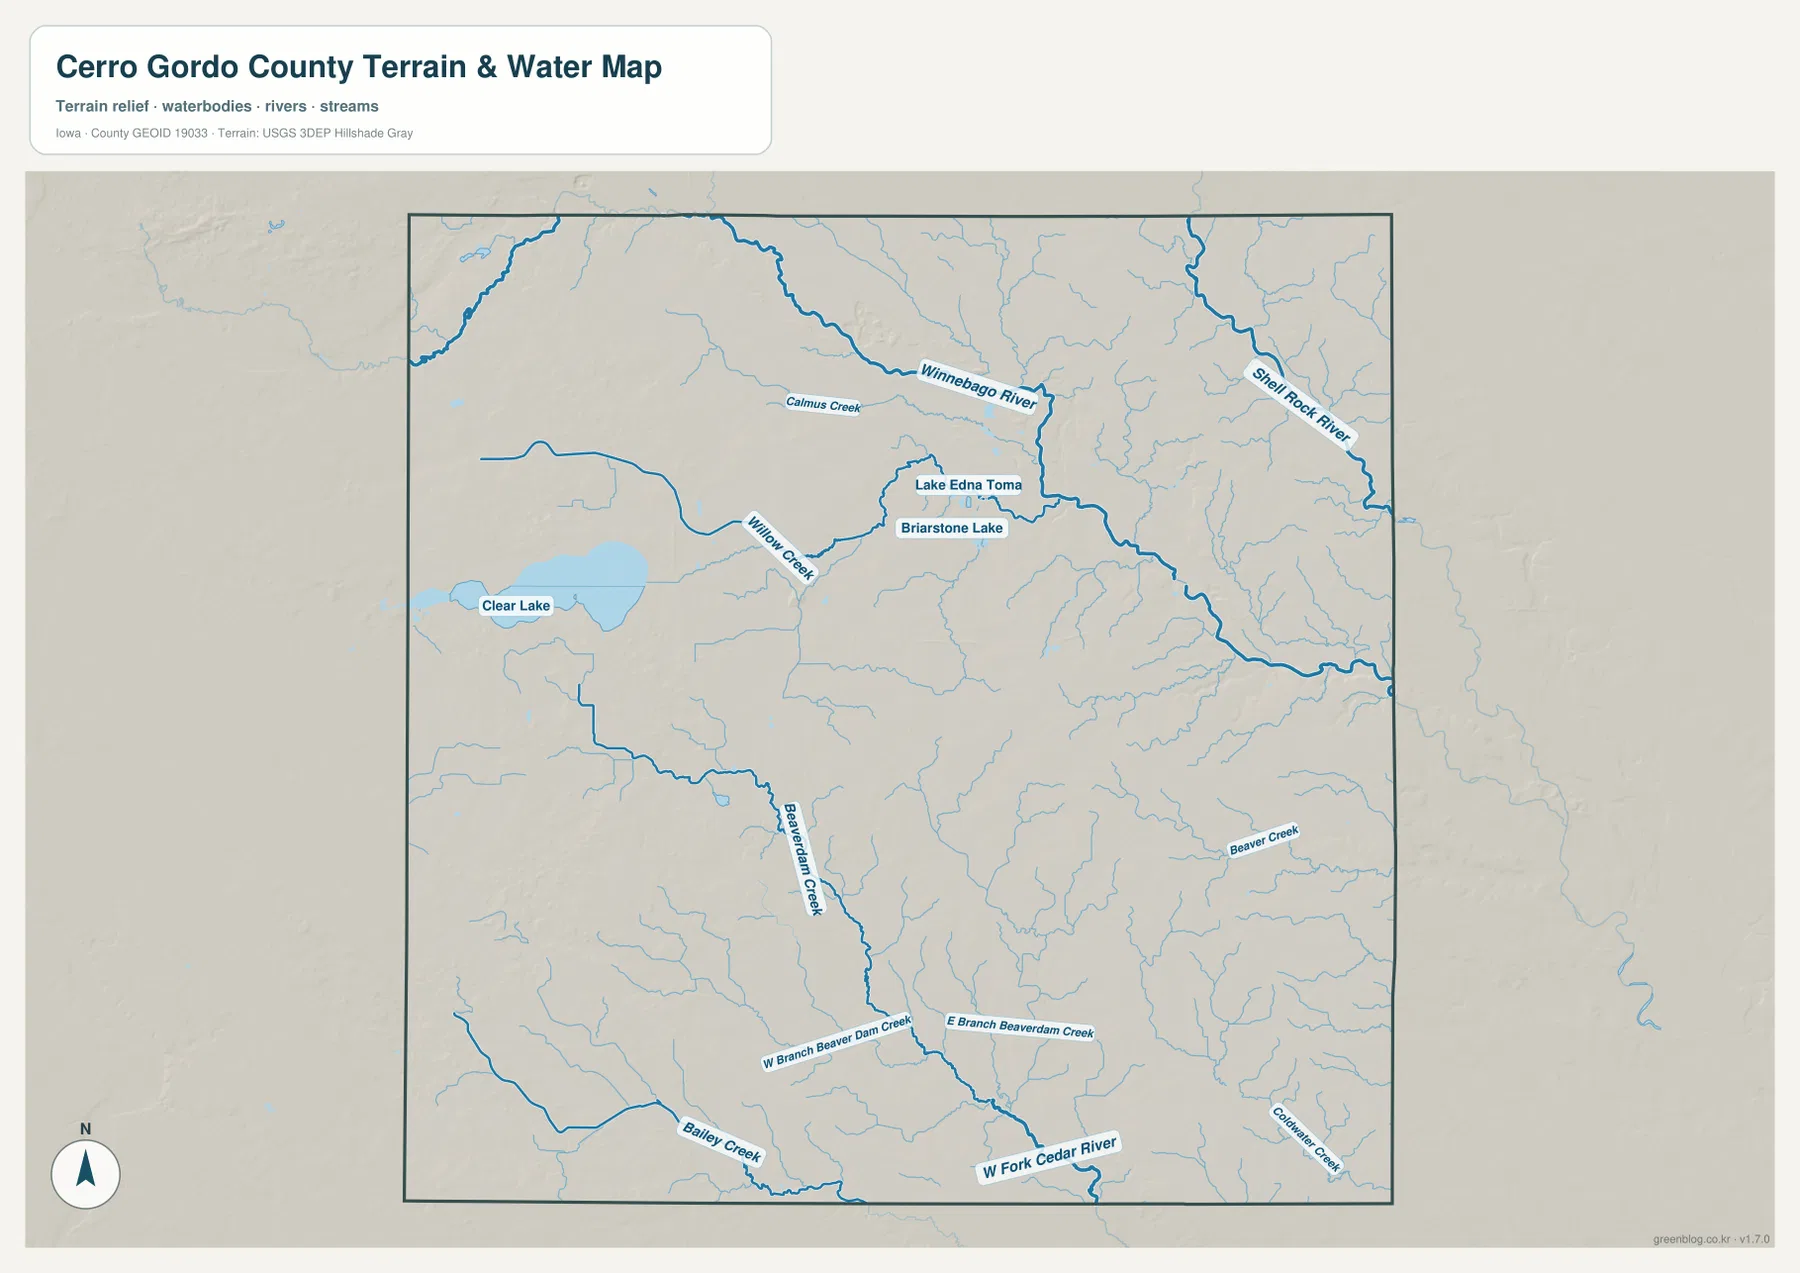
Clear Lake is the most visually prominent water body on the terrain-and-water map. Its broad shape occupies the western side of the county and gives the Clear Lake-Ventura area a landscape that looks very different from the river network farther east. Willow Creek extends away from the lake area toward the north-central interior, while the Winnebago River becomes the major named river across the upper part of the county. Numerous small tributaries feed into it, producing a branching set of lower valleys rather than one wide lake basin.
The Shell Rock River appears in the northeast and should be read as a separate river corridor rather than as another label on the Winnebago. Near the north-central area, Lake Edna Toma and Briarstone Lake are marked close to the Winnebago drainage. These smaller lakes sit very differently from Clear Lake, which is much larger and more isolated on the western side. Comparing the two areas helps explain why the county’s northern water geography cannot be summarized by one feature: the west is dominated by a large lake, while the north-central and eastern areas are more strongly shaped by rivers and tributary valleys.
South of Mason City, Beaverdam Creek runs through the central-southern part of the county. West Branch Beaver Dam Creek and East Branch Beaverdam Creek are labeled farther south, and the West Fork Cedar River follows the southern edge. Bailey Creek and Beaver Creek add smaller drainage lines in the same half of the county. These waterways are less visually dominant than Clear Lake or the Winnebago River, but they matter because they create lower corridors through an otherwise gently rolling landscape. The map is not a flood-hazard, legal-boundary, water-quality, or navigation product; those questions require specialized agency data.
Relief ranges from about 308 to 400 meters, with higher western ground and lower eastern valleys
The elevation legend gives an actual county range of roughly 308 to 400 meters, with a mean near 358 meters. The highest brown and tan colors are concentrated most strongly along the western side and northwest. Clear Lake itself breaks up that high-ground pattern, but the land around the lake generally sits within the higher half of the county’s local color scale. Shaded relief reveals many small ridges and depressions, so the western side is not one perfectly smooth plateau even where the overall elevation is higher.
The broadest low terrain appears in the northeast and east, where green colors follow the Winnebago River, Shell Rock River, and their tributary valleys. If the water map is viewed first, those green corridors become much easier to understand on the elevation image. The lower eastern surface is cut into branching shapes rather than forming a single flat strip. Mason City’s eastern side transitions into this lower river country, while the western side toward Clear Lake retains more of the higher tan and brown surface.
Lower terrain also appears along southern streams, especially around Beaverdam Creek and the West Fork Cedar River, though the green corridors are narrower than the large northeastern lowland. Higher ground remains between these stream valleys, producing a repeated sequence of upland and drainage rather than a simple west-to-east ramp. The colors show relative elevation inside Cerro Gordo County; green does not automatically mean wetland or floodplain, and brown does not mean mountainous terrain. Engineering, construction, or parcel-level elevation questions require source DEM data and professional survey work.
A Clear Lake-to-Mason City comparison ties roads, water, and relief together
One of the most useful ways to read the set is to move east from Clear Lake toward Mason City. On the general map, Iowa 122 provides a simple connection between the two places. On the city map, they stand out as the two largest highlighted communities. The water map then separates the broad lake environment in the west from the Winnebago River and tributary network farther east. This single west-to-east comparison links the human and physical geography without requiring the reader to learn every road or creek name first.
The elevation map adds another layer to that comparison. The Clear Lake side generally lies within higher western terrain, while the land east and northeast of Mason City drops into broader green valleys. Looking back at the water map shows that much of this lower ground corresponds with river channels and their tributaries. The contrast is especially helpful because it prevents the county from being treated as uniformly flat. Elevation differences are modest compared with mountain regions, but they are large enough within the county to shape visible valleys and drainage directions.
The southern half can be read in a similar way by using U.S. 65 and I-35 as reference lines. Rockwell sits along the U.S. 65 side south of Mason City, while Thornton lies closer to I-35 in the southwest. Beaverdam Creek and the West Fork Cedar River cut lower paths across this broader rural area. Starting with a town or highway on the general map and then switching to the water and elevation maps is usually easier than starting with terrain colors alone, because the reference location remains clear across all four images.
Pick the map by question, then use the JPG files for close inspection
For roads, towns, and county orientation, the general map should usually come first. It combines Mason City, Clear Lake, Rockwell, Thornton, and other labels with I-35, U.S. 65, U.S. 18/Iowa 27, and Iowa 122. The city-distribution map is better when the question is how the six highlighted communities compare in size and direction. It intentionally removes much of the road detail, making the strong northern concentration and the smaller outlying towns easier to see.
For natural features, begin with Clear Lake and the Winnebago River on the terrain-and-water map, then switch to elevation. This sequence makes the western high ground and eastern river lowlands much easier to recognize. In the south, Beaverdam Creek and the West Fork Cedar River provide useful anchors for smaller valleys. The water image is not a flood map or a legal property map, and the elevation image is not survey-grade. Using each map for its intended question gives a clearer result than trying to extract every type of information from a single image.
The WebP images on the page are reduced for fast browsing. The download archive contains the original 3638 × 2572 pixel JPG versions of the general county, city-distribution, terrain-and-water, and elevation maps. These larger files are more practical for zooming into labels, printing, or comparing the same location across several subjects. Because all four maps use the same county extent, a road, stream, city, or valley can be followed from one image to the next without changing the overall frame.
Frequently Asked Questions
What is the quickest way to compare Clear Lake with Mason City?
Start with the general map and find Iowa 122 between the two places. Clear Lake is on the western side beside the large lake, while Mason City lies to the east in the north-central part of the county. The city-distribution map then simplifies the comparison by highlighting them as the two largest places in the supplied ranking. After that, the water and elevation maps show how their surrounding landscapes differ.
Where does the lowest terrain appear most clearly on the elevation map?
The broadest low green areas are in the northeast and east. Comparing the water map shows that these lower corridors line up closely with the Winnebago River, Shell Rock River, and their tributaries. Smaller low areas also occur around Beaverdam Creek and the West Fork Cedar River in the south. The elevation legend shows an overall county range of about 308 to 400 meters.
Can the terrain-and-water map be used as a flood or water-quality map?
No. It is designed to show the position of Clear Lake, the Winnebago and Shell Rock rivers, named creeks, and the surrounding terrain. It does not provide flood-zone boundaries, legal water boundaries, water-quality classifications, or navigation status. Those questions should be checked with current USGS, Iowa DNR, county, or other specialized agency data.
Sources and reference material
For additional county background and official map-data context, the following sources are useful.
- Cerro Gordo County Government
- Cerro Gordo County Conservation
- Iowa DOT – Cerro Gordo County Maps
- U.S. Census Bureau TIGER/Line Shapefiles
- USGS National Hydrography
- USGS 3D Elevation Program
Map File Information
The original high-resolution JPG files are bundled in one ZIP for closer viewing and printing of Cerro Gordo County roads, cities, waterways, terrain, and elevation.
- File Type: ZIP containing 4 JPG files
Related Maps
Green Map creates custom-edited map images using open geographic data sources such as geoBoundaries, Natural Earth, OpenStreetMap, and government open data.
These maps are edited visual materials, not raw data files, and are provided for education, documents, presentations, and graphic reference.