Merchandise exporters differed sharply in 2023 in the share of their goods exports sent to low- and middle-income economies in Latin America and the Caribbean. World Bank indicator TX.VAL.MRCH.R3.ZS measures that destination share as a percentage of each reporting economy’s total merchandise exports. The source table contains 217 country and economy rows: 192 have a 2023 value and 25 are source-missing.
The ratio describes the composition of export destinations, not the absolute size of trade. Two reporters can both record 20% while exporting very different dollar amounts overall. The map is therefore best read as a comparison of how important this destination group is within each reporter’s merchandise-export portfolio, rather than a ranking of which country shipped the most dollars to Latin America and the Caribbean.
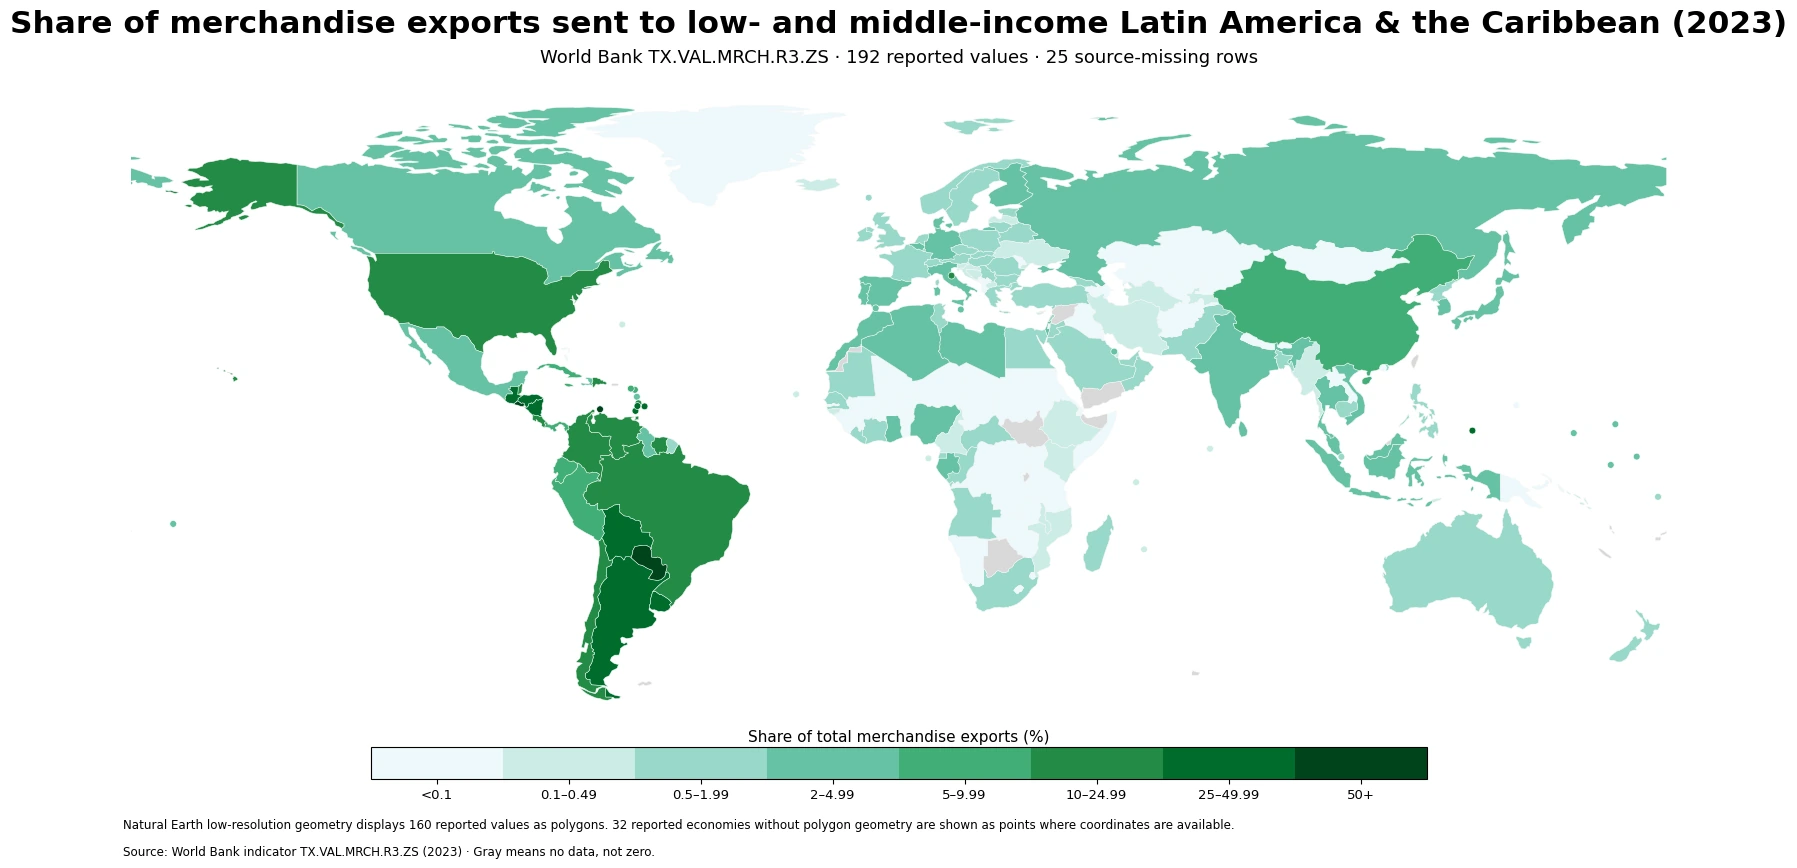
Table of Contents
All ten highest shares were reported within Latin America and the Caribbean
Paraguay has the highest reported value at 66.04%. El Salvador follows at 54.29% and Aruba at 51.83%. Guatemala is at 46.63% and Bolivia at 41.11%. Uruguay, Honduras, Grenada, Argentina and Barbados complete the top ten, so every economy in the highest ten is located in Latin America or the Caribbean.
| Top rank | Country/economy | Export share | Bottom rank | Country/economy | Export share |
|---|---|---|---|---|---|
| 1 | Paraguay | 66.04% | 1 | Afghanistan | 0.0003% |
| 2 | El Salvador | 54.29% | 2 | Uganda | 0.0010% |
| 3 | Aruba | 51.83% | 3 | Gambia, The | 0.0016% |
| 4 | Guatemala | 46.63% | 4 | Lao PDR | 0.0021% |
| 5 | Bolivia | 41.11% | 5 | Chad | 0.0023% |
| 6 | Uruguay | 37.81% | 6 | Guinea | 0.0026% |
| 7 | Honduras | 33.64% | 7 | Congo, Dem. Rep. | 0.0029% |
| 8 | Grenada | 31.65% | 8 | Iraq | 0.0033% |
| 9 | Argentina | 30.59% | 9 | Azerbaijan | 0.0034% |
| 10 | Barbados | 29.62% | 10 | Togo | 0.0034% |
At the other end, Afghanistan is near 0.0003%, Uganda near 0.0010% and The Gambia near 0.0016%. Every observation in the bottom ten is below 0.004%. That distance between the two ends of the distribution is one reason the mean alone is a poor description of a typical reporting economy.
The destination share varies widely even inside the region
The concentration of high values in Latin America and the Caribbean does not mean that reporters within the region are uniform. Brazil records 12.49%, Chile 13.40%, Colombia 19.47% and Costa Rica 21.07%. Mexico is much lower at 3.35% and Guyana at 2.74%. The map shows this unevenness clearly: darker areas appear in parts of southern South America, Central America and the Caribbean, while neighboring reporters can sit several bands apart.
The denominator helps explain why regional proximity is not enough to predict the value. The series divides exports to the defined destination group by all merchandise exports of the reporting economy. A reporter with large export markets elsewhere can have a modest ratio even when it trades substantially within the region. The indicator should therefore be interpreted as a portfolio share rather than a simple measure of geographic closeness.
A 1.15% median sits far below the 4.94% mean
The median across the 192 reported values is 1.15%, compared with a mean of 4.94%. The first quartile is 0.18% and the third quartile is 3.17%, so the middle half of observations lies between roughly 0.18% and 3.17%. A relatively small number of reporters above 25% and 50% create a long upper tail and pull the arithmetic mean upward.
| Share of total merchandise exports | Observations | Share of 192 |
|---|---|---|
| Below 0.1% | 44 | 22.9% |
| 0.1–0.49% | 27 | 14.1% |
| 0.5–1.99% | 52 | 27.1% |
| 2–4.99% | 36 | 18.8% |
| 5–9.99% | 8 | 4.2% |
| 10–24.99% | 12 | 6.2% |
| 25–49.99% | 10 | 5.2% |
| 50% or more | 3 | 1.6% |
The largest single band is 0.5–1.99%, with 52 observations. Another 44 are below 0.1% and 27 are between 0.1% and 0.49%. Combined, 123 of 192 reporters, or 64.1%, are below 2%. Only 13 are at 25% or more and just three exceed 50%. The most saturated map colors therefore represent a small minority of the reported global sample.
Reporters outside the destination region can still record sizable shares
The reporting universe is global; only the partner destination group is restricted to low- and middle-income Latin America and the Caribbean. That distinction allows economies outside the region to record relatively high shares. Palau is at 27.73%, the United States at 23.41% and San Marino at 11.18%. The map therefore describes how exporters around the world are connected to this destination group, not only trade among Latin American and Caribbean economies.
The ratio does not reveal which products produced those shares, whether re-exports matter, or whether a particular firm, contract or price movement drove the result. Those mechanisms require commodity-level and multi-year evidence. The 2023 value establishes the destination share for that year, but it does not by itself identify the cause of a high or low observation.
A high percentage is not the same as a large export value
The denominator is each reporter’s total merchandise exports. A small exporter can post a high percentage even when its dollar shipments to the destination group are modest. A very large global exporter can ship a substantial dollar amount to the same markets while the group still represents only a small fraction of its total exports.
TX.VAL.MRCH.R3.ZS is therefore useful for studying trade orientation, destination concentration and market mix, but it is not a direct ranking of export scale or competitiveness. A high share is not inherently favorable or unfavorable. Questions about diversification, concentration risk or market performance require absolute export values, commodity composition and a longer time series.
A 2023 destination share should not be treated as a permanent trade structure
The cross-section captures the destination mix for 2023, but it does not establish whether a high share is persistent. Commodity-price movements, a fall in exports to other regions, or one unusually large shipment can change the ratio even without a comparable change in physical trade volumes. The reverse is also possible: exports to the destination group can rise in dollars while the share falls because total merchandise exports grew faster.
Long-run comparisons also need attention to classification. The World Bank series uses regional and income groupings for partner economies, and those classifications can change over time. A multi-year analysis should therefore check both the numerical trend and whether the composition of the partner group remained comparable. The 2023 cross-section avoids that particular year-to-year complication because all reporters are evaluated against the same period definition.
Twenty-five missing rows remain missing rather than becoming zeros
Twenty-five of the 217 source rows do not have a 2023 value. Those rows are excluded from the ranking, mean, median, quartiles and band counts, and they appear as no data on the map. Replacing them with zero would falsely state that the reporter sent no merchandise exports to the destination group and would distort both the distribution and the geography.
The map uses Natural Earth low-resolution world geometry joined by ISO3 identifiers. Of the 192 reported values, 160 can be drawn directly as country polygons. Reported small states and territories that are absent from the low-resolution polygon layer are represented as points when coordinates are available. Cartographic coverage therefore differs from the statistical observation count without dropping those observations from the calculations.
Source and calculation
The analysis uses 2023 observations from the World Bank API series TX.VAL.MRCH.R3.ZS. World Bank metadata identifies the sources as World Bank staff estimates and the IMF Direction of Trade database and lists the series as annual.
Under the World Bank definition, the numerator is merchandise exports from the reporting economy to low- and middle-income economies in Latin America and the Caribbean, while the denominator is total merchandise exports from that reporting economy. The indicator is computed only when at least half of the economies in the partner group have non-missing data. The maxima, minima, rankings, mean, median, quartiles and band counts above are calculated directly from the 192 non-missing 2023 observations.
Frequently Asked Questions
What does this merchandise-export share measure?
It is the percentage of a reporting economy's total merchandise exports sent to economies classified by the World Bank as low- and middle-income in Latin America and the Caribbean.
Does a higher share mean a larger export value in dollars?
No. The measure is a ratio to the reporter's total merchandise exports. A small exporter can have a high share, while a large exporter can ship more dollars but have a lower percentage.
Are the 25 missing 2023 observations equal to zero?
No. They are source-missing values, not zero trade shares, and they are excluded from rankings and summary statistics.
Related Maps
Green Map creates custom-edited map images using open geographic data sources such as geoBoundaries, Natural Earth, OpenStreetMap, and government open data.
These maps are edited visual materials, not raw data files, and are provided for education, documents, presentations, and graphic reference.