Out-of-pocket health spending per person varies enormously across countries. This analysis uses the 2023 World Bank series SH.XPD.OOPC.PP.CD, measured in current PPP international dollars per person. The source table contains 217 country and economy rows: 192 have a reported 2023 value and 25 are source-missing. Missing observations remain missing rather than being converted to zero.
The indicator captures direct household payments for health goods and services, expressed on a purchasing-power-parity basis. It is an amount, not the percentage of health expenditure paid out of pocket. That distinction matters: a country can have a relatively high amount per person but a moderate out-of-pocket share if overall health spending is also high.
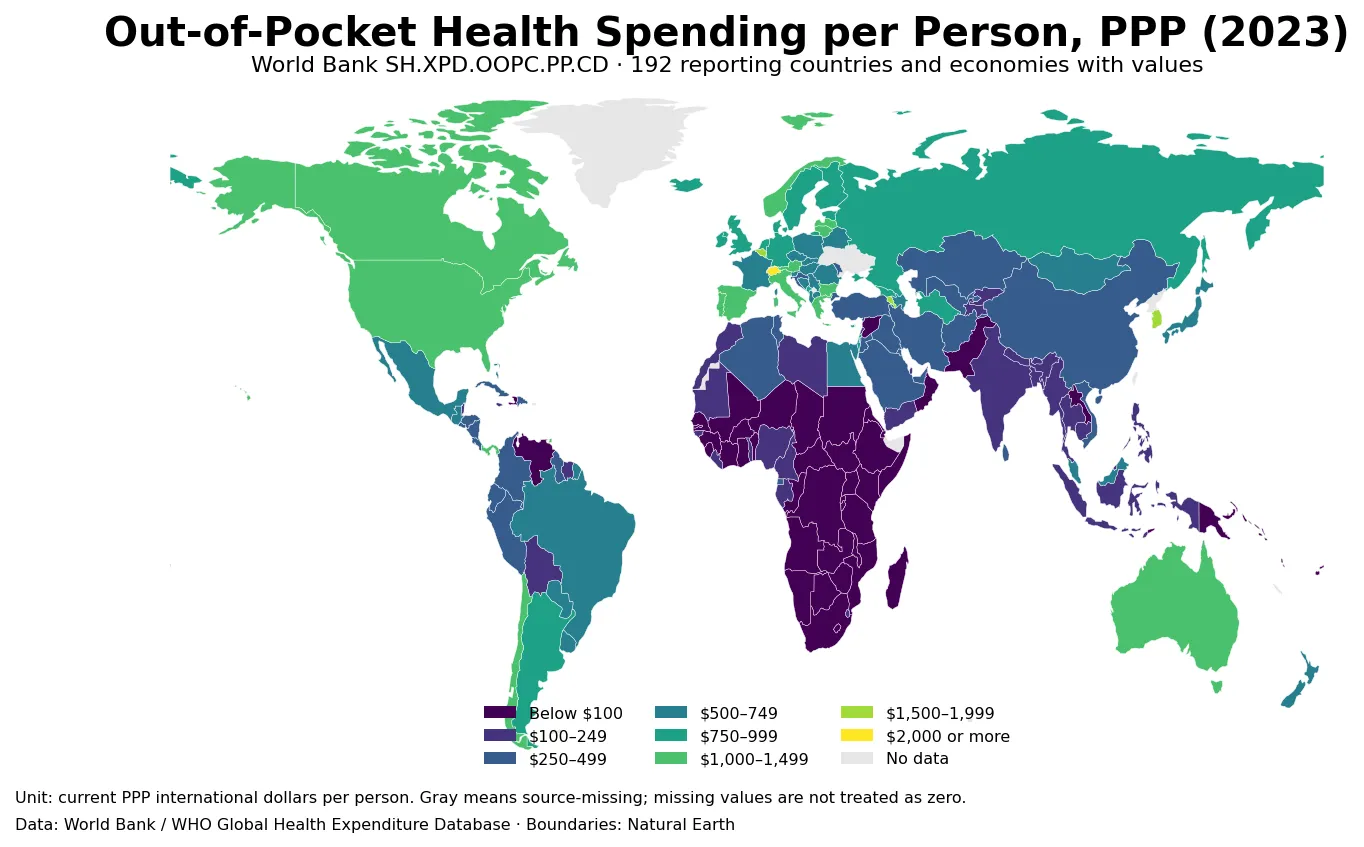
Table of Contents
What this measure captures—and what it does not
Out-of-pocket spending refers to payments households make directly when obtaining health care, medicines, medical goods or related services. It is different from prepaid insurance contributions. The per-capita PPP series divides that spending across the population and converts it into international dollars using purchasing-power adjustments so that price-level differences are less distorting in a cross-country comparison.
Because the unit is “current” PPP international dollars, the 2023 map is best read as a same-year cross-section. It is not an inflation-adjusted constant-price series designed for long-run comparisons. It also says nothing by itself about whether the spending was affordable, whether needed care was forgone, or how much of total health expenditure was covered by public financing or insurance.
The 2023 range runs from less than one international dollar to more than 2,300
Among the 192 reported values, Switzerland is highest at 2,335.33 current PPP international dollars per person, while Tuvalu is lowest at 0.74. The gap is about 2,334.58. The upper end is geographically mixed: several European economies appear alongside Singapore, Armenia, the United States and Panama.
| Top rank | Country/economy | PPP international $ per person | Bottom rank | Country/economy | PPP international $ per person |
|---|---|---|---|---|---|
| 1 | Switzerland | 2,335.33 | 1 | Tuvalu | 0.74 |
| 2 | Liechtenstein | 1,931.33 | 2 | Solomon Islands | 4.85 |
| 3 | Malta | 1,764.64 | 3 | Rwanda | 7.26 |
| 4 | Singapore | 1,665.23 | 4 | Marshall Islands | 9.20 |
| 5 | Armenia | 1,635.69 | 5 | Zimbabwe | 10.97 |
| 6 | Belgium | 1,610.94 | 6 | Papua New Guinea | 11.38 |
| 7 | Korea, Rep. | 1,523.41 | 7 | Kiribati | 11.66 |
| 8 | United States | 1,472.25 | 8 | Vanuatu | 11.84 |
| 9 | Portugal | 1,371.22 | 9 | Micronesia, Fed. Sts. | 12.43 |
| 10 | Panama | 1,342.40 | 10 | Mozambique | 14.79 |
The bottom of the table includes several small Pacific economies and a number of Sub-Saharan African countries. A low dollar amount should not automatically be interpreted as strong financial protection. It can reflect better prepaid coverage, but it can also coexist with low service use, limited access, lower health-sector prices or lower overall health spending. The indicator reports the amount, not the reason for that amount.
The median is $276, far below the mean
The median across the 192 reported economies is 276.46 international dollars, while the mean is 446.36. The first quartile is 88.13 and the third quartile is 668.48, so the middle half of the observations lies between roughly $88 and $668. The mean being substantially above the median reflects the long upper tail created by economies above $1,000 per person.
| Per-capita out-of-pocket band | Number of observations | Share of 192 |
|---|---|---|
| Below $100 | 54 | 28.1% |
| $100–249 | 33 | 17.2% |
| $250–499 | 35 | 18.2% |
| $500–749 | 30 | 15.6% |
| $750–999 | 18 | 9.4% |
| $1,000–1,499 | 15 | 7.8% |
| $1,500–1,999 | 6 | 3.1% |
| $2,000 or more | 1 | 0.5% |
Fifty-four economies, or 28.1% of the reported sample, are below $100. Another 35 lie between $250 and $499, and 30 are between $500 and $749. At the upper end, 22 observations exceed $1,000 and seven exceed $1,500. The map therefore has a relatively small set of very high values sitting above a broad lower and middle distribution.
A high amount is not the same as a high burden
The amount a person pays out of pocket depends on more than insurance design. Higher incomes, greater use of health services, higher prices, a larger private sector and different benefit packages can all affect the dollar amount. Two economies with the same out-of-pocket share of current health expenditure can still have very different per-capita amounts if their total health spending differs.
To assess financial protection, this measure should be read with indicators such as out-of-pocket spending as a share of current health expenditure, catastrophic health spending, household income or consumption, and unmet need. The 2023 map is useful for identifying where direct payment volumes are large or small in purchasing-power terms; it is not a league table of health-system quality.
The map shows broad regional contrasts but also many exceptions
Many European economies, North America and selected economies in Asia and Latin America occupy the higher bands. Much of Sub-Saharan Africa and several Pacific island economies fall into lower bands. Yet the pattern is not uniform within any region: values differ widely among neighboring or economically similar countries. That makes the map useful for spotting outliers and clusters, but not for assigning a single regional explanation.
Income, utilization, provider prices, public financing, insurance coverage and pharmaceutical purchasing can all influence observed out-of-pocket spending. The single indicator does not identify the contribution of each factor, so geographic clustering should be treated as a descriptive pattern rather than evidence of causation.
Twenty-five missing observations are not zeros
The source table has 25 rows without a 2023 value. They are shown as no data and excluded from the ranking, mean, median, quartiles and band counts. Treating those rows as zero would falsely imply that households made no direct health payments and would distort both the map and the distribution.
The low-resolution Natural Earth layer contains 177 display geometries, and 164 can be matched to a non-missing 2023 value after ISO3 joins. Tiny states and territories such as Liechtenstein, Malta, Singapore and Tuvalu may be invisible or absent at world-map scale even though their observations remain in the statistics. Cartographic visibility therefore should not be confused with statistical coverage.
Data source and calculation
The analysis uses 2023 observations from the World Bank API for SH.XPD.OOPC.PP.CD. The World Bank indicator page identifies the WHO Global Health Expenditure Database as the underlying source.
All maxima, minima, rankings, averages, quartiles and distribution counts are calculated directly from the 192 non-missing 2023 observations. The 25 source-missing rows are never imputed. Current PPP international dollars improve same-year purchasing-power comparability, but they should not be read as a standalone measure of affordability or health-system performance.
Frequently Asked Questions
What does out-of-pocket health spending per capita in PPP dollars measure?
It measures direct household payments for health goods and services per person, converted into current international dollars using purchasing-power parity.
Does a high per-capita amount mean poor financial protection?
Not necessarily. The amount also depends on overall health spending, utilization, prices and income. Out-of-pocket shares and affordability indicators are needed to assess financial protection.
Were missing 2023 values treated as zero?
No. Twenty-five source-missing rows remain missing and are excluded from the rankings, averages, quartiles and distribution counts.
Related Maps
Green Map creates custom-edited map images using open geographic data sources such as geoBoundaries, Natural Earth, OpenStreetMap, and government open data.
These maps are edited visual materials, not raw data files, and are provided for education, documents, presentations, and graphic reference.