You can download the high-resolution JPG files for this Porter County Map set directly from the ZIP on this page. Porter County stretches from the Lake Michigan shoreline through the Portage–Chesterton corridor to Valparaiso and then into the quieter southern countryside around Hebron and Kouts. Those places work well as anchors: Portage represents the northwestern urban side, Valparaiso marks the county center, and Hebron and Kouts show how far the county continues into a much more open agricultural landscape where roads, waterways, and relief look noticeably different from the lakefront.
The northern edge is shaped by Lake Michigan, shoreline communities, major highways, and the Indiana Dunes landscape. Farther inland, the ground rises into rolling glacial hills around and east of Valparaiso. South of those hills, development thins out and the terrain becomes lower and broader toward the Kankakee side. Porter County’s own geographic description follows the same sequence: lakefront and dunes in the north, moraine hills in the middle, and an agricultural outwash plain in the south. Reading the maps in that order makes the county easier to understand than starting with individual road numbers.
The WebP images on the page are reduced previews for quick viewing. The downloadable archive contains the supplied high-resolution JPG originals for the general county map, city map, water map, and elevation map. Those larger files are better when small route shields, creek names, lake labels, or relief colors need to remain legible on a large screen or in print.
Table of Contents
Use the Lake Michigan communities to trace the northern road network toward Valparaiso
Portage is the easiest place to begin on the general map because it sits inside the densest cluster of northern roads. I-94 runs across this part of the county, while U.S. 12 and U.S. 20 stay closer to the Lake Michigan side. Ogden Dunes lies near the shoreline west of Burns Harbor, and Porter, Dune Acres, and Beverly Shores continue the chain of named places toward the northeast. These communities occupy a comparatively narrow northern band between the lake and the interior county.
Chesterton provides the most useful connection between the shoreline corridor and Valparaiso. State Road 49 passes through the Chesterton area and continues south to the county seat, so the same road can be followed across two very different parts of Porter County. Around Valparaiso, U.S. 30 becomes the major east-west reference. U.S. 6 runs farther north through the South Haven and Wheeler side, while State Roads 130 and 149 help separate the western interior from the Portage area.
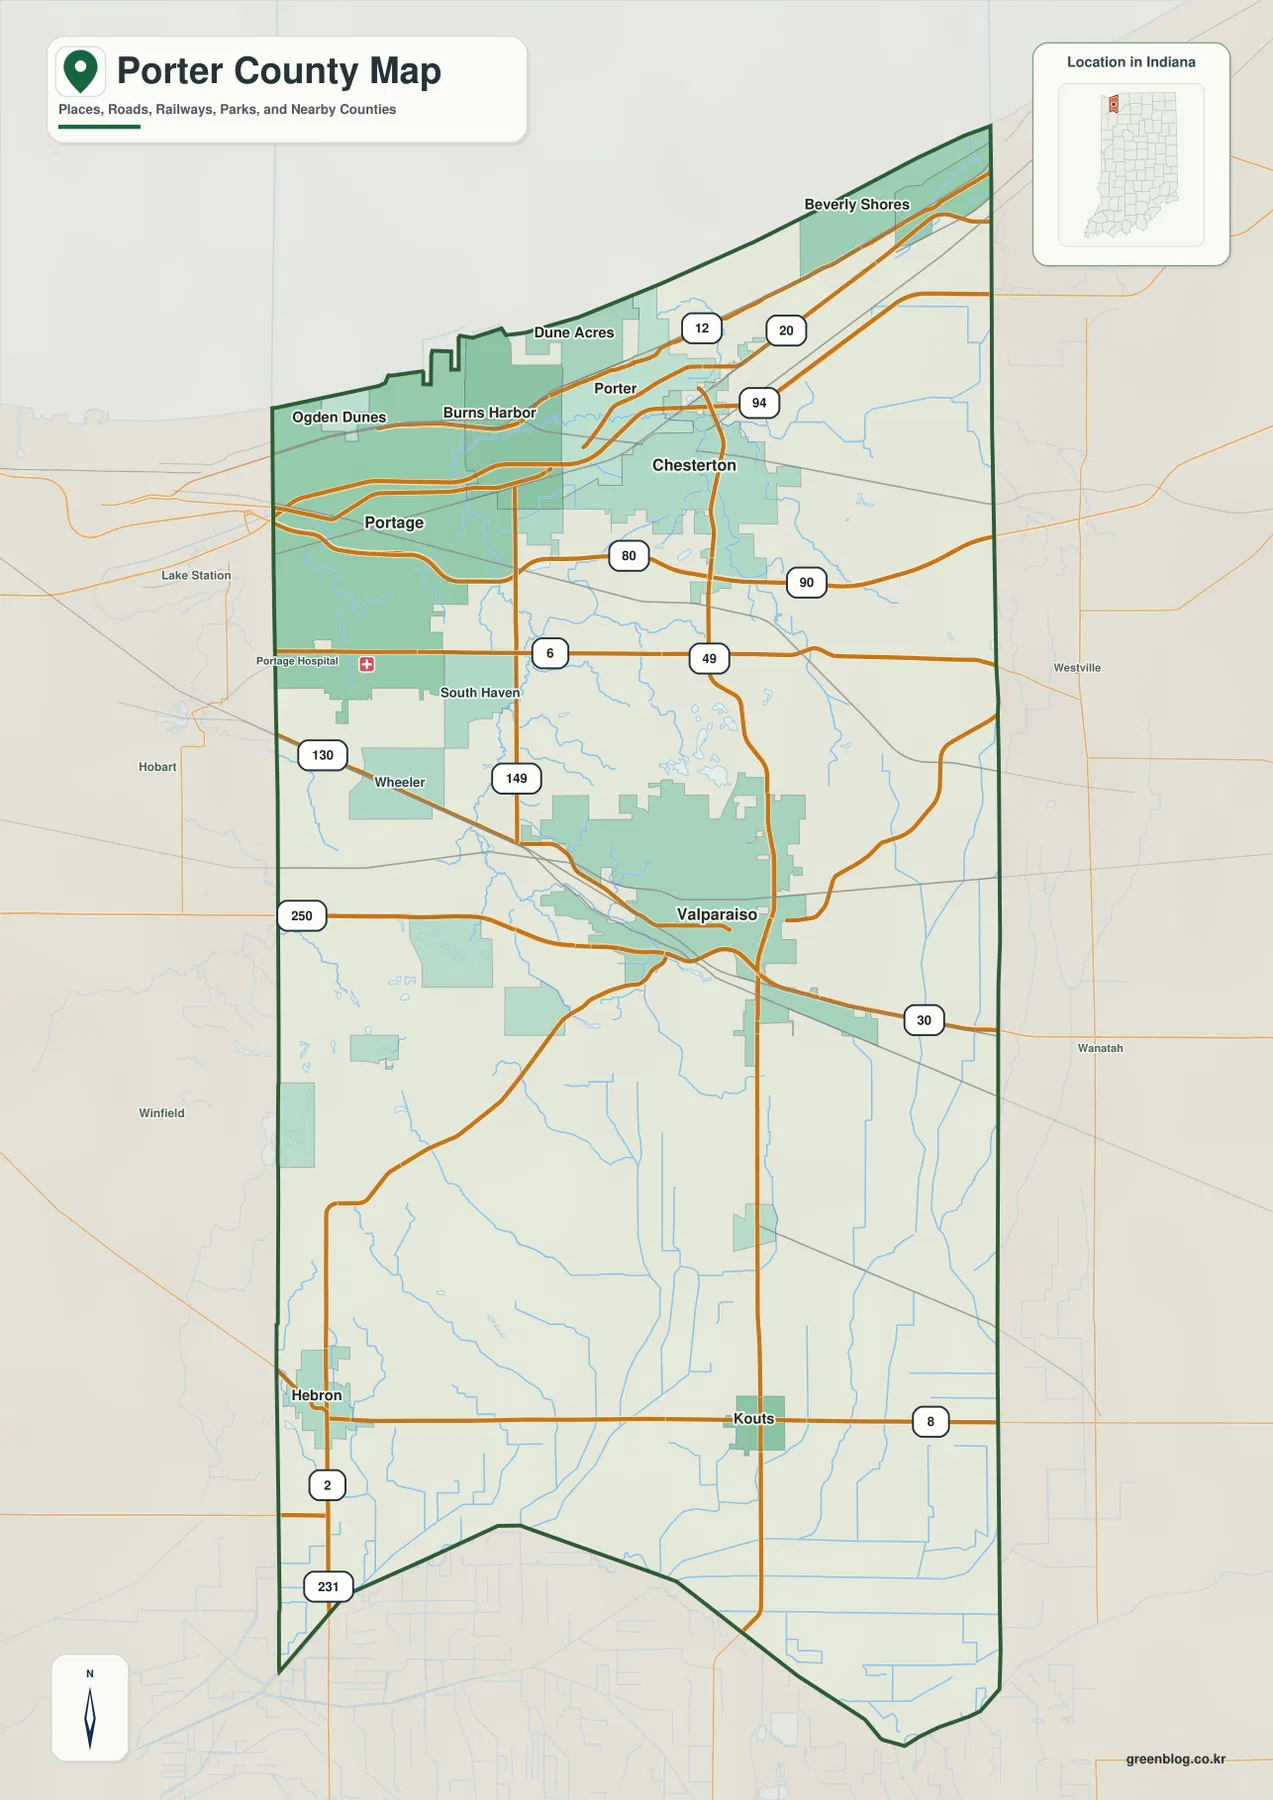
The road pattern changes again south of Valparaiso. Hebron is a clear southwestern reference near State Road 2 and U.S. 231, while Kouts sits farther east near the long north-south State Road 49 corridor. The southern map is much less crowded than the Portage–Chesterton area. A few numbered roads, the two towns, and the long network of drainage channels are therefore more useful for orientation than a dense street grid.
That contrast is important when estimating distance within the county. Portage and Chesterton may appear to dominate the first part of the map because so many roads and place labels are packed into the north, but Porter County extends a long way beyond Valparaiso. Keeping Hebron and Kouts visible prevents the southern half from being overlooked and makes the county’s elongated north-south shape much more obvious.
The city map separates the northern cluster from Valparaiso, Hebron, and Kouts
The supplied city map highlights six places: Portage, Valparaiso, Chesterton, Porter, Hebron, and Kouts. Its printed index lists Portage at 38,082, Valparaiso at 34,733, Chesterton at 14,446, Porter at 5,217, Hebron at 3,976, and Kouts at 2,372. These are values printed on this map edition rather than a live population feed, so they should be treated as map-reference figures. For current demographic work, consult an up-to-date official statistical source.
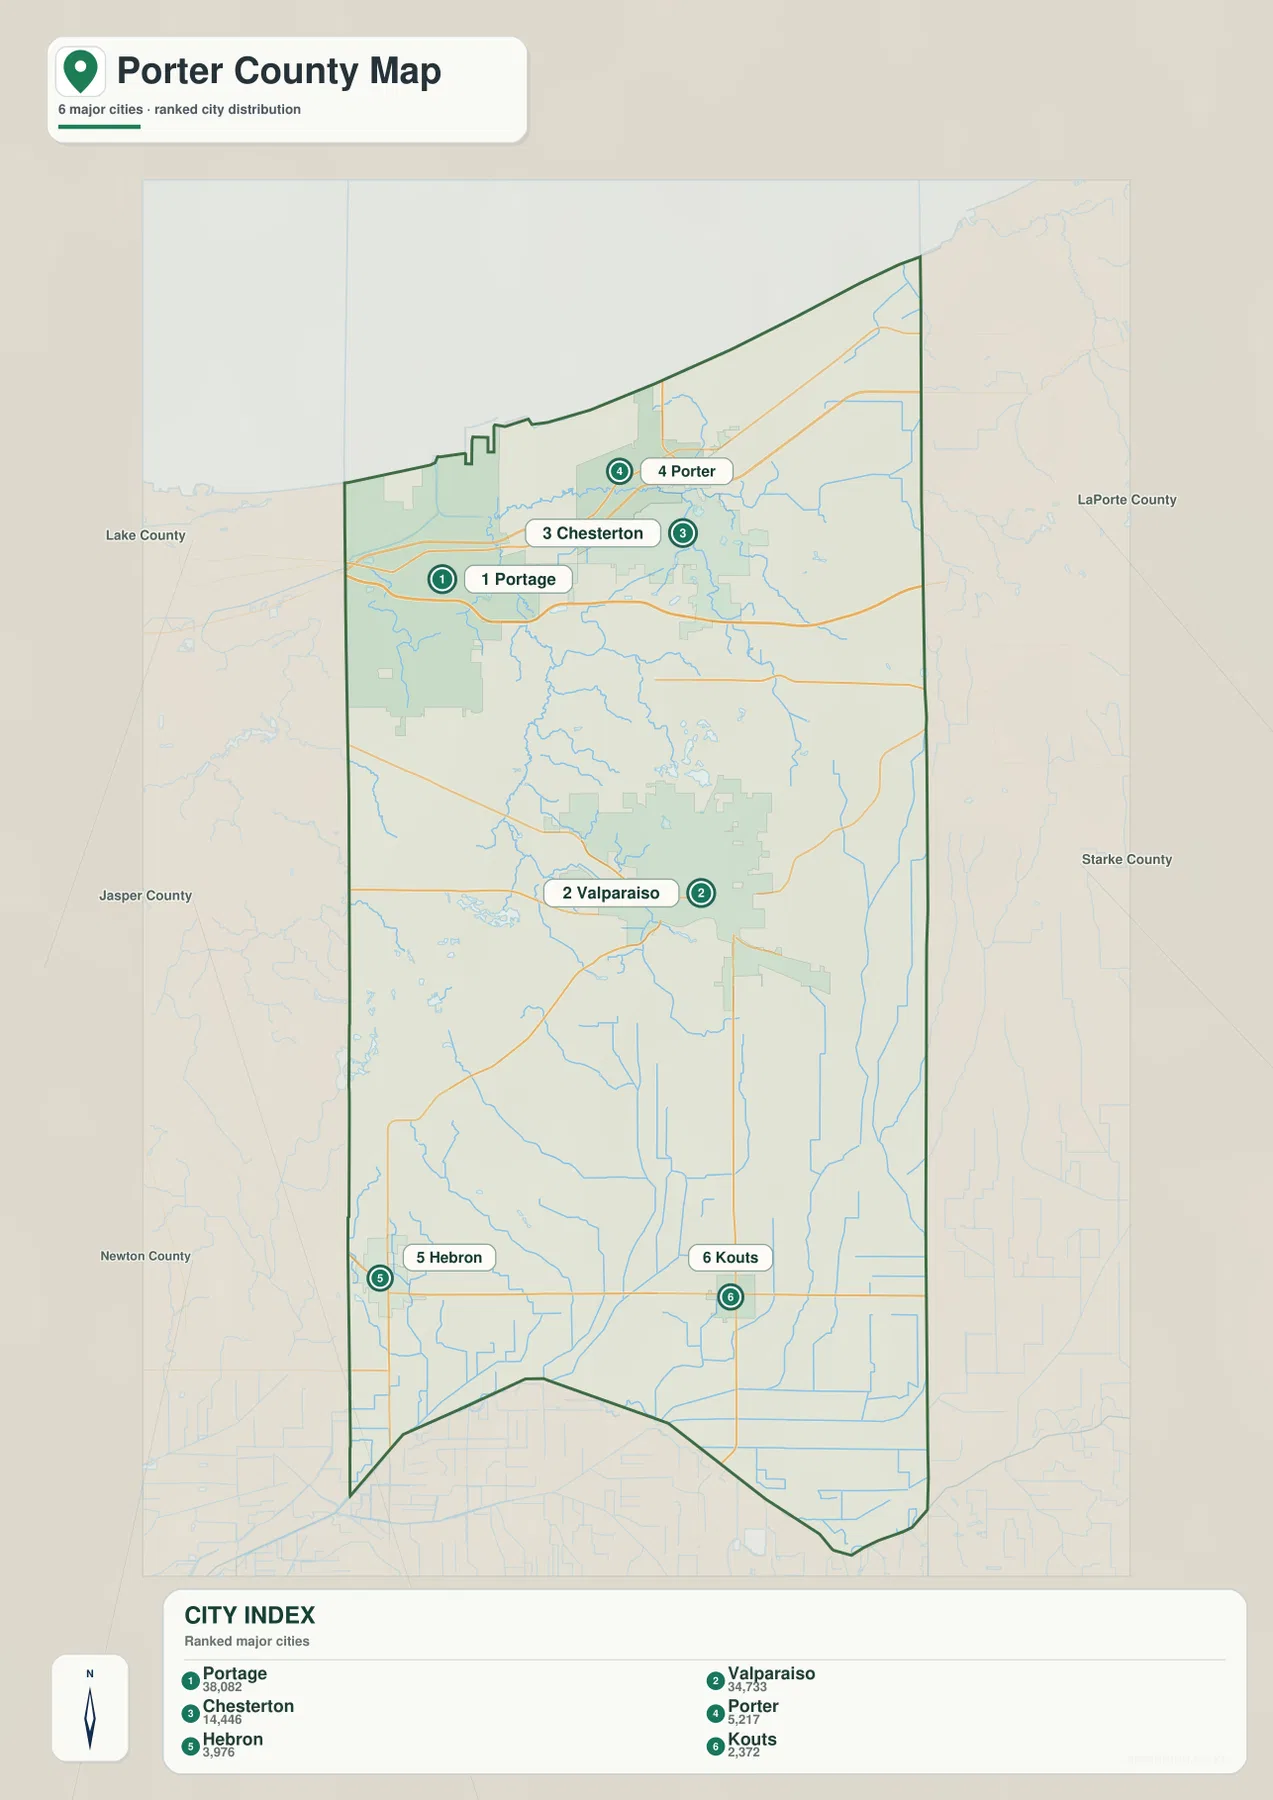
The value of the city map is spatial simplicity. Portage, Chesterton, and Porter form a tight northern group, but Valparaiso is clearly separated to the south as the central county seat. Hebron and Kouts sit farther south again, with large rural areas between them and the northern concentration. This arrangement explains why the county can feel highly urbanized near Lake Michigan and much more open only a short distance beyond Valparaiso.
Use the general map when you need to locate Burns Harbor, Dune Acres, Beverly Shores, Ogden Dunes, South Haven, Wheeler, or the roads that connect them. Switch to the city map when the goal is to compare Portage, Valparaiso, Chesterton, Porter, Hebron, and Kouts without the extra road and water labels. Looking at both views also makes it clear that the six indexed places are reference points rather than the complete set of communities in Porter County.
Lake Michigan dominates the north, while creeks and small lakes organize the interior
The water map changes the emphasis completely. Lake Michigan fills the northern edge and immediately establishes the county’s shoreline setting. Just inland, the Little Calumet River crosses the northwestern portion, with Willow Creek nearby. These features help explain why the northern landscape contains broad low areas and wetland-associated terrain even though the nearby dune ridges can rise sharply above the lake.
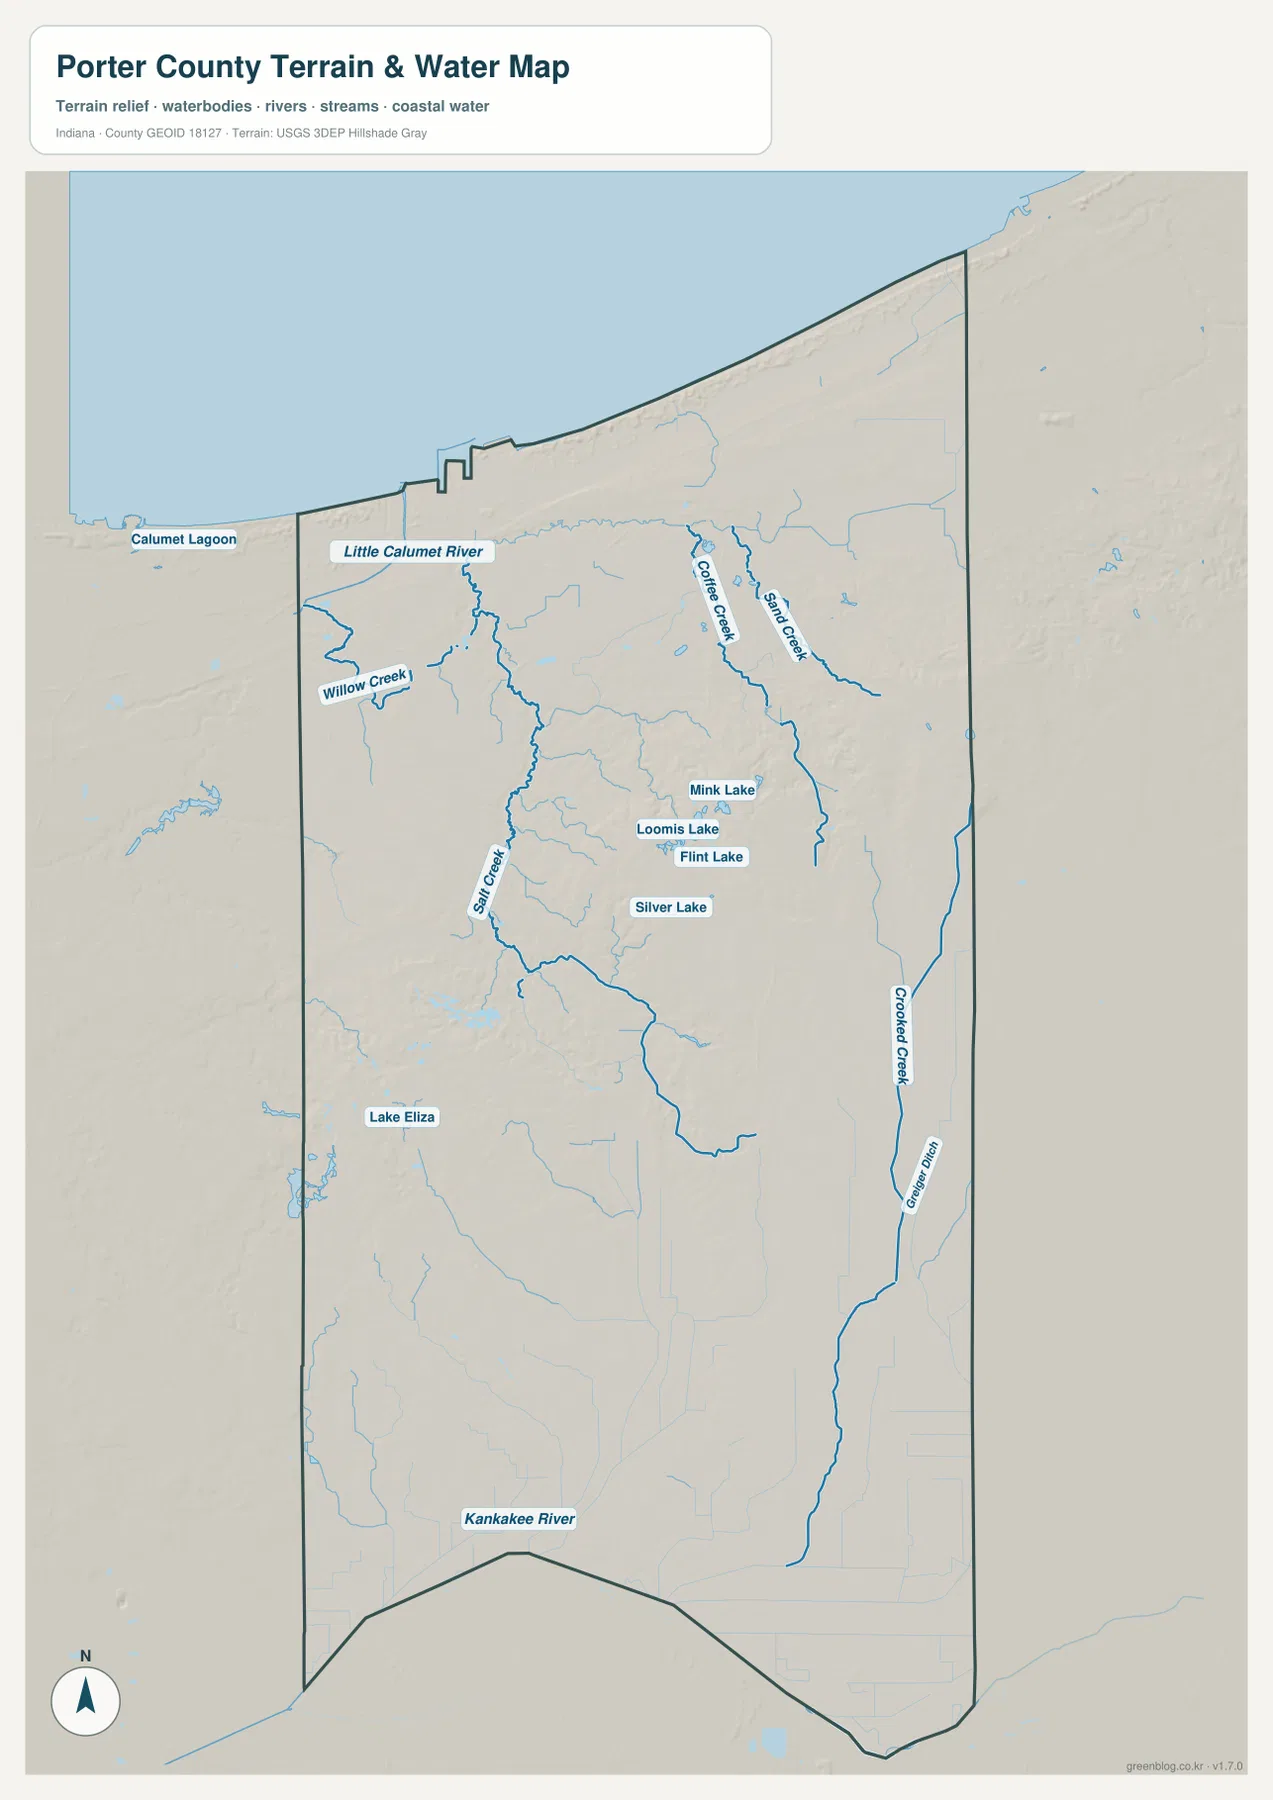
Salt Creek is a major interior reference because it runs through the north-central and central part of the county. Coffee Creek and Sand Creek lie farther east, while Crooked Creek forms a long drainage line down the eastern side. The map also labels Cornell Ditch near the eastern edge. Together, these named channels are useful when the road map begins to feel crowded, because they show the lower corridors that cut through the rolling interior terrain.
A cluster of small lakes appears near the county center, including Flint Lake, Loomis Lake, Mink Lake, and Silver Lake. Lake Eliza is labeled farther west. These water bodies are easy to miss on the general map but become obvious on the dedicated water view. The Kankakee River is the major southern water reference. The map is intended for county-scale orientation, however, not for legal water boundaries, floodplain determinations, or drainage design.
One effective way to use this view is to keep Valparaiso fixed in mind and compare the creeks around it. Salt Creek lies to the west and northwest, Coffee Creek and Sand Creek are farther north and east, and Crooked Creek runs down the eastern side of the county. Moving back to the general map after that comparison makes it easier to see why some roads and settled areas follow particular corridors rather than forming a simple grid.
The elevation map rises into central-eastern hills, then falls toward the southern plain
The supplied elevation map spans approximately 177 to 265 meters and shows a mean of 212 meters. Low green tones dominate much of the Lake Michigan side, although the shoreline itself contains narrow dune ridges and small-scale relief. The National Park Service notes that dunes in Indiana Dunes National Park can rise nearly 200 feet above Lake Michigan, which is a useful reminder that “low shoreline” does not mean perfectly flat ground.
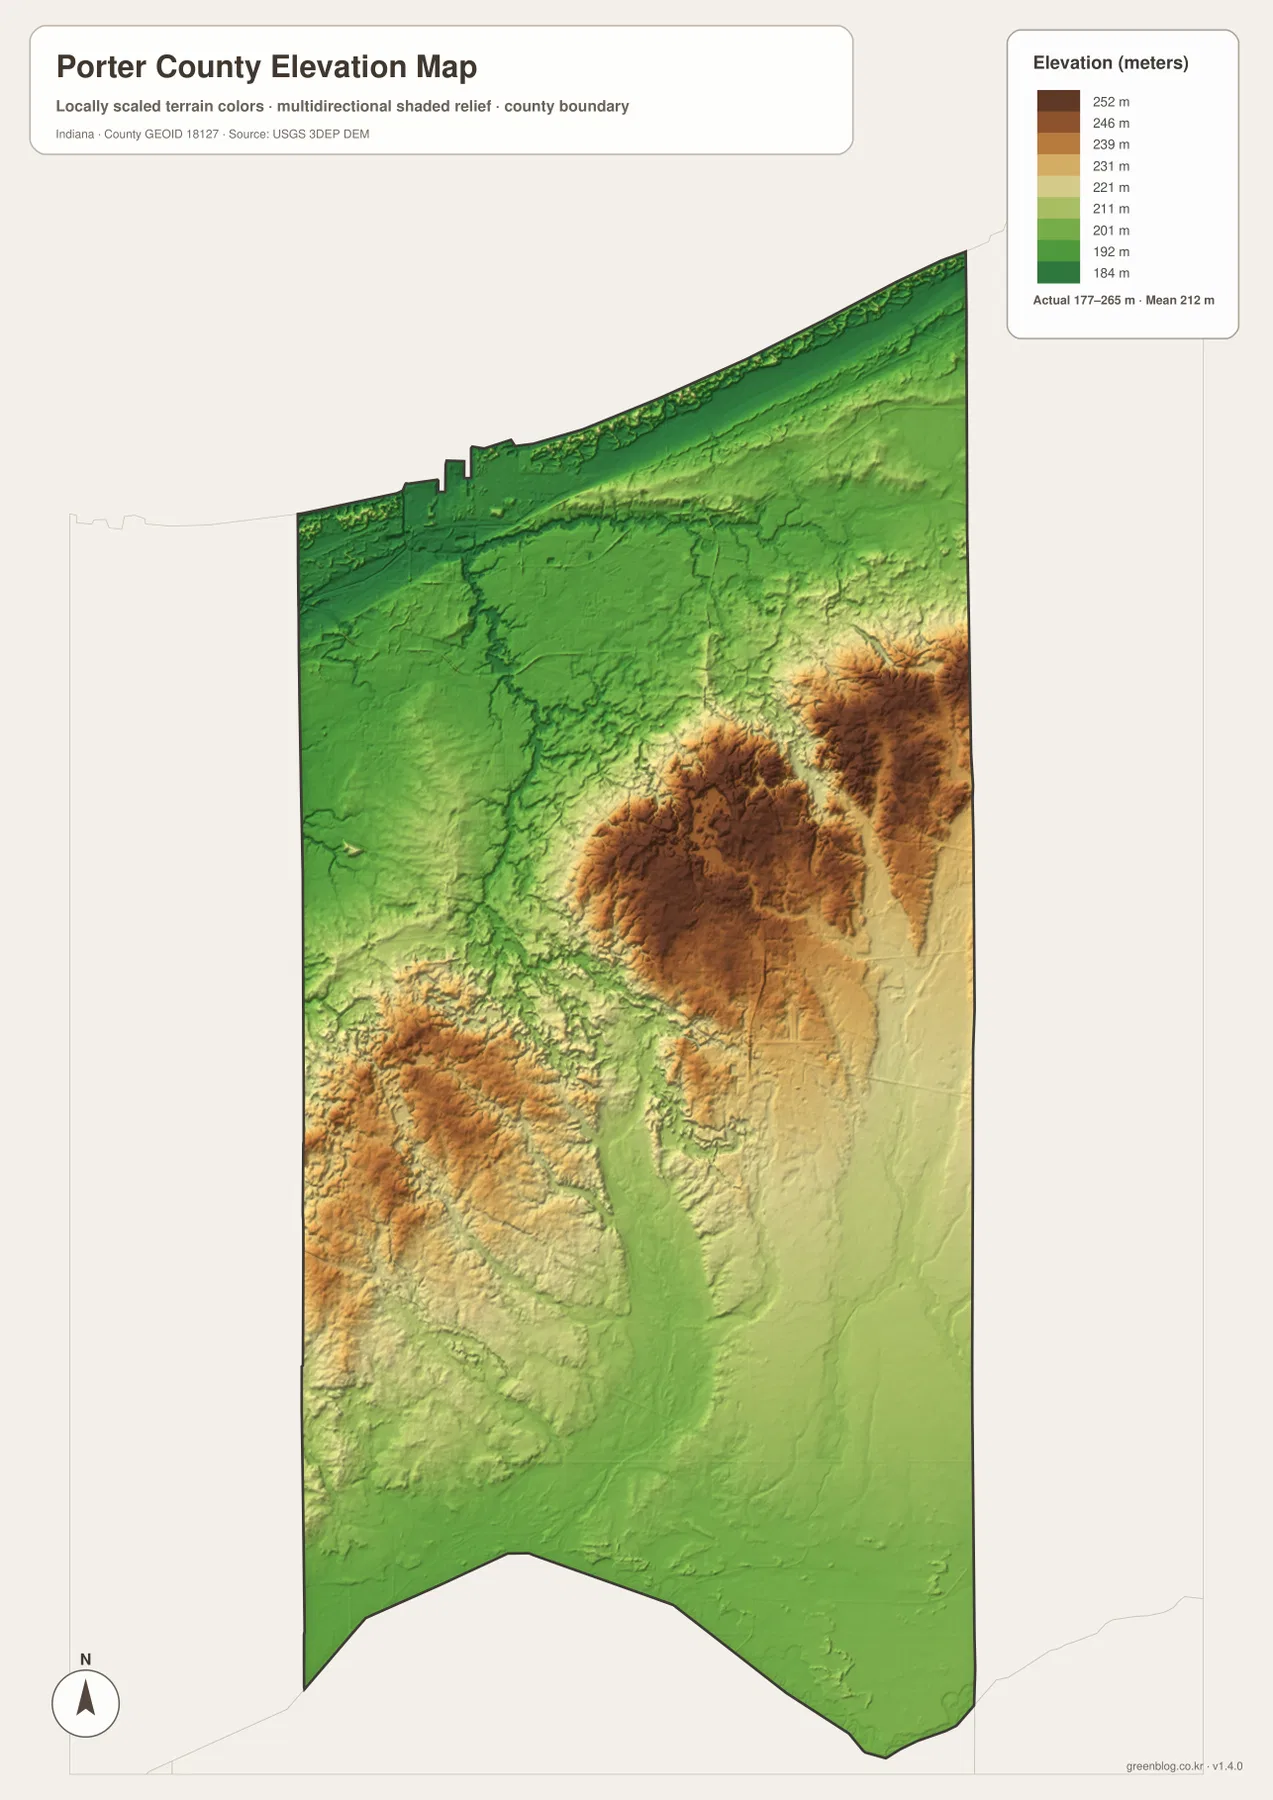
The broadest high terrain appears in the central and eastern interior, especially east and northeast of Valparaiso. Brown and tan colors spread across large hill masses there, while a smaller area of higher relief also appears west and southwest of the county center. This pattern matches Porter County’s official description of rolling moraine hills in the middle of the county. The hills are not a single ridge; they form an irregular zone of higher ground cut by creek valleys.
Farther south, the colors return to greens and lighter tones around Hebron, Kouts, and the Kankakee side. The overall sequence is therefore not a simple north-to-south slope. The map moves from low shoreline terrain into higher central hills and then down again toward the broad southern plain. That three-part pattern is one of the most useful geographic ideas to carry back to the road and water maps.
This elevation image is a regional reference rather than a site survey. It is appropriate for comparing parts of Porter County and seeing the shape of the hills, but it should not be used for parcel elevations, road grades, building design, or drainage engineering. USGS source elevation data or a qualified survey is the appropriate next step when precise measurements are required.
Choose the map by task, then compare the same landmarks across views
For road orientation, begin with the general county map. It is the best view for linking Portage, Chesterton, Valparaiso, Hebron, and Kouts through I-94, U.S. highways, and State Road 49. Use the city map when you want a less crowded picture of the six indexed settlements and their north-to-south spacing. The two views work especially well together because one provides route detail while the other reduces the county to a small set of settlement anchors.
For physical geography, start with Lake Michigan on the water map and then find Little Calumet River, Salt Creek, the central lakes, and Crooked Creek. Switch to the elevation map without changing your mental reference points. The low shoreline, central-eastern hills, and lower southern plain then become much easier to recognize. Repeating that comparison around Valparaiso is particularly useful because the city sits close to the transition between northern development and the rolling interior.
A simple four-step reading sequence works well: locate Portage and Valparaiso on the general map; compare the six highlighted settlements on the city map; trace Lake Michigan and the main creeks on the water map; then check how the same areas change in elevation. This method keeps the maps connected to real places rather than treating each image as an isolated layer. For print or detailed viewing, use the high-resolution JPG files in the download archive rather than the reduced WebP previews.
Frequently Asked Questions
Where is the county seat of Porter County?
Valparaiso is the county seat. On the general map it lies near U.S. 30 and State Road 49 in the central part of Porter County, which makes it a practical reference between the Lake Michigan communities in the north and Hebron and Kouts in the south.
Which water features are easiest to recognize on the map?
Lake Michigan is the dominant feature along the northern edge. The dedicated water map also labels Little Calumet River, Salt Creek, Coffee Creek, Sand Creek, Crooked Creek, and several central lakes including Flint, Loomis, Mink, and Silver. Kankakee River is the major southern reference. For flood or legal boundary questions, use current official data rather than this county overview.
What does the 177–265 m elevation range show?
It shows the county-wide contrast between the lower Lake Michigan side, the higher central and eastern moraine hills, and the lower southern plain. The highest broad areas on the supplied map appear east and northeast of Valparaiso. The range is useful for regional comparison but not for exact parcel or construction elevations.
Map File Information
The Porter County ZIP contains the high-resolution JPG originals for the general county map, city map, water map, and elevation map. Use the larger files when road shields, place labels, waterways, or relief colors need to remain readable in print or at high zoom.
- Printable Size: 2572×3638 px each
Related Maps
Sources and References
The supplied Porter County maps are the main visual reference. The following official sources provide additional context for the county landscape, Indiana Dunes environment, boundaries, hydrography, and elevation.
- Porter County Government – Economic Development – official description of the Lake Michigan shore, central moraine hills, southern agricultural plain, and Valparaiso county seat
- National Park Service – Indiana Dunes National Park Nature – official background on Lake Michigan shoreline, dunes, wetlands, rivers, and related habitats
- U.S. Census Bureau TIGER/Line Shapefiles – boundary, road, and place-reference data
- USGS National Hydrography – official reference data for rivers, creeks, lakes, and other mapped water features
- USGS 3D Elevation Program – source elevation data for work requiring more detail than the county-scale relief image
Green Map creates custom-edited map images using open geographic data sources such as geoBoundaries, Natural Earth, OpenStreetMap, and government open data.
These maps are edited visual materials, not raw data files, and are provided for education, documents, presentations, and graphic reference.