The Netherlands recorded 166,588 live births in 2025, and the sum of the 12 provincial observations is exactly the same. Zuid-Holland accounts for the largest number, with 37,338 births, followed by Noord-Holland at 27,826, Noord-Brabant at 24,049, and Gelderland at 19,726. Those totals show where births were recorded by the parents’ place of residence, but they should not be read as a fertility ranking. Provinces with more residents can have more births even when their birth rate is not the highest.
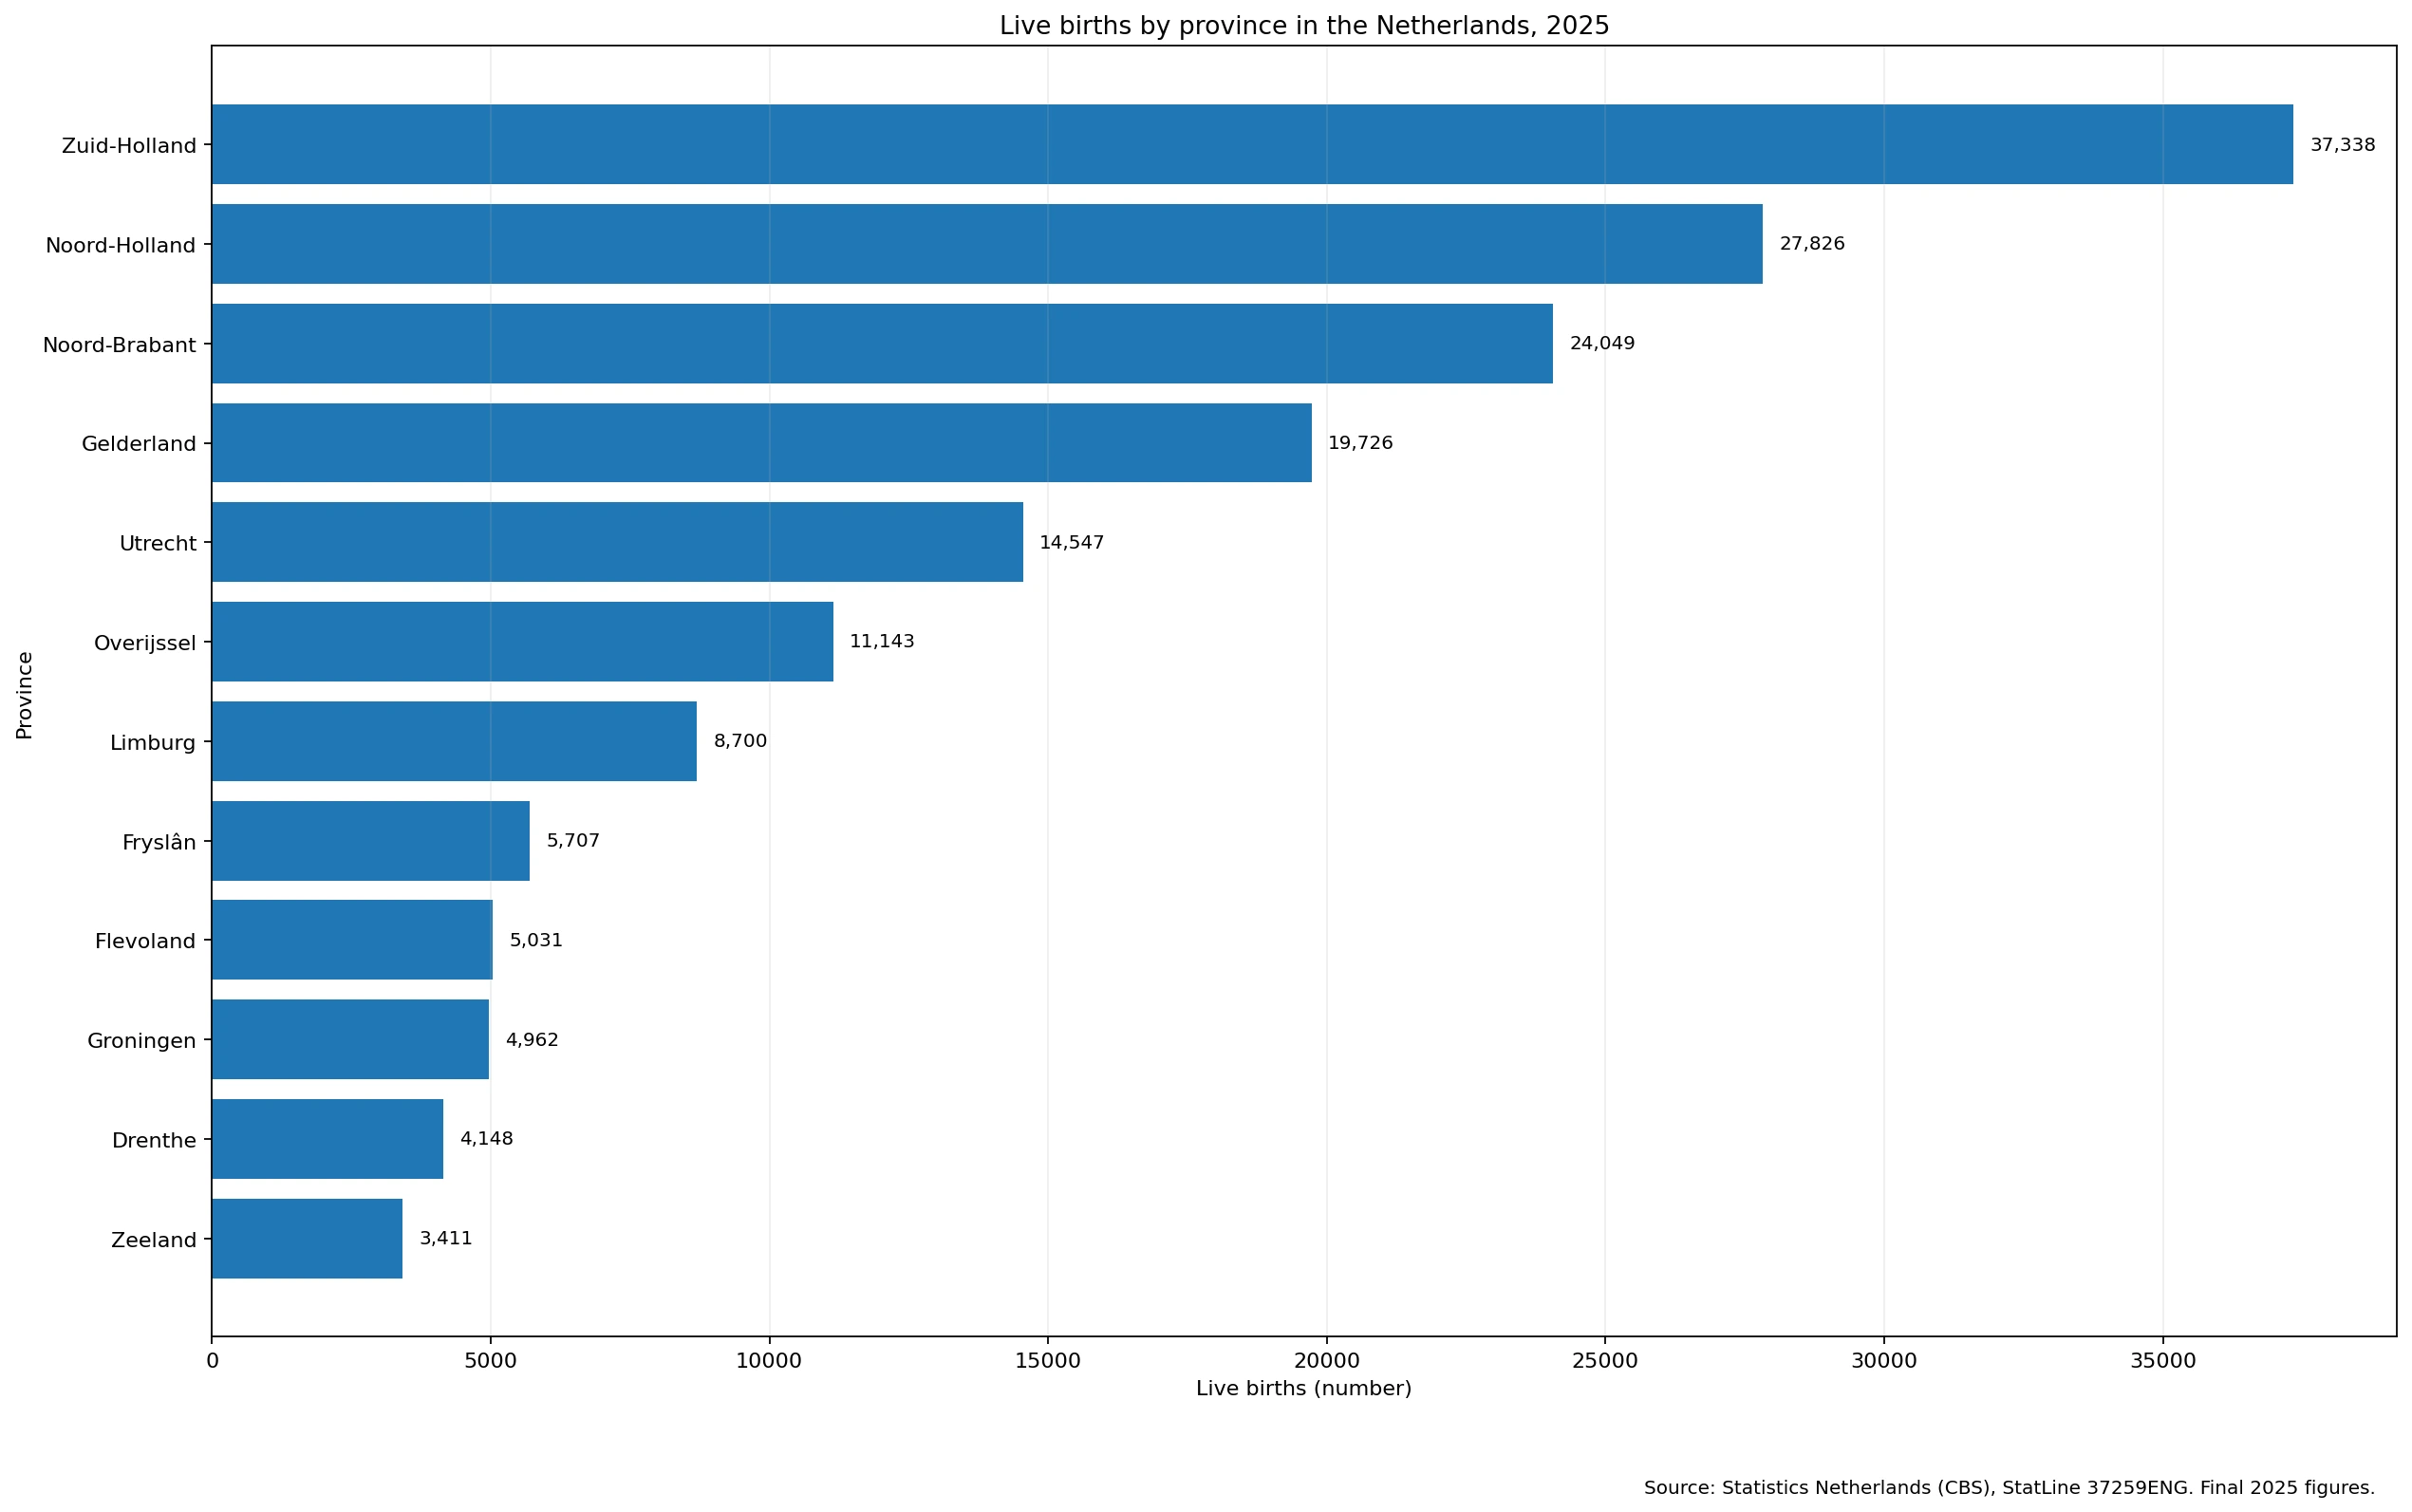
Table of Contents
All 12 provincial counts add to the national total of 166,588
The province rows form a complete national partition for this comparison. Adding Groningen, Fryslân, Drenthe, Overijssel, Flevoland, Gelderland, Utrecht, Noord-Holland, Zuid-Holland, Zeeland, Noord-Brabant, and Limburg gives 166,588 births, matching the Netherlands total published in the same CBS table. This makes it possible to calculate each province’s share of national births without mixing in regional aggregates or municipal rows.
CBS defines a live born child as a baby showing some sign of life after birth, regardless of the duration of pregnancy. The regional assignment is based on the municipality of residence of the baby’s mother, or occasionally the father, rather than necessarily the municipality where the delivery took place. A province with a major hospital therefore does not automatically receive births from patients who live elsewhere.
The 2025 figures are final data. CBS added the final 2025 observations to the table on 10 July 2026. Every provincial value used here refers to the same year and the same province level, so there is no mixed-year problem in the ranking or share calculations.
Zuid-Holland alone represents 22.41% of national births
Zuid-Holland’s 37,338 births make up 22.41% of the national total. Noord-Holland contributes another 16.70%, so the two western provinces together account for 39.12%. Adding Noord-Brabant and Gelderland raises the combined share of the four largest provincial counts to 65.39%. In other words, nearly two-thirds of all recorded births fall in four provinces.
The concentration continues when Utrecht and Overijssel are added: the six largest provincial counts represent 80.82% of all births. At the other end, Zeeland records 3,411 births, Drenthe 4,148, Groningen 4,962, and Flevoland 5,031. These gaps are useful for describing the geography of the annual count, but they do not establish why families are distributed this way or whether one province has stronger fertility behavior than another.
Province-by-province figures
| Province | Live births, 2025 | Share of national births | Live births per 1,000 population |
|---|---|---|---|
| Zuid-Holland | 37,338 | 22.41% | 9.6 |
| Noord-Holland | 27,826 | 16.70% | 9.3 |
| Noord-Brabant | 24,049 | 14.44% | 9.0 |
| Gelderland | 19,726 | 11.84% | 9.1 |
| Utrecht | 14,547 | 8.73% | 10.3 |
| Overijssel | 11,143 | 6.69% | 9.3 |
| Limburg | 8,700 | 5.22% | 7.7 |
| Fryslân | 5,707 | 3.43% | 8.6 |
| Flevoland | 5,031 | 3.02% | 10.9 |
| Groningen | 4,962 | 2.98% | 8.2 |
| Drenthe | 4,148 | 2.49% | 8.2 |
| Zeeland | 3,411 | 2.05% | 8.7 |
The final column is the live-birth ratio published by CBS in the same StatLine table, measured per 1,000 of the average population. It changes the interpretation substantially. Zuid-Holland ranks first by total births but reports 9.6 births per 1,000. Flevoland, with only 5,031 births, has the highest provincial ratio at 10.9 per 1,000. Utrecht is second on the rate measure at 10.3.
The province with the most births is not the province with the highest birth ratio
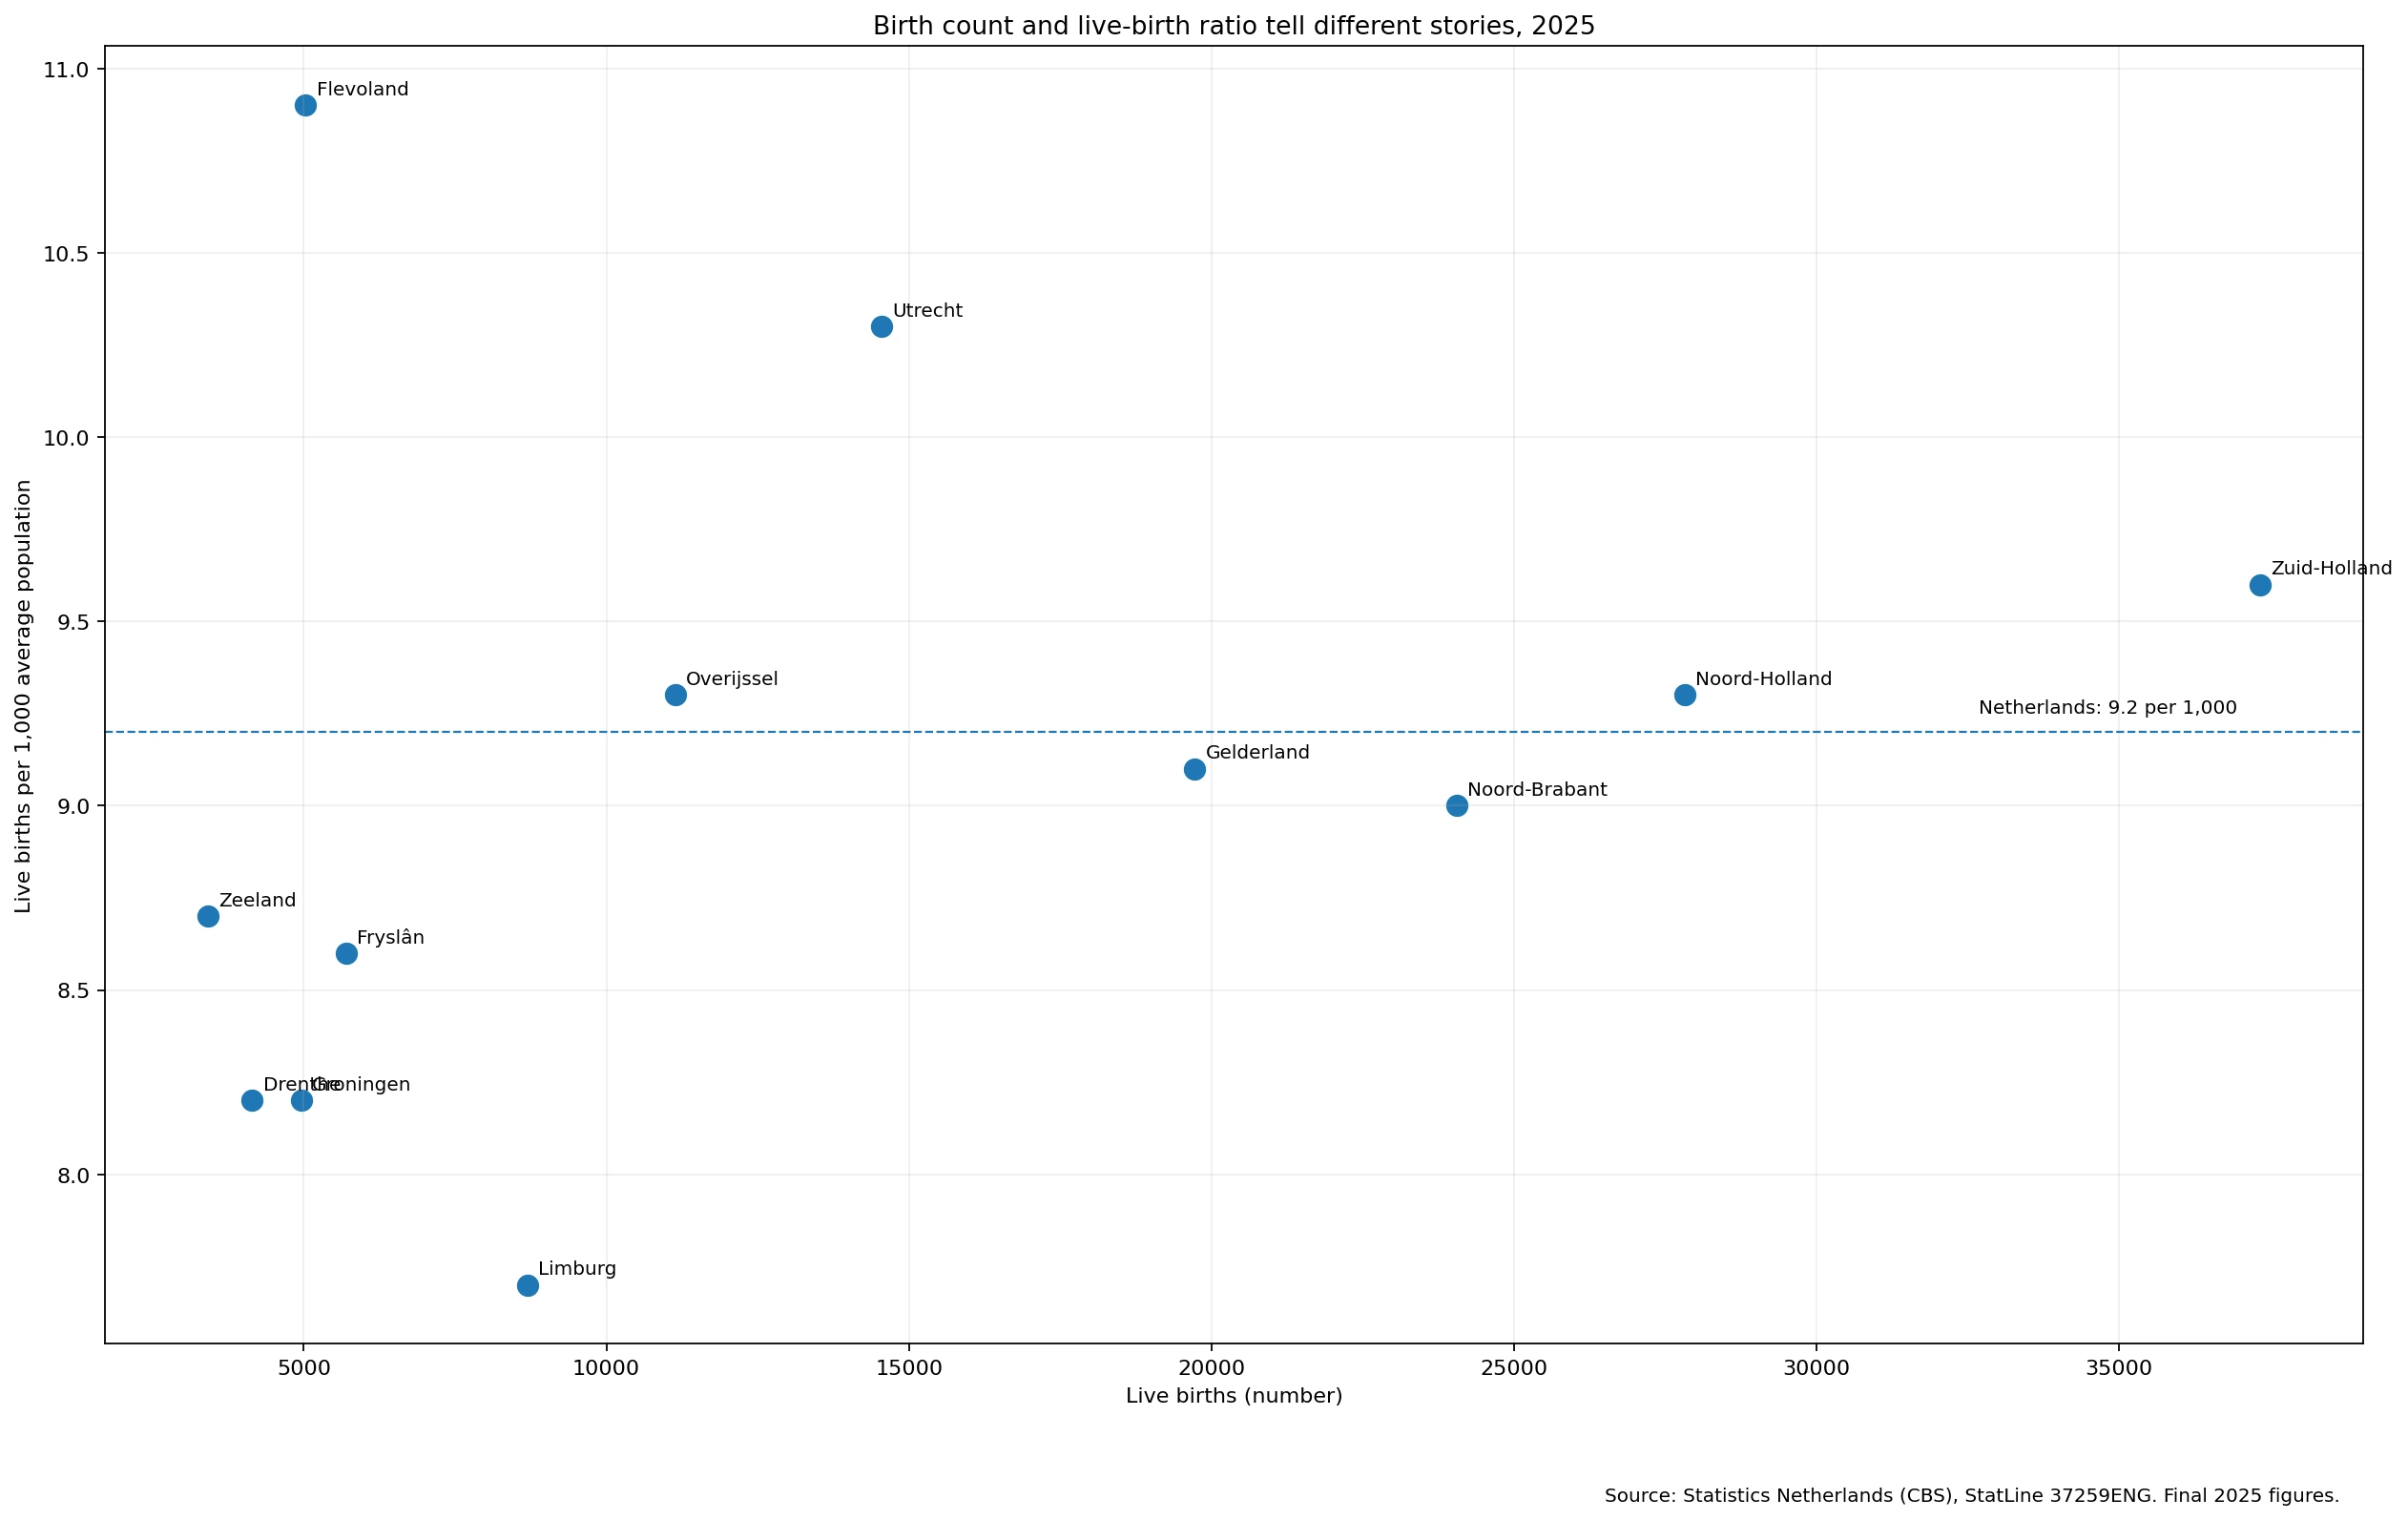
Flevoland and Utrecht stand out above the national rate line, while Limburg sits lowest at 7.7 births per 1,000. Groningen and Drenthe are both at 8.2, Fryslân at 8.6, Zeeland at 8.7, and Noord-Brabant at 9.0. Noord-Holland and Overijssel are each at 9.3, while Zuid-Holland is at 9.6. The national figure is 9.2.
This comparison is a direct illustration of denominator effects. Zuid-Holland has a much larger population base than Flevoland, so it produces far more births in absolute terms even though Flevoland has the higher birth ratio. When the question is “where were the most babies born?”, the count is appropriate. When the question is “where were births high relative to population?”, the ratio is more informative.
Birth count, crude birth rate, and total fertility rate are different measures
A live-birth count is simply the number of babies born during the year. The per-1,000 measure divides births by average population and is similar to a crude birth rate. Total fertility rate is a different demographic measure based on age-specific fertility rates and is designed to summarize the number of children a woman would have if current age-specific rates prevailed. None of these measures can be substituted for the others.
Population age structure matters for the crude rate as well. A province with a large share of people in childbearing ages can record a higher number of births per 1,000 total residents even if individual fertility behavior is not unusually high. A careful fertility comparison would therefore need age-specific birth data or an official total fertility rate series matched to the same geography and year.
What the provincial spread does—and does not—show
The gap between the largest and smallest birth counts is substantial: Zuid-Holland records about 10.9 times as many births as Zeeland. That difference is real, but it is a difference in annual headcounts. It does not measure housing affordability, childcare access, migration, marriage patterns, income, or policy effects. Those possible explanations would require additional data and a design capable of testing relationships rather than simply mapping outcomes.
Provincial totals also hide variation within each province. Amsterdam, Rotterdam, The Hague, Utrecht, and other urban centers have demographic structures that differ from surrounding suburban and rural municipalities. The CBS table contains more detailed regional levels, but a municipality-level analysis should be treated as a separate comparison with the same reference year and a consistent boundary classification.
Why a bar chart is the primary visual for this indicator
Absolute counts are often clearer in a bar chart than in a shaded area map. A choropleth would visually emphasize land area even though the statistic is not measured per square kilometer or as a rate. A length-based chart lets every province be compared on the same numerical scale. The second visual then pairs the count with the per-1,000 ratio to make clear that “large number of births” and “high relative birth level” are different concepts.
Source and calculation method
The source is Statistics Netherlands (CBS), StatLine table 37259ENG: Population dynamics; birth, death and migration per region. The comparison uses total male and female, reference year 2025, and the 12 province codes PV20 through PV31. Published birth counts are used without alteration. Provincial shares are calculated against the verified sum of 166,588 births, which equals the CBS national total.
The live-birth ratios per 1,000 are official CBS values based on average population. Summary statistics such as the median treat each province as one observation and are descriptive only; they are not population-weighted national rates. There are no missing provincial birth counts in the 2025 set, and no missing value is replaced with zero.
Frequently Asked Questions
Which Dutch province had the most live births in 2025?
Zuid-Holland had the largest count with 37,338 live births, followed by Noord-Holland with 27,826 and Noord-Brabant with 24,049.
Does the province with the most births also have the highest birth rate?
No. Zuid-Holland has the most births, but Flevoland has the highest CBS live-birth ratio at 10.9 per 1,000 average population. Absolute counts and population-relative rates answer different questions.
How many live births were recorded in the Netherlands in 2025?
CBS reports 166,588 live births in 2025. The sum of the 12 provincial observations used here is also 166,588.
Are births assigned to the province where the hospital is located?
Not necessarily. CBS records live births in the municipality of residence of the baby’s mother, or occasionally the father, so the statistical location can differ from the place of delivery.
Related Maps
Green Map creates custom-edited map images using open geographic data sources such as geoBoundaries, Natural Earth, OpenStreetMap, and government open data.
These maps are edited visual materials, not raw data files, and are provided for education, documents, presentations, and graphic reference.