Carroll County, Indiana is easiest to orient from Delphi, which sits west of the county’s geometric center near the broad Wabash River lowlands. From Delphi, State Road 25 angles northeast toward Rockfield and Burrows, US 421 heads south, and the road network opens eastward toward Camden, Flora, and Burlington. The maps on this page separate those layers so you can examine boundaries and roads, compare the main settlements, follow the Wabash and its tributaries, and see the county’s 113–253 m elevation range. The same map set is also available below as high-resolution JPG files in one downloadable ZIP.
The county is not a uniform flat surface. The elevation map shows a conspicuous low corridor along the Wabash River running diagonally across the northern half toward the Delphi area, while higher colors become more common across the south and southeast. Deer Creek, Wildcat Creek, and other streams cut lower ribbons through that higher ground. Reading the water and elevation maps together explains why Carroll County has a broad river valley in one part of the county and narrower creek valleys in another.
Settlement is spread in several directions rather than concentrated in one continuous urban area. The city-connections map uses Delphi as the hub and labels Camden and Yeoman at about 7 miles away, Flora at about 8 miles, and Burlington at about 16 miles. Those are straight-line distances, not driving distances, so they work best as a quick comparison of relative location. The sections below use those town positions, the road network, and the river valleys to build a county-specific picture rather than a generic map inventory.
Table of Contents
Delphi ties the western river country to the roads reaching east across the county
On the county overview, Delphi lies in the west-central part of Carroll County. Pittsburg appears just to the west, while Yeoman is farther north along the western side. To the northeast, Rockfield and Burrows line up along the corridor followed by State Road 25. Camden sits closer to the center of the county, Flora lies to its south, and Burlington occupies the southeastern side. That distribution makes Delphi a practical starting point, but it also shows why no single north-south or east-west line describes the entire county.
State Road 25 is one of the clearest routes on the map because it passes Delphi and continues northeast toward Rockfield and Burrows. US 421 heads south from the Delphi area, while roads around Camden and Flora form a more regular grid across the eastern half. Near Flora, east-west and north-south routes cross close to the town, and the road system continues toward Burlington and the eastern boundary. The contrast is useful: the eastern and southern road pattern looks straighter, while the Delphi and river-side area bends more around water and the county’s irregular western edge.
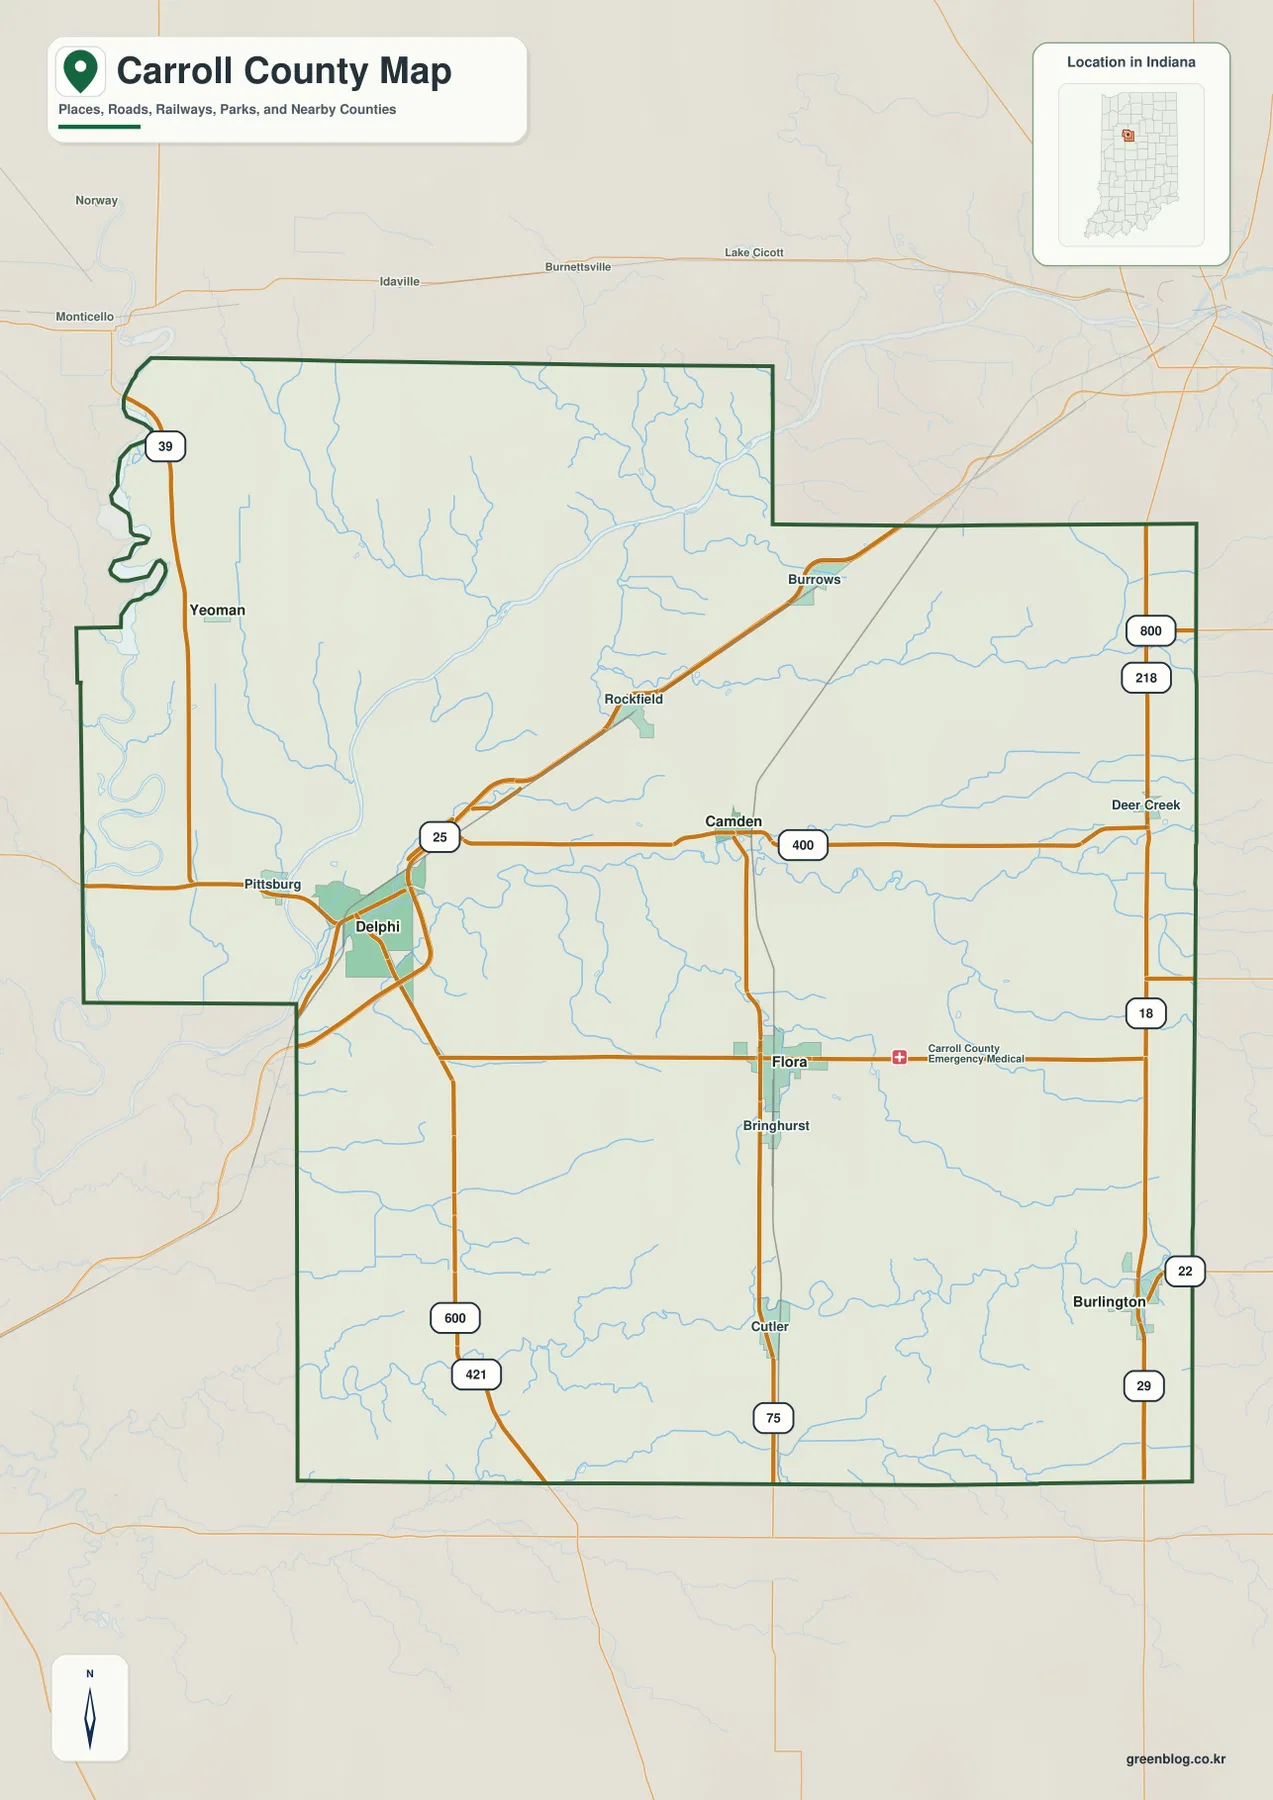
The boundary itself adds another layer. Northern Carroll County extends broadly east and west, while the southern portion begins after an inward step in the boundary south of Delphi. The western side includes curved sections near the major rivers, unlike the straighter eastern and southern lines. On a small screen that shape can make the county look slightly disconnected at first glance. Finding Delphi, then tracing SR 25 northeast and US 421 south, provides a simple framework for understanding both halves.
Four settlements sit 7 to 16 straight-line miles from the Delphi hub
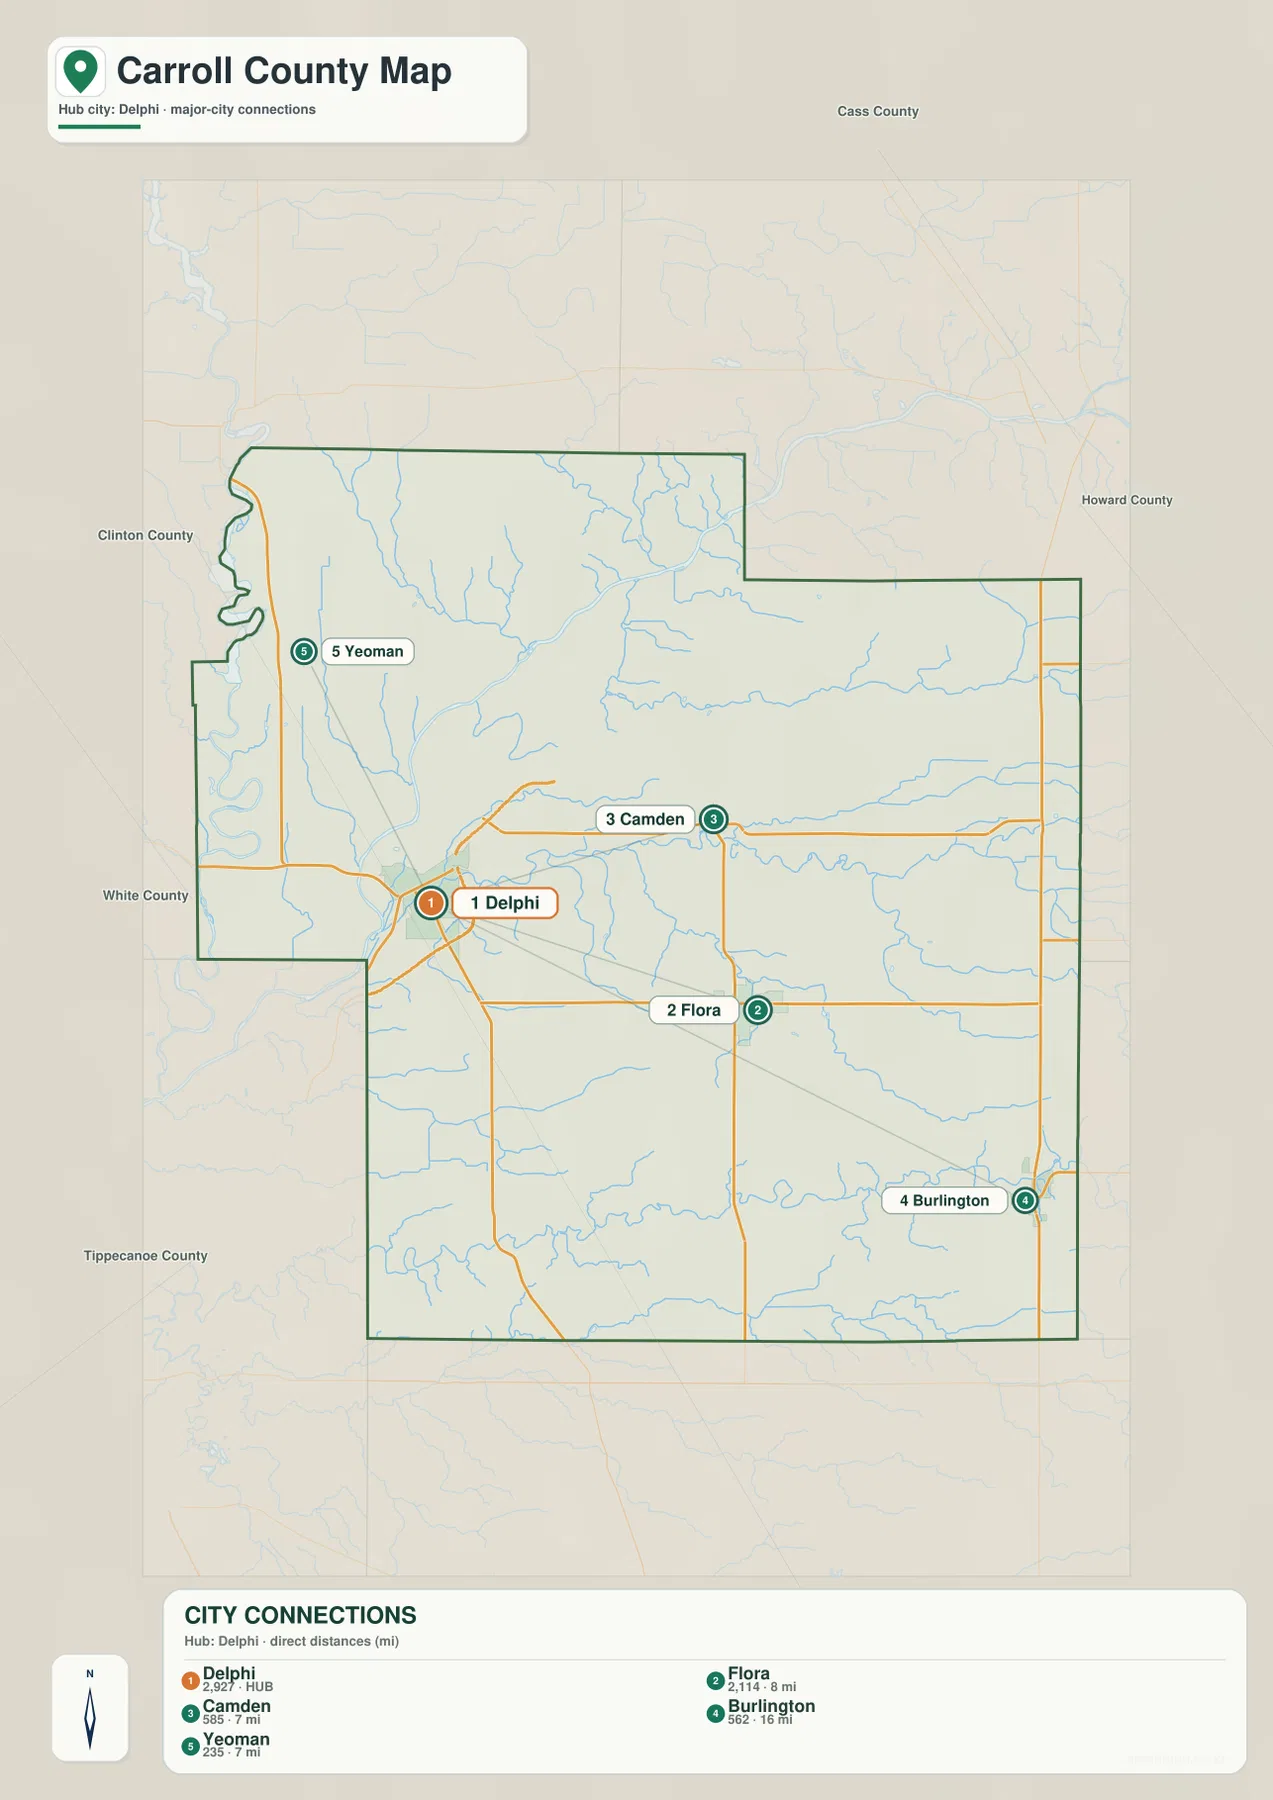
The city-connections view strips away much of the road detail and makes the settlement pattern clearer. Camden is northeast of Delphi and is labeled at roughly 7 miles in direct distance. Flora is southeast at about 8 miles, while Yeoman is about 7 miles away in the opposite, northwestern direction. Burlington is the outlier in this group, positioned near the southeastern side of the county at about 16 direct miles from Delphi.
These connector values should not be read as route mileage. A road trip between Delphi and Burlington, for example, must follow the actual road network rather than the straight line drawn on the city map, so the driven distance can be longer. The value of this map is comparison: Camden, Flora, and Yeoman cluster much closer to Delphi, while Burlington is noticeably farther out. The surrounding labels for White, Clinton, Tippecanoe, Cass, and Howard counties also help place Carroll County within north-central Indiana without crowding the page with local road names.
Carroll County’s community information page identifies Delphi as the county seat and the county’s only incorporated city. That fits the role it plays on these maps: Delphi is the easiest local reference point, but the county’s geography extends well beyond it. Flora and Camden are essential for understanding the eastern road grid, Burlington anchors the southeast, and Yeoman helps define the northwest. Using the settlement map before the more detailed county map can make those relationships easier to remember.
The Wabash and Tippecanoe form the broad river setting; Deer Creek and Wildcat Creek divide the interior
The water-and-terrain map is dominated by the Wabash River. It crosses the northern half of Carroll County on a broad diagonal and reaches the western side near the Delphi-Pittsburg area. The Tippecanoe River approaches from the west and southwest, creating another major water corridor near the county’s western side. Smaller tributaries such as Rattlesnake Creek descend toward this larger river system, producing a much broader lowland than the narrow stream valleys found farther east and south.
Across the interior, the named streams form several distinct bands. Rock Creek runs through the northeastern part of the county. Deer Creek crosses the central-eastern area, with Paint Creek and Little Deer Creek nearby. Bachelor Run extends through the south-central area, while Wildcat Creek becomes a major feature farther south. Near the bottom edge, Middle Fork Wildcat Creek creates another east-west valley. Sugar Creek is also labeled in the southwest. Together these names show that Carroll County drains through more than one obvious river corridor.
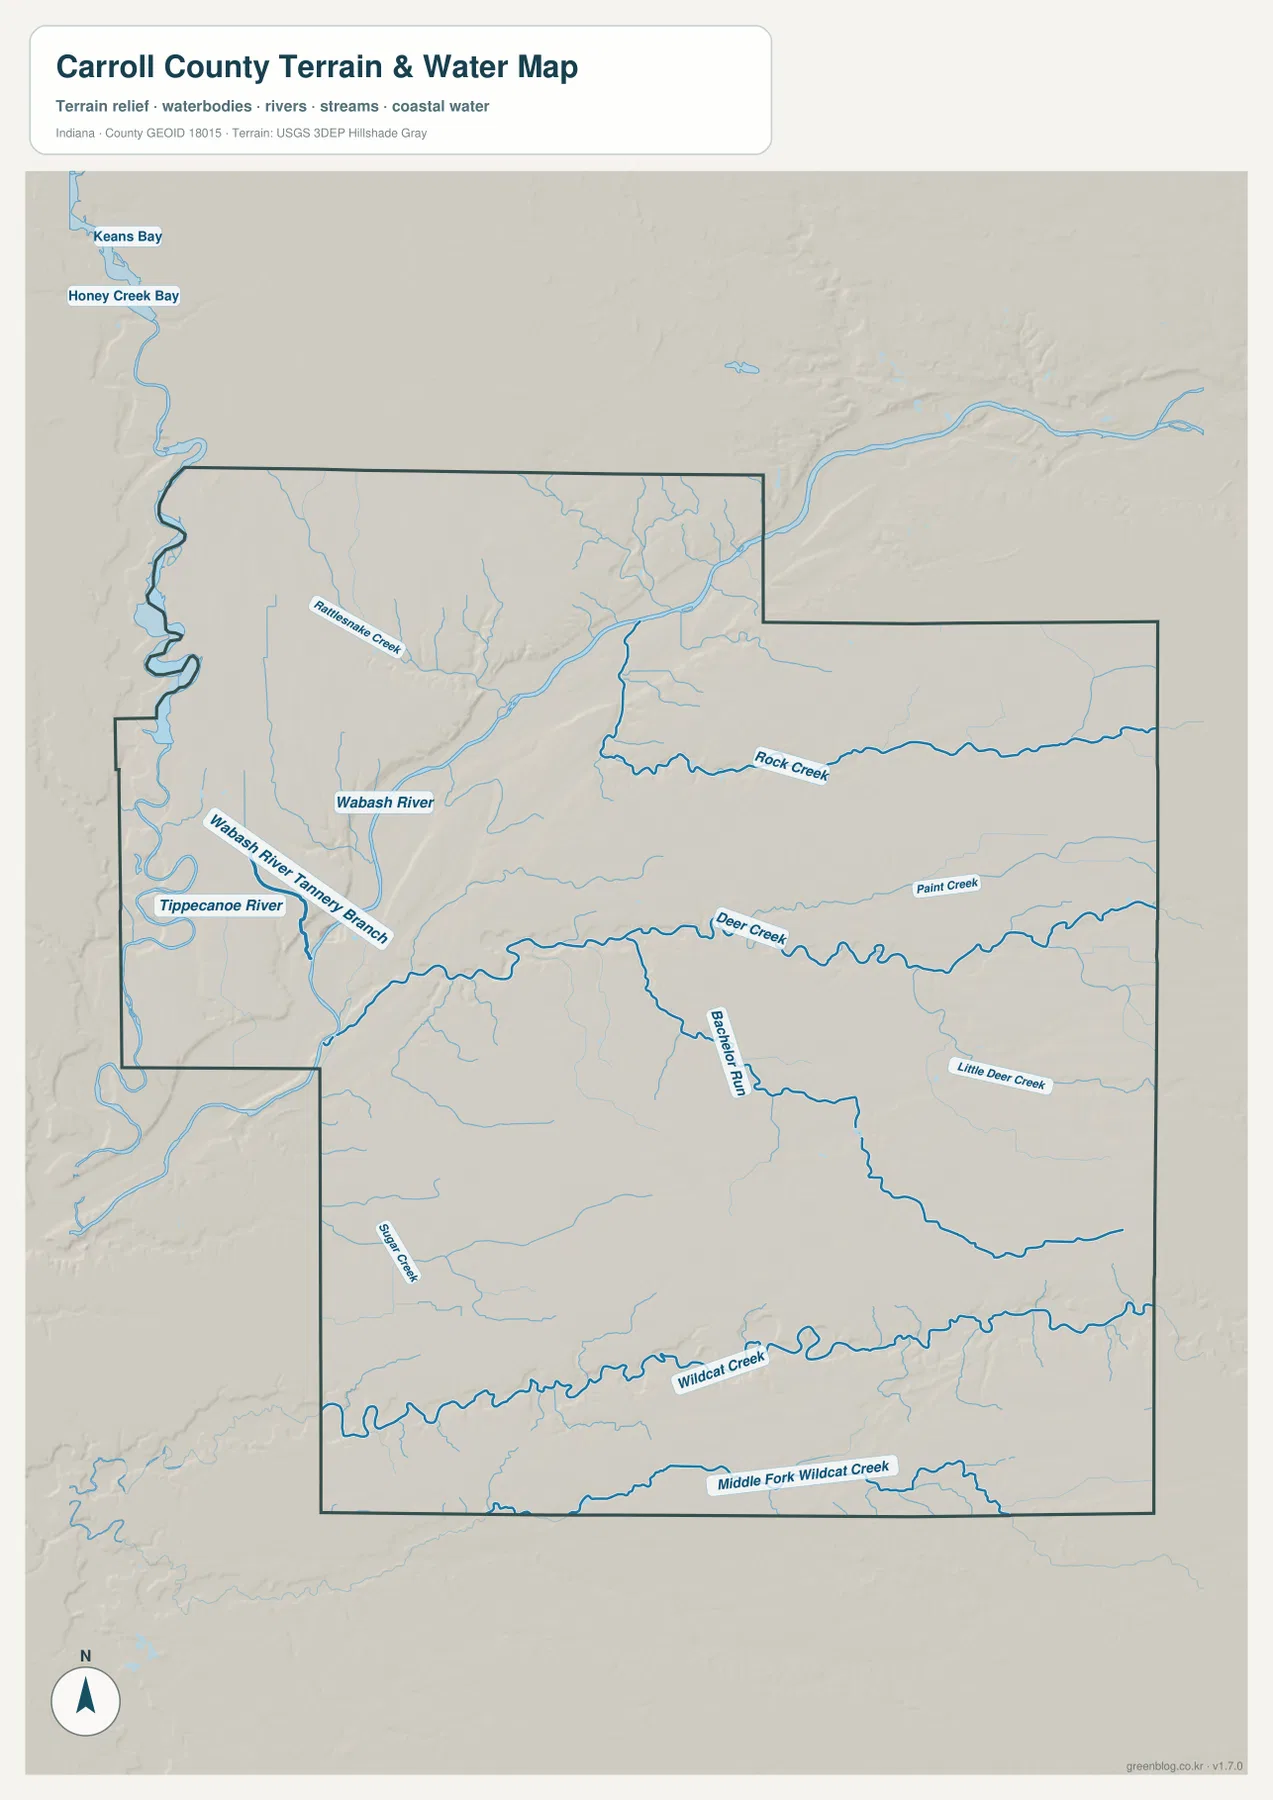
This is a reference map for water locations and terrain relationships, not a flood, parcel, legal-boundary, or navigation product. A blue line identifies a mapped watercourse; it does not mean that every nearby property is in a flood zone, and it does not provide water depth, current speed, or boating conditions. For practical use, start with the Wabash River and Tippecanoe River to understand the broad western lowlands, then follow Deer Creek and Wildcat Creek to see how smaller valleys cross the rest of the county.
The 113–253 m elevation range is most visible between the Wabash valley and the higher south
The elevation map reports an actual range of about 113 to 253 meters and a county mean near 209 meters. Greens mark relatively lower land, while yellow, tan, and brown represent higher ground. The strongest low corridor follows the Wabash River diagonally from the northeast toward Delphi and the western side. Lower colors also appear along the Tippecanoe River. Because these river valleys are broad, they are easy to match with the water map even when no river labels are present on the elevation view.
Higher terrain becomes more extensive toward the south and southeast. Brown and darker tan cover large areas there, especially close to the southern boundary. Even so, the south is not a single unbroken upland. Wildcat Creek and Middle Fork Wildcat Creek carve narrow green valleys through the higher colors, and Deer Creek creates another lower band across the middle of the county. The result is a layered pattern: a broad Wabash lowland in the northwestern half, higher ground to the south and east, and smaller creek valleys cutting back through it.
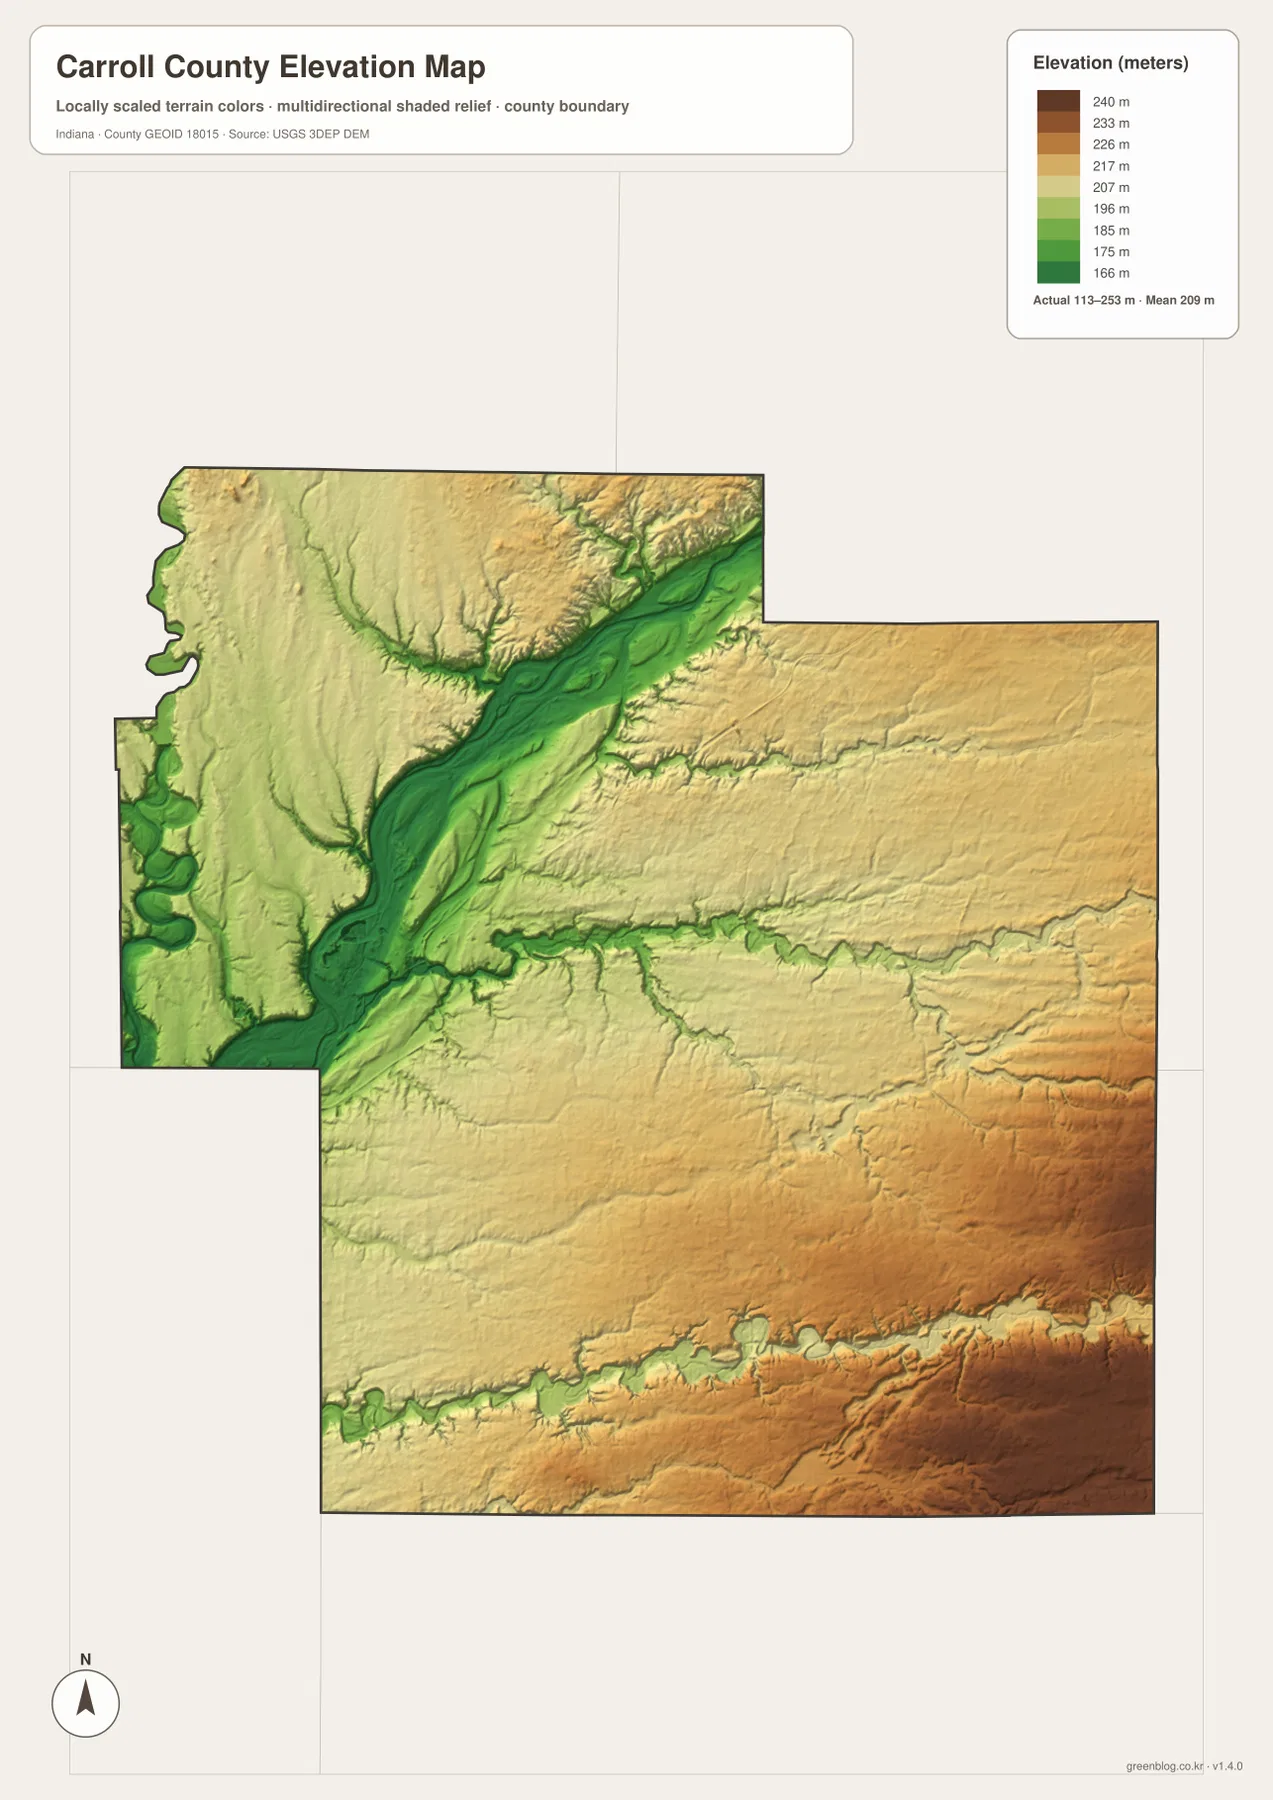
The colors are locally scaled to show relief within Carroll County. They should not be treated as survey measurements for a specific parcel or compared by color alone with another county map. If a project requires exact site elevation for construction, drainage design, or engineering, use the appropriate official elevation dataset or a field survey. Here the map is best used to explain county-scale differences, such as why the Wabash corridor is visibly lower than much of the southern terrain.
Delphi’s river location also explains why canal history is part of the local landscape
Modern roads are only one part of Delphi’s geographic story. Carroll County’s community information notes that the Wabash River and Deer Creek pass through Delphi. The county’s parks information also describes Wabash & Erie Canal Park as a local effort to preserve canal heritage, including an accessible section of the old canal that still holds water. That background does not turn the maps on this page into historical canal maps, but it helps explain why the river corridor around Delphi has long been an important transportation setting.
Carroll County’s history page says the Wabash & Erie Canal was a major construction project through the county around 1840. That makes the west-central river corridor especially useful when connecting modern geography with older transportation history. On the overview map, Delphi and Pittsburg sit close to the broad Wabash environment shown more clearly on the water and elevation maps. For the exact historic canal route or present-day visitor access, use dedicated local historical and park information rather than inferring the route from these county-wide images.
Start at Delphi, then compare the Wabash lowland with the Wildcat Creek valleys
If you are opening Carroll County for the first time, the overview map is the most efficient starting point. Locate Delphi, then trace SR 25 northeast and US 421 south. Camden and Flora give the eastern half clear reference points, while Burlington marks the southeast and Yeoman marks the northwest. If the goal is to compare settlement spacing rather than road detail, switch to the city-connections map and use the straight-line distances from Delphi.
For rivers and creeks, the terrain-and-water map carries much more information. Find the Wabash and Tippecanoe first, then move to Deer Creek, Rock Creek, and Wildcat Creek. When relief matters, compare those same corridors with the elevation view. The broad Wabash lowland becomes a deep green diagonal band, while higher southern terrain turns tan and brown and is cut by the green Wildcat Creek valleys. Moving between these two maps makes the relationship between water and elevation especially clear.
The WebP images in the article are reduced for comfortable web viewing. For larger labels, closer inspection, or printing, use the high-resolution JPG archive below. The ZIP contains separate county overview, city-connections, terrain-and-water, and elevation maps. Each JPG is 2572 × 3638 pixels, so you can open only the layer that fits the task instead of working from a combined image.
Carroll County’s river lines and elevation colors are reference layers, not legal boundaries
The four views separate information that would otherwise compete for space on one page. The overview keeps roads, settlements, and the county outline together; the city-connections view pares that down to settlement location and straight-line distance from Delphi. Rivers and creeks become the focus on the terrain-and-water map, while the elevation view highlights the Wabash lowland and the higher south with a local color scale. If a feature disappears when you switch maps, it may simply belong to another layer rather than being absent from Carroll County.
Do not use the curved western boundary or river lines as substitutes for a legal parcel map, and do not infer flood risk from the blue waterways alone. The elevation surface is also generalized and is not a survey-grade measurement for a building site. For legal boundaries, flood insurance decisions, or engineering work, consult the agency responsible for that specific dataset. The sources below provide county information, local canal context, Census boundary resources, USGS hydrography, and USGS elevation data.
Frequently Asked Questions
Are the 7, 8, and 16 mile city-connection labels driving distances from Delphi?
No. The city-connections map uses straight-line distance. Camden and Yeoman are shown at about 7 direct miles from Delphi, Flora at about 8 miles, and Burlington at about 16 miles. Actual driving routes follow the road network and may be longer. Use those labels to compare relative spacing and direction, not to estimate trip mileage.
Which map is best for seeing the Wabash River, Tippecanoe River, and Wildcat Creek together?
The terrain-and-water map is the best choice. It shows the Wabash and Tippecanoe river corridors as well as Deer Creek, Rock Creek, Wildcat Creek, Middle Fork Wildcat Creek, and several smaller tributaries. It is intended for geographic reference only, so use a dedicated flood or navigation source if you need hazard zones, water depth, or boating information.
Where does the strongest elevation contrast appear in Carroll County?
The most obvious contrast is between the low Wabash River valley and the higher southern and southeastern parts of the county. The map reports an overall range of about 113–253 meters. Wildcat Creek and Middle Fork Wildcat Creek cut lower green valleys through the southern high ground, so the terrain is more varied than a simple north-to-south slope.
Map File Information
Download the Carroll County maps shown on this page as a high-resolution JPG set for closer reading or printing.
- Included Files: county overview map, city-connections map, terrain-and-water map, elevation map
- Printable Size: 2572 × 3638 px for each map
- File Type: ZIP containing 4 JPG files
Related Maps
Sources and References
- Carroll County, Indiana Communities — local information for Delphi, Flora, Yeoman, and other communities
- Carroll County Parks — Wabash & Erie Canal Park and Wabash River recreation context
- Carroll County History — local canal history and the county’s major waterways
- U.S. Census Bureau TIGER/Line Shapefiles — county boundaries, roads, and place data
- USGS National Hydrography — rivers, creeks, and other hydrography data
- USGS 3D Elevation Program — elevation and terrain data
Green Map creates custom-edited map images using open geographic data sources such as geoBoundaries, Natural Earth, OpenStreetMap, and government open data.
These maps are edited visual materials, not raw data files, and are provided for education, documents, presentations, and graphic reference.