Irwin County is a strongly agricultural landscape in south Georgia, but the 2025 surface pattern is more varied than a single farm belt. Agriculture accounts for 45.76% of the supplied land-cover summary, while wetlands cover 23.34% and forest 18.11%. Developed land is concentrated in a compact central cluster and along thin road-like traces rather than spread evenly across the county. This Irwin County Georgia Land Cover Map makes those contrasts visible without reducing the county to one dominant color.
The page includes four views: current land cover, forest and farmland, impervious surface and developed land, and a 1985–2025 class comparison. The four original JPG maps are available together in one ZIP after the map explanations. They are useful when a lesson, county profile, presentation, or environmental discussion needs a countywide picture of fields, wooded areas, wet ground, and the small built center around Ocilla.
Table of Contents
Agriculture leads the 2025 cover, but wetlands break up the farm pattern
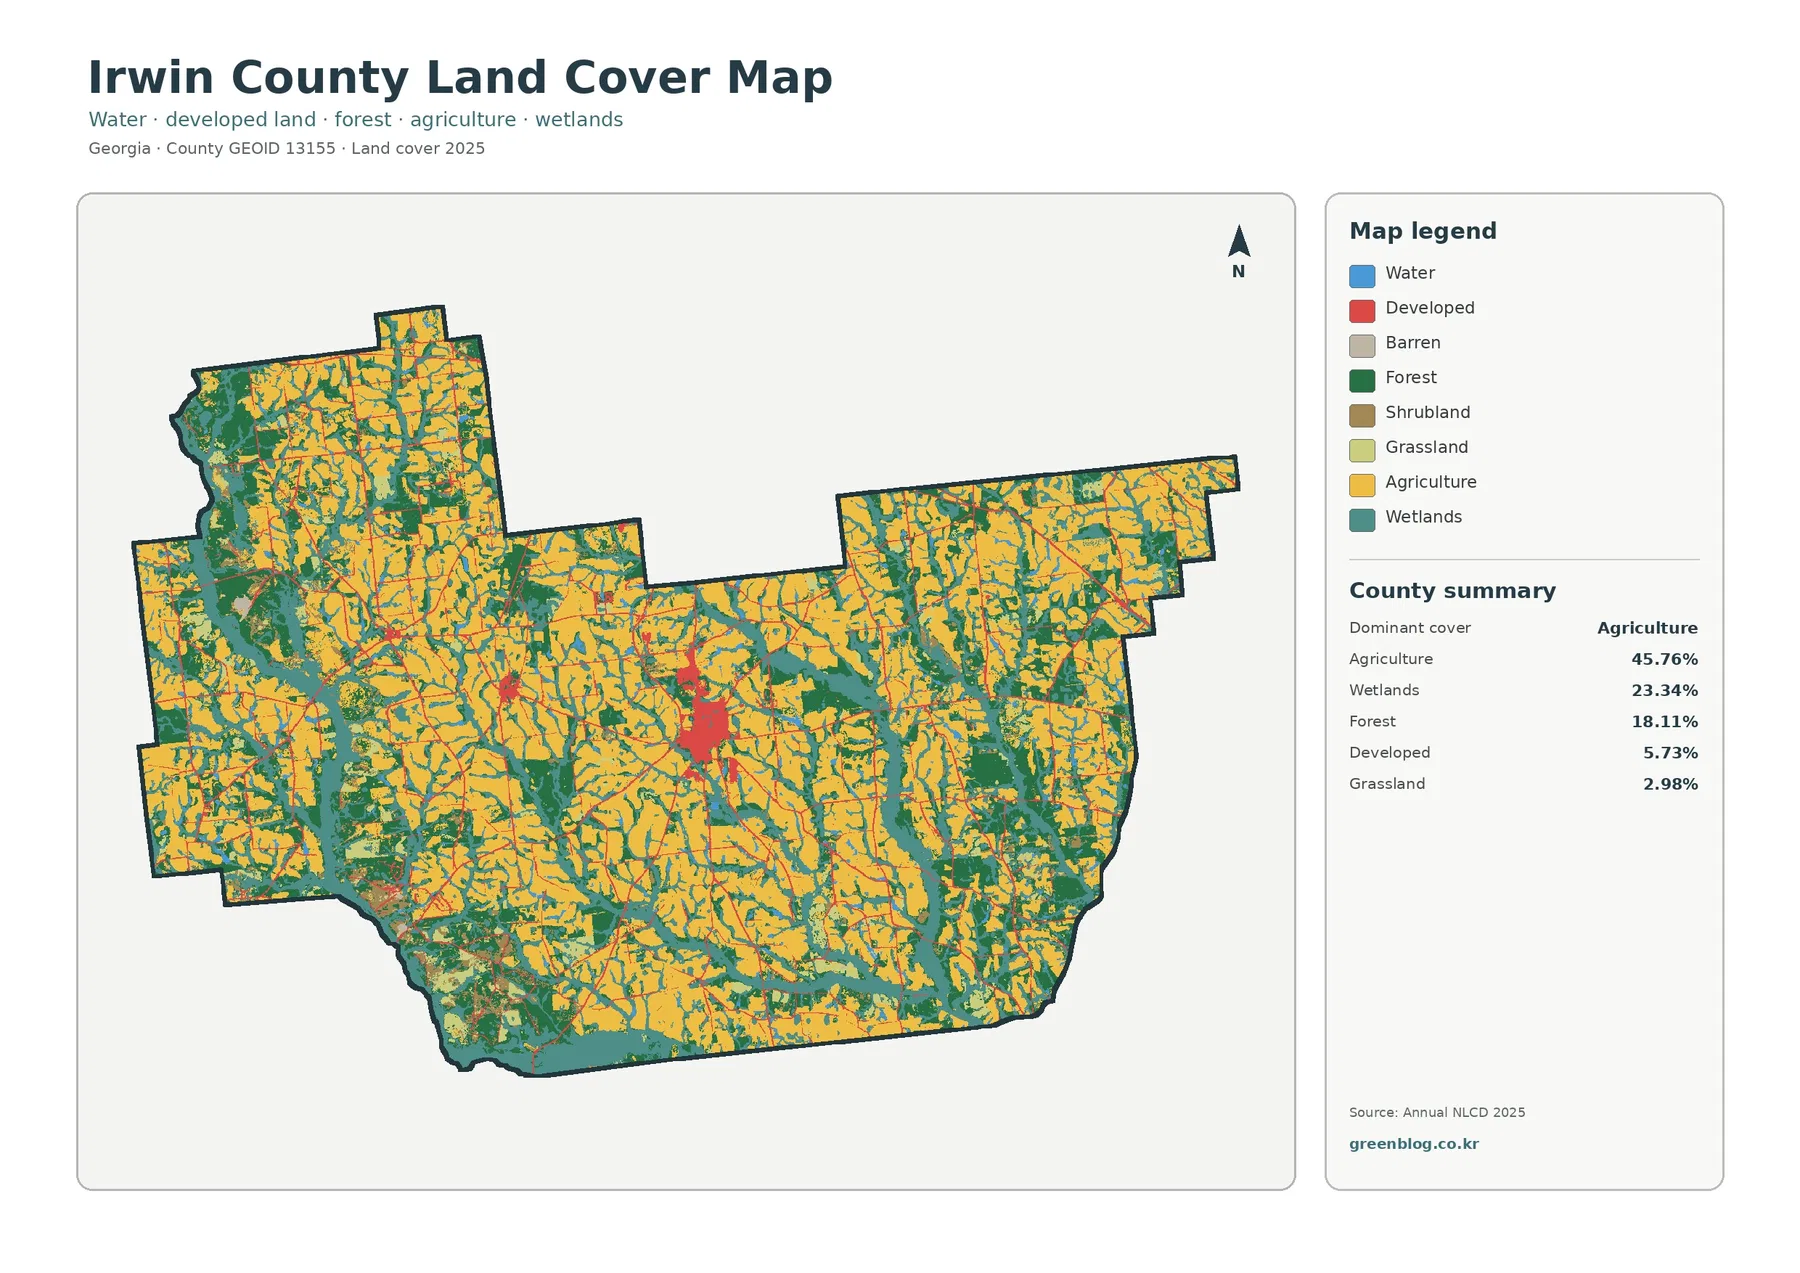
The yellow agriculture class covers broad portions of the north, center, east, west, and south, which fits its 45.76% share of the county summary. Yet the yellow areas rarely form one uninterrupted sheet. Teal wetland bands and dark-green forest patches cut through the fields in many places. The result is a farm-dominant county made of many adjoining pieces rather than one continuous block of cropland.
Wetlands are the second-largest mapped class at 23.34%. Their shape is as important as their percentage. Instead of appearing mainly as isolated compact patches, teal cover often follows long, bending and branching paths. Wider concentrations are visible along parts of the western edge, across the south, and in several eastern areas. These shapes explain why a county with extensive agriculture can still contain a large wetland share woven through the working landscape.
A closer vegetation view reveals how fields meet wooded and wet ground
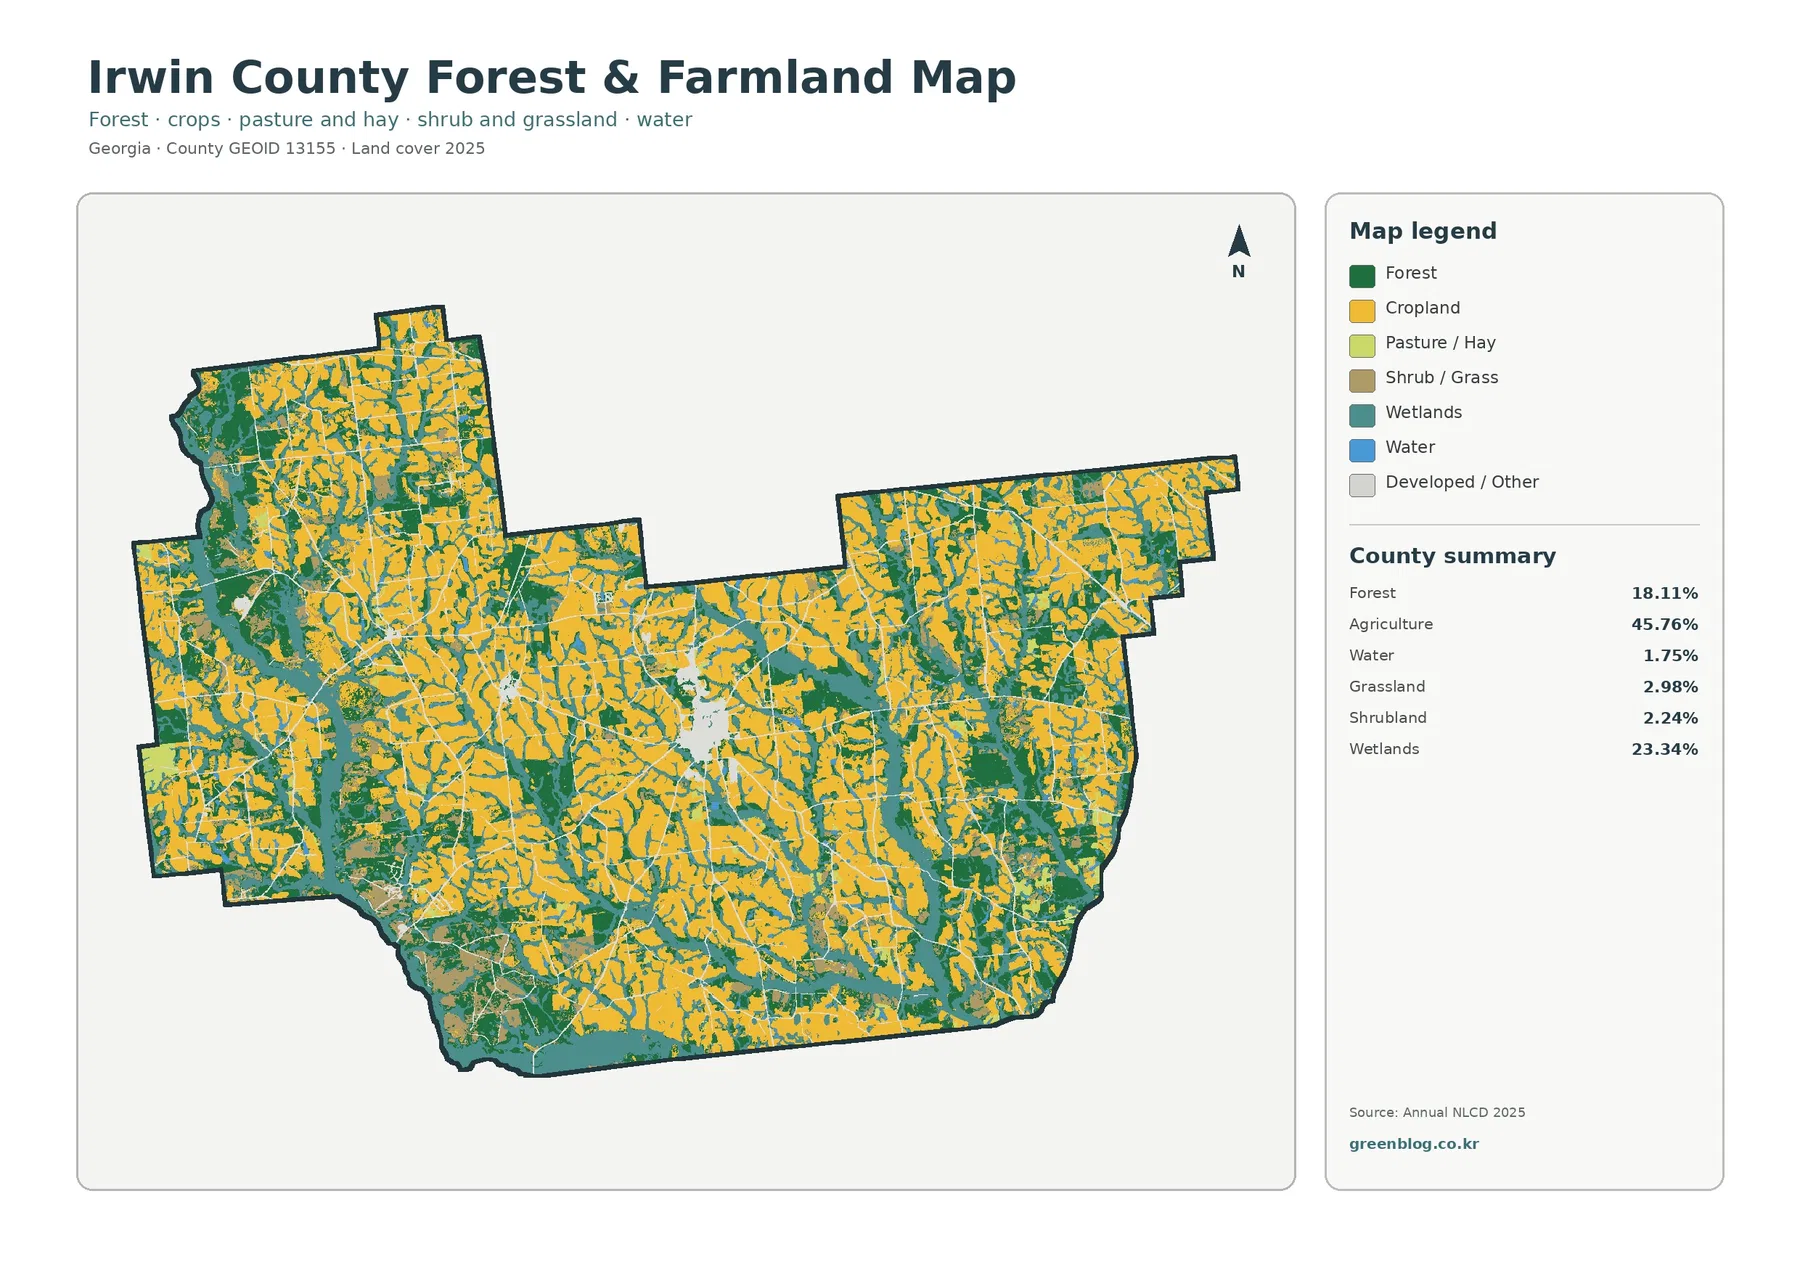
Removing much of the visual emphasis from developed and other cover makes the agricultural mosaic easier to inspect. Agriculture still dominates at 45.76%, but 23.34% wetlands form a branching network through many farm areas, while 18.11% forest fills larger blocks and narrower edges. A field may appear broad on the general map, then look more divided here because narrow natural-cover strips stand out more clearly.
Several smaller categories add detail without changing the overall agricultural character. Grassland is 2.98%, shrubland 2.24%, and open water 1.75% in the supplied summary. Water is therefore far less extensive than wetlands. Blue should be read as open water, while teal wetland cover may include vegetation and soils affected by water. Treating the two colors as interchangeable would greatly overstate the amount of visible open water.
The hard-surface map separates a compact town center from a largely rural county
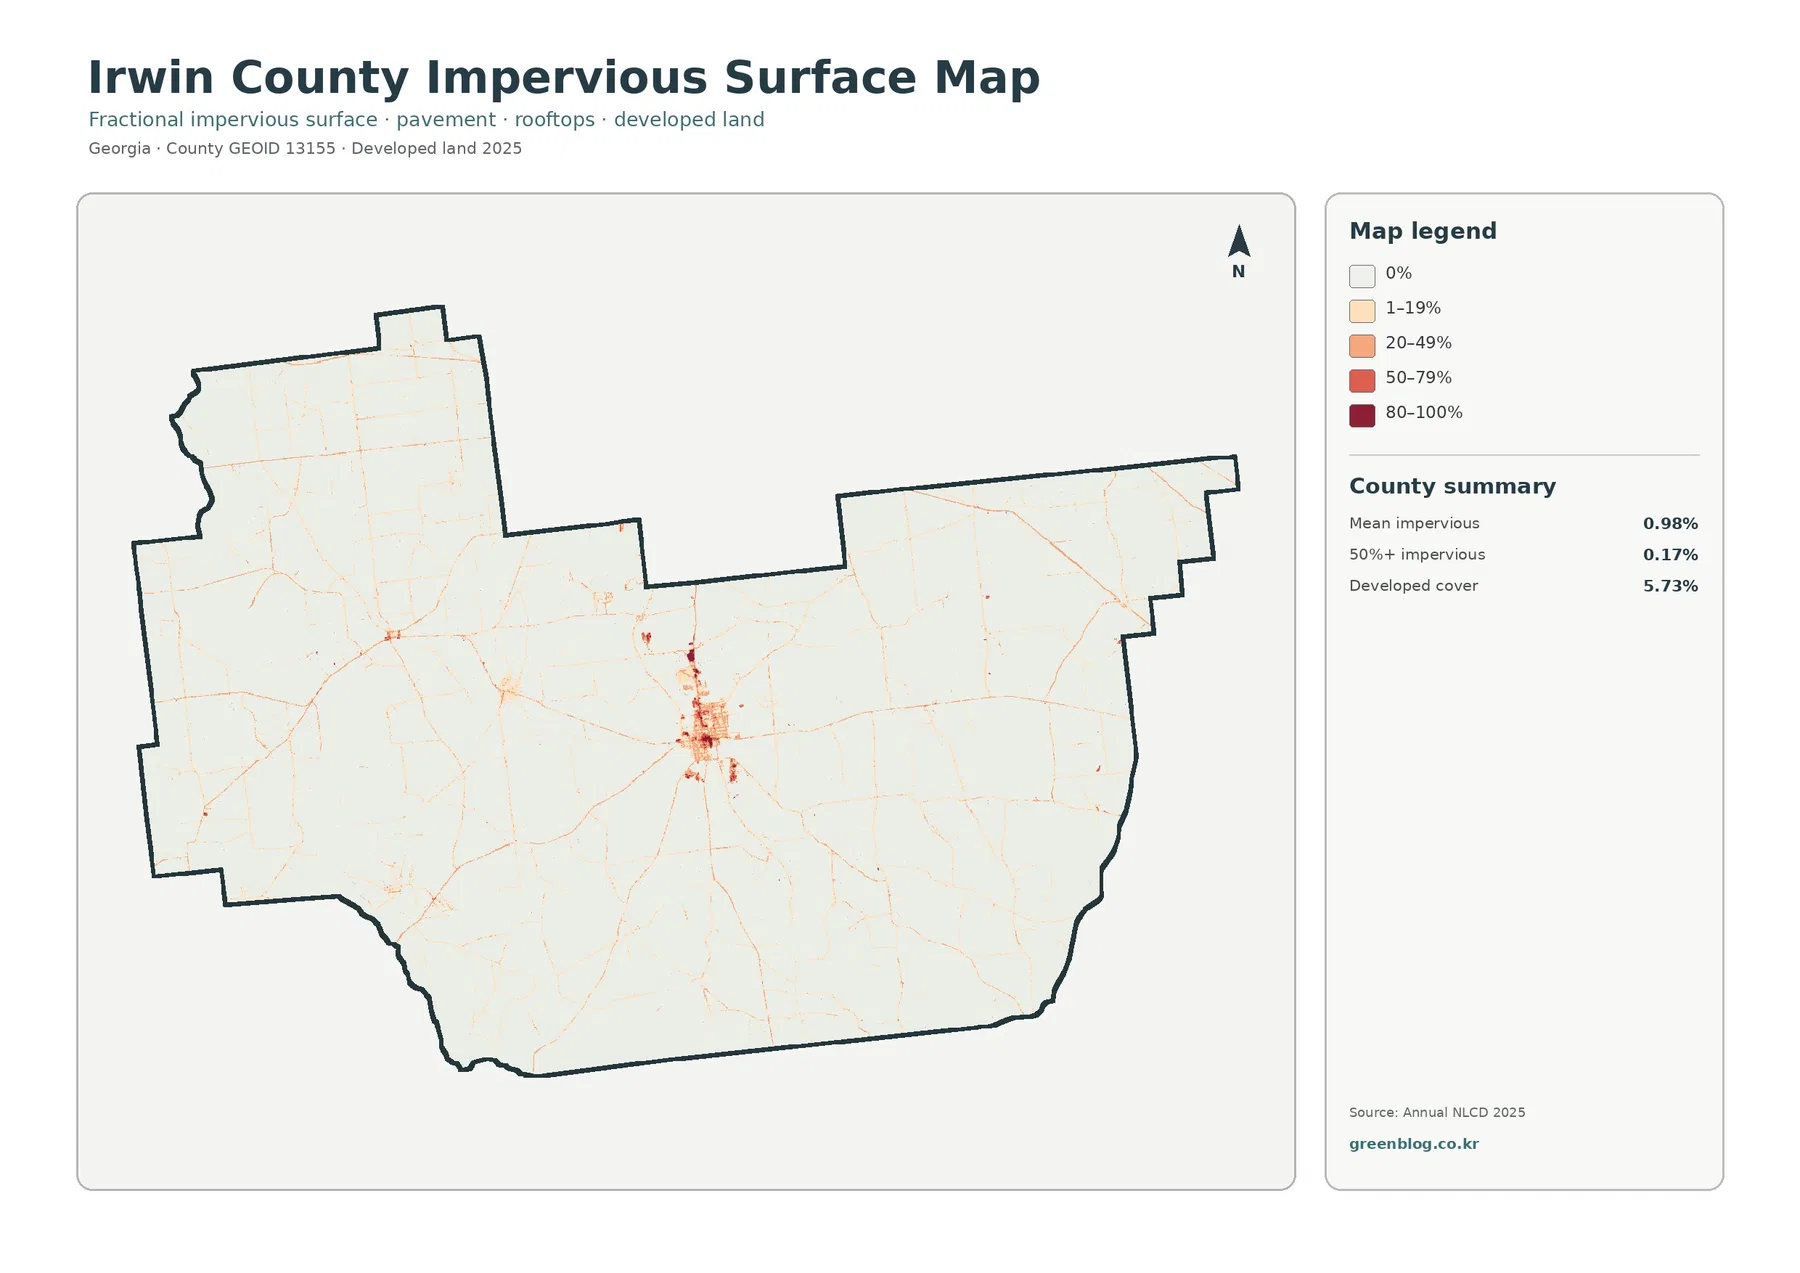
An impervious surface is a hard cover such as a roof, parking lot, or paved road where water does not readily soak into the ground. Irwin County’s mean impervious value is 0.98%, and only 0.17% of the county is mapped at 50% impervious or greater. Both numbers are much lower than the 5.73% developed-cover share because a developed land-cover cell can also contain grass, trees, bare soil, and other permeable surfaces.
The darkest hard-surface cluster is compact and near the county center. Lighter lines spread from that area in several directions, resembling the narrow footprint expected where roads and scattered buildings cross rural land. Farther from the central cluster, high impervious values become uncommon. This contrast helps explain why the general land-cover map can show developed cells over a broader area while the truly hard surfaces remain concentrated in much smaller places.
The impervious image should not be used as a flood map either. Hard surfaces can matter to runoff, but actual flooding depends on rainfall, soil, elevation, drainage systems, channels, and many other conditions. For a presentation, the map is useful for showing where built surfaces are concentrated relative to farmland and natural cover. Site drainage, engineering, or hazard decisions require current specialized data.
What the 18.34% class difference says—and what it does not say
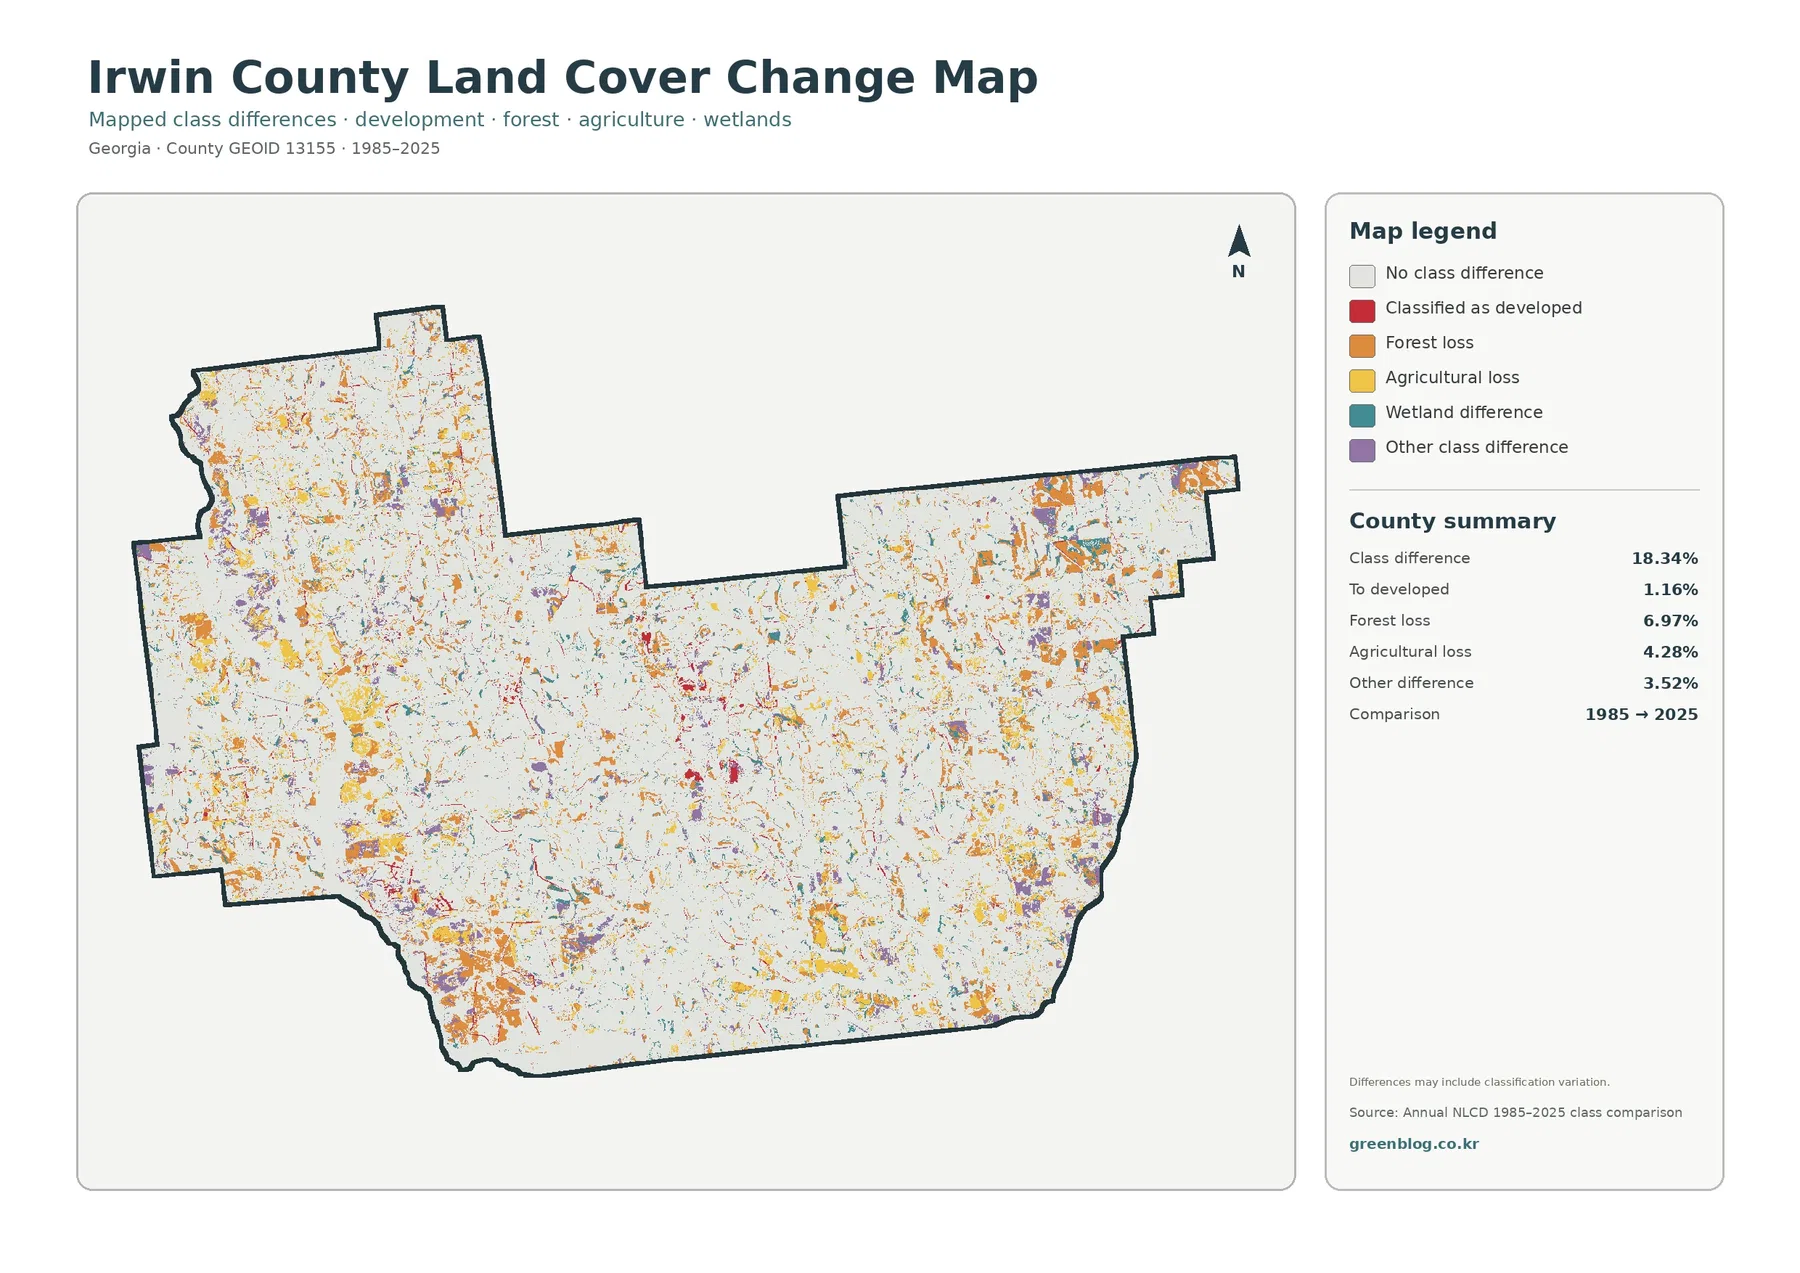
The supplied change summary reports a total class difference of 18.34% between 1985 and 2025. Within that total, 1.16% is listed as classified to developed, 6.97% as forest loss, 4.28% as agricultural loss, and 3.52% as other difference. Wetland difference appears in the legend but does not have a separate percentage in the summary, so the unlisted remainder should not be presented as an official wetland-change rate.
Orange forest-loss patches are scattered widely and form some larger concentrations in the northeast and southwest. Yellow agricultural-loss marks also appear across many rural parts of the county rather than around one single center. Red developed-conversion cells are more noticeable near the compact central built area, but they make up only 1.16%. That pattern is why the 18.34% total cannot be described as the share of the county that urbanized.
The word “loss” in this legend describes a class transition between the two endpoint years. A cell labeled forest in 1985 and something else in 2025 is counted as forest loss, but the map alone cannot prove whether timber harvest, agriculture, construction, vegetation recovery, moisture conditions, or classification variation explains the difference. Establishing a cause requires intermediate imagery, local records, and often field knowledge.
Reading NLCD cells without mistaking them for parcels
Annual NLCD classifies the land surface from remotely sensed and supporting data. Land cover describes what appears to cover the ground—forest, agriculture, wetland, water, grass, or developed surface—not who owns the property or what a zoning code allows. A farm-colored cell therefore is not an ownership boundary, and a developed-colored cell is not proof of a building permit or municipal designation.
The dataset uses 30-meter raster cells. Each square receives one predominant class even when a field edge, tree line, ditch, driveway, lawn, and building all occur inside the same cell. Sharp color edges can look precise when the JPG is enlarged, but the source resolution has not become more detailed. Parcel-level questions need current higher-resolution imagery, surveys, and local records.
The current maps represent the supplied 2025 observation year. Construction, harvest, fallow conditions, vegetation recovery, flooding, or road work after that observation may not appear. Agricultural surfaces can also look different across seasons. These images are best treated as a countywide reference for the stated date rather than a guarantee of what a particular site looks like now.
What is included in the original JPG download
The ZIP contains one original JPG for 2025 land cover, forest and farmland, impervious surface and developed land, and 1985–2025 land-cover change. Each file measures 2480 × 1754 pixels. They work well for web pages, reports, classroom material, and ordinary presentation slides, but the package does not state that they meet an A3 high-resolution standard. Test a large print before relying on it for a poster.
Frequently Asked Questions
Is Irwin County mostly farmland?
Agriculture is the largest individual class at 45.76%, so farming is the leading surface pattern in the 2025 summary. It is not the whole landscape, however. Wetlands account for 23.34% and forest 18.11%, and both appear repeatedly between farm areas. A better description is a farm-dominant county with a large network of wet and wooded natural cover.
Why is developed cover 5.73% when mean impervious cover is only 0.98%?
Developed land and impervious surface are different measures. A developed cell can contain lawns, trees, bare soil, and other permeable areas around buildings or roads. Impervious data isolate hard surfaces such as roofs and pavement. In a largely rural county, that distinction can produce a developed share several times larger than the countywide mean impervious percentage.
Sources and Reference Data
- MRLC Annual NLCD Data – official access point for Annual NLCD land-cover and comparison data
- USGS Annual NLCD Land Cover Classification – definitions and documentation for the land-cover classes used in Annual NLCD
- Georgia DCA – Irwin County w Ocilla City Comprehensive Plan – state-hosted current and historical planning documents for Irwin County and Ocilla
- UGA Extension – Irwin County – county-level agriculture, environment, soil, and water education and services
Map File Information
The ZIP contains four original JPG maps for comparing Irwin County agriculture, wetlands, forest, the compact Ocilla-area built pattern, impervious surfaces, and 1985–2025 class differences.
- Included Files: Four original JPG land-cover maps
- File Type: JPG files in one ZIP archive
- Intended Use: Printing, education, presentations, and map-based projects
Related Maps
- Appling County Georgia Land Cover Map
- Atkinson County Georgia Land Cover Map
- Bacon County Georgia Land Cover Map
Green Map creates custom-edited map images using open geographic data sources such as geoBoundaries, Natural Earth, OpenStreetMap, and government open data. These maps are edited visual materials, not raw data files, and are provided for education, documents, presentations, and graphic reference.