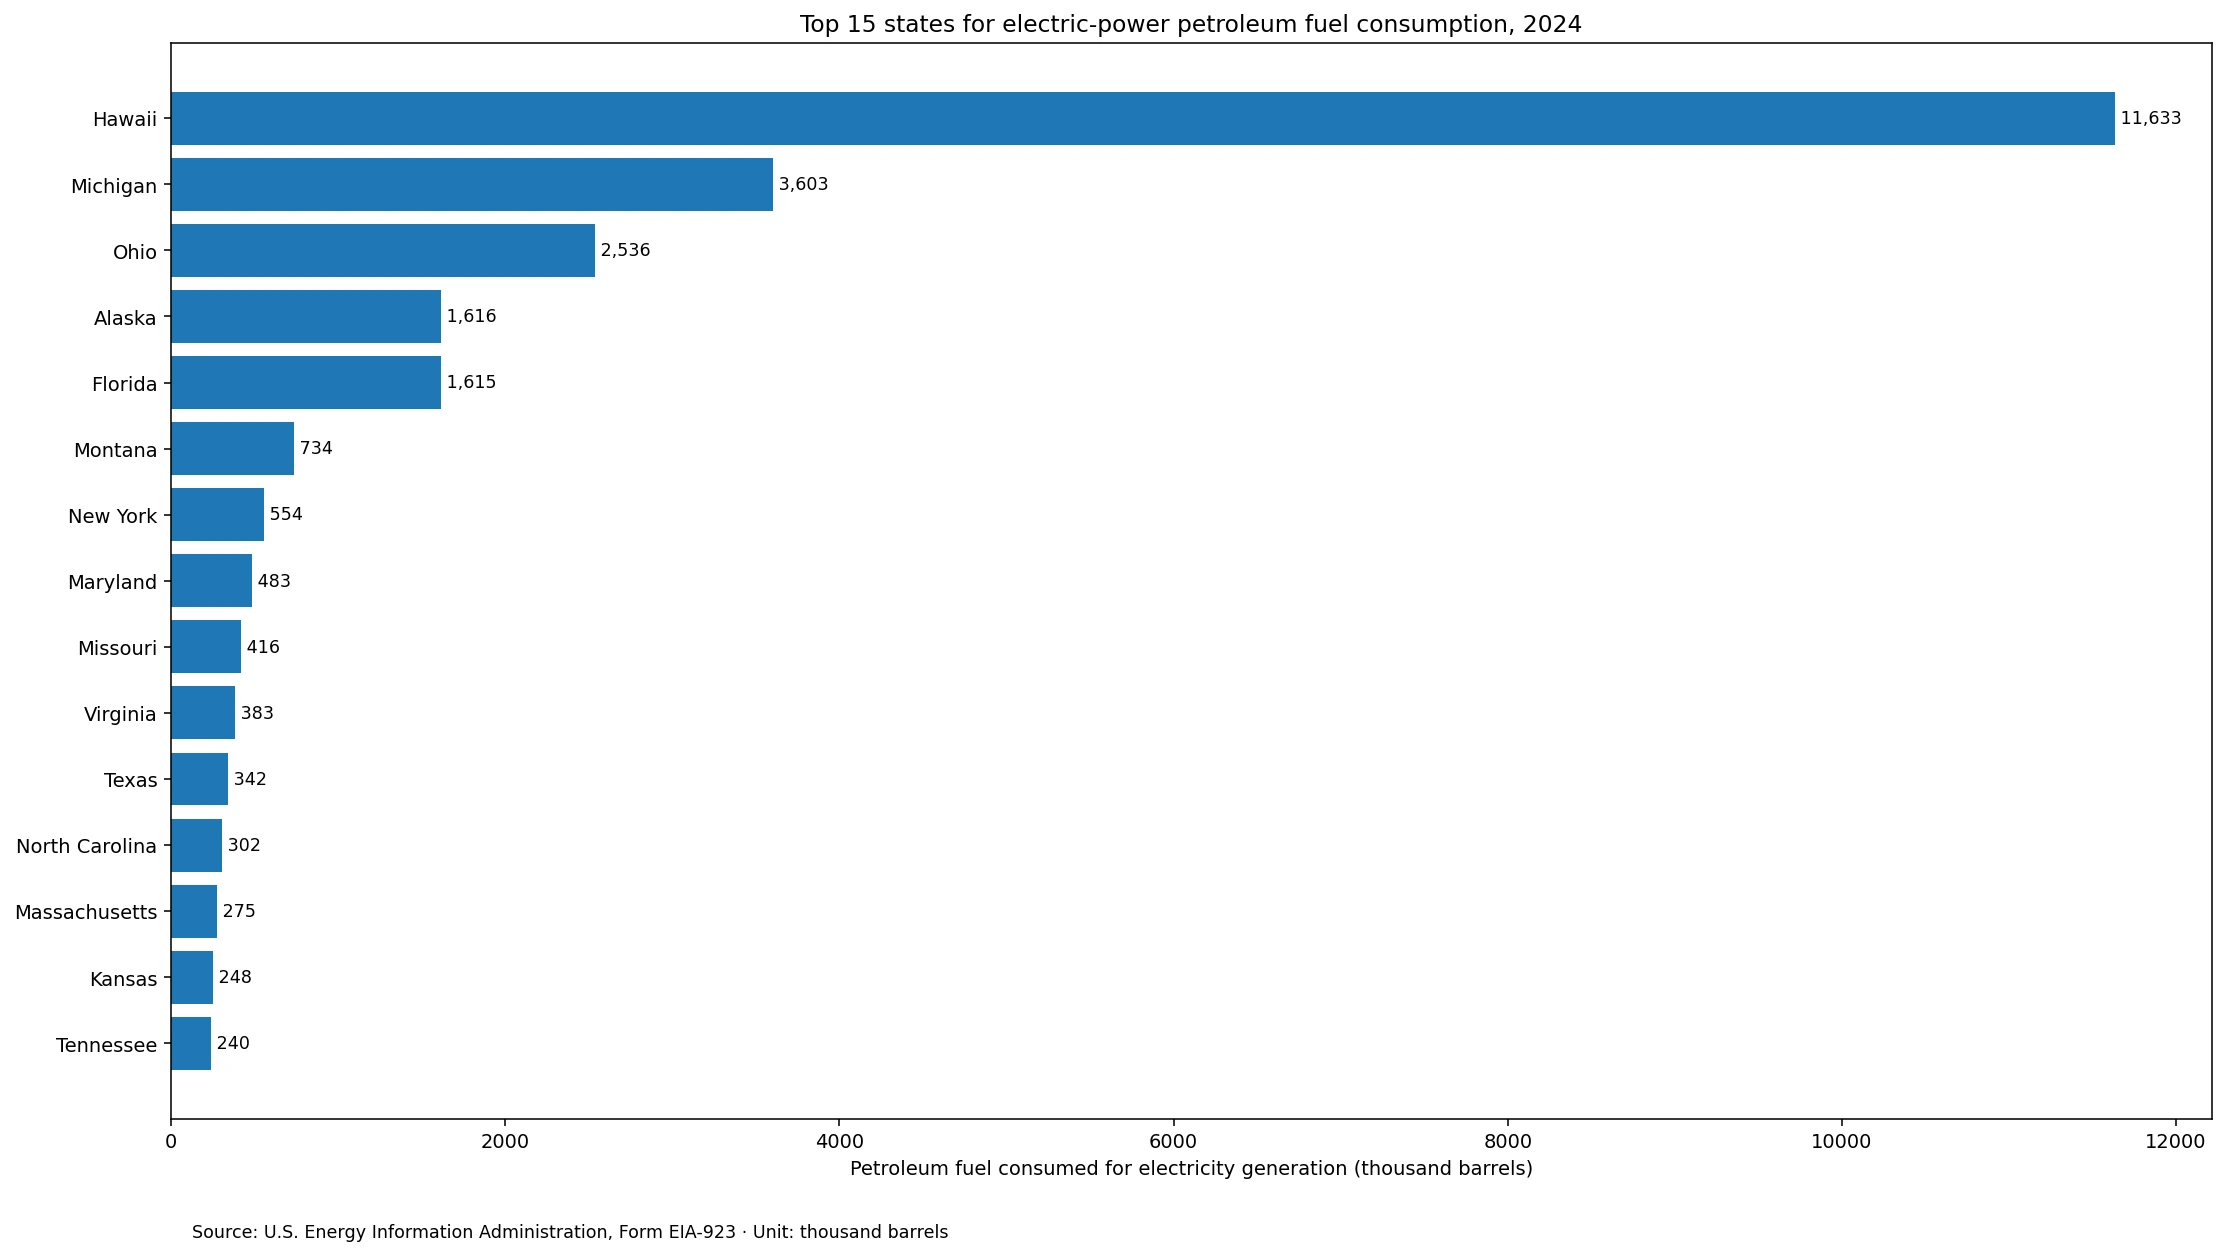
Petroleum fuel used for electricity generation in the U.S. electric-power sector was highly concentrated in a small number of states in 2024. In the U.S. Energy Information Administration (EIA) Electric Power Operational Data series filtered to 2024, Petroleum (PET), and Electric Power, Hawaii is highest at 11,633.148 thousand barrels. Michigan follows at 3,603.167 thousand barrels and Ohio at 2,535.544 thousand barrels. The 50 states returned by this API slice sum to 27,976.703 thousand barrels.
The Petroleum category is broader than petroleum liquids alone. EIA electricity statistics define Petroleum to include petroleum liquids and petroleum coke. Petroleum coke is normally reported in short tons, and EIA conversion references use five barrels per short ton for petroleum coke. That matters for states such as Michigan and Ohio, where petroleum-coke consumption makes the combined PET value far larger than the petroleum-liquids figure by itself.
The sector definition also needs to be kept narrow. In EIA annual electricity tables, the Electric Power Sector combines Electric Utilities and Independent Power Producers, while Commercial and Industrial generation are reported separately. The state ranking here therefore compares petroleum fuel consumed for generation by utilities and IPPs, not every generator in every ownership or end-use sector.
Table of Contents
Hawaii alone accounts for 41.6%, and Hawaii plus Michigan exceed half the total
Hawaii contributes 41.6% of the 50-state sum. Michigan contributes 12.9%, so the top two together account for 54.5%. Adding Ohio raises the top-three total to 17,771.859 thousand barrels, or 63.5%.
Alaska ranks fourth and Florida fifth. The top five account for 75.1% of the 50-state sum. The top ten reach 23,573.398 thousand barrels, or 84.3%, and the top fifteen account for 89.3%. This is a strongly concentrated distribution rather than an even state-by-state pattern.
The 559.5-thousand-barrel mean is almost five times the 112.5-thousand-barrel median
The arithmetic mean is 559.5 thousand barrels, while the median is 112.5 thousand barrels. The mean is about 5.0 times the median because the largest observations pull the average upward. The first quartile is 54.1 thousand barrels and the third quartile is 268.3 thousand barrels.
| 2024 consumption band | States |
|---|---|
| 10 thousand barrels or less | 3 |
| Over 10 to 50 thousand barrels | 8 |
| Over 50 to 100 thousand barrels | 14 |
| Over 100 to 250 thousand barrels | 12 |
| Over 250 to 500 thousand barrels | 6 |
| Over 500 to 1,000 thousand barrels | 2 |
| Over 1,000 thousand barrels | 5 |
None of the 50 returned state observations is missing or exactly zero. Idaho is the smallest positive observation at 0.083 thousand barrels, while Hawaii exceeds 11,600 thousand barrels. Those very different scales make medians and concentration shares important. Small positive values are preserved rather than rounded into zero.
The District of Columbia is not returned in this API slice
This dataset contains the 50 states but no District of Columbia row. Other EIA petroleum-liquids tables can show a very small District value, but the specific PET + Electric Power API slice used here does not return D.C. The analysis therefore does not fill the missing jurisdiction with zero. Sums, rankings, means, and distribution bands are calculated from the 50 observations actually supplied.
Complete 2024 ranking for all 50 states
The table below sorts the 2024 Petroleum + Electric Power + Consumption for Electricity Generation observations from highest to lowest. Shares use the direct 50-state sum of 27,976.703 thousand barrels as the denominator. The source unit is thousand barrels and no missing-value imputation is applied.
| Rank | State | Petroleum fuel consumed for electricity generation (thousand barrels) | Share of 50-state sum |
|---|---|---|---|
| 1 | Hawaii (HI) | 11,633.148 | 41.6% |
| 2 | Michigan (MI) | 3,603.167 | 12.9% |
| 3 | Ohio (OH) | 2,535.544 | 9.1% |
| 4 | Alaska (AK) | 1,615.890 | 5.8% |
| 5 | Florida (FL) | 1,615.336 | 5.8% |
| 6 | Montana (MT) | 734.100 | 2.6% |
| 7 | New York (NY) | 554.377 | 2.0% |
| 8 | Maryland (MD) | 483.186 | 1.7% |
| 9 | Missouri (MO) | 415.971 | 1.5% |
| 10 | Virginia (VA) | 382.679 | 1.4% |
| 11 | Texas (TX) | 342.046 | 1.2% |
| 12 | North Carolina (NC) | 301.835 | 1.1% |
| 13 | Massachusetts (MA) | 274.930 | 1.0% |
| 14 | Kansas (KS) | 248.311 | 0.9% |
| 15 | Tennessee (TN) | 239.570 | 0.9% |
| 16 | West Virginia (WV) | 229.015 | 0.8% |
| 17 | Pennsylvania (PA) | 189.856 | 0.7% |
| 18 | Indiana (IN) | 189.648 | 0.7% |
| 19 | South Carolina (SC) | 186.745 | 0.7% |
| 20 | Georgia (GA) | 173.372 | 0.6% |
| 21 | Connecticut (CT) | 169.558 | 0.6% |
| 22 | Wisconsin (WI) | 168.901 | 0.6% |
| 23 | Iowa (IA) | 130.899 | 0.5% |
| 24 | Nebraska (NE) | 127.525 | 0.5% |
| 25 | Kentucky (KY) | 125.810 | 0.4% |
| 26 | Washington (WA) | 99.177 | 0.4% |
| 27 | Colorado (CO) | 95.866 | 0.3% |
| 28 | Louisiana (LA) | 94.455 | 0.3% |
| 29 | Arkansas (AR) | 94.077 | 0.3% |
| 30 | Wyoming (WY) | 89.663 | 0.3% |
| 31 | North Dakota (ND) | 89.362 | 0.3% |
| 32 | California (CA) | 83.471 | 0.3% |
| 33 | Maine (ME) | 81.606 | 0.3% |
| 34 | Delaware (DE) | 62.121 | 0.2% |
| 35 | Utah (UT) | 61.046 | 0.2% |
| 36 | Arizona (AZ) | 60.220 | 0.2% |
| 37 | New Hampshire (NH) | 57.498 | 0.2% |
| 38 | Illinois (IL) | 52.961 | 0.2% |
| 39 | South Dakota (SD) | 52.920 | 0.2% |
| 40 | Oklahoma (OK) | 48.737 | 0.2% |
| 41 | New Jersey (NJ) | 46.927 | 0.2% |
| 42 | Minnesota (MN) | 46.514 | 0.2% |
| 43 | Oregon (OR) | 23.643 | 0.1% |
| 44 | Alabama (AL) | 19.213 | 0.1% |
| 45 | Nevada (NV) | 12.557 | 0.0% |
| 46 | Vermont (VT) | 11.542 | 0.0% |
| 47 | Rhode Island (RI) | 10.001 | 0.0% |
| 48 | Mississippi (MS) | 9.613 | 0.0% |
| 49 | New Mexico (NM) | 2.011 | 0.0% |
| 50 | Idaho (ID) | 0.083 | 0.0% |
Michigan and Ohio illustrate why PET is not the same as petroleum liquids
EIA Electric Power Annual Table 5.10 reports about 179 thousand barrels of petroleum-liquids consumption for electricity generation across all sectors in Michigan in 2024, while Table 5.11 reports 744 thousand tons of petroleum coke. Most of Michigan’s petroleum-coke consumption is in the electric-power sector. Converting the coke quantity to barrel equivalents explains why the combined PET state value is around 3.6 million barrels rather than a few hundred thousand barrels.
Ohio shows a similar pattern: about 255 thousand barrels of petroleum liquids across all sectors and 457 thousand tons of petroleum coke in 2024. Hawaii is the opposite case. Its petroleum-coke consumption is zero in the state table, while petroleum-liquids consumption is exceptionally large. The same combined Petroleum metric can therefore reflect very different fuel compositions across states.
A rounded national component check reproduces the state sum very closely
In EIA’s 2024 annual tables, petroleum-liquids consumption for electricity generation by Electric Utilities plus Independent Power Producers is about 20,195 thousand barrels. Petroleum-coke consumption by those two electric-power subsectors is about 1,556 thousand tons, equivalent to roughly 7,780 thousand barrels using EIA’s five-barrels-per-ton conversion. The resulting rounded total is about 27,975 thousand barrels, only 1.703 thousand barrels (0.006%) below the 27,976.703-thousand-barrel state sum.
The small difference is consistent with the annual tables being displayed in rounded whole units while the API retains more decimal precision. EIA Table 1.2 reports 29,096 thousand barrels of petroleum consumed for electricity generation across all sectors in 2024, which is larger because the all-sector total also includes Commercial and Industrial generation.
Fuel consumption is not the same as electricity generation or emissions
A thousand-barrel fuel-consumption measure does not directly report megawatthours generated. Plant efficiency, fuel heat content, generator type, combined-heat-and-power operation, and operating conditions all affect how much electricity can be produced from a given physical quantity of fuel. The same caution applies to emissions. NOx, SO₂, and CO₂ do not all scale with fuel use in exactly the same way because combustion conditions and pollution controls matter.
This dataset directly answers where utilities and independent power producers consumed the most Petroleum fuel for electricity generation in 2024. An efficiency analysis would need matching petroleum-fired generation as a denominator. An emissions-intensity analysis would need emissions with the same fuel, sector, and year coverage.
Source and calculation method
The state observations come from the U.S. Energy Information Administration Electric Power Operational Data API. The selected slice is annual 2024 data with field=consumption-for-eg, fueltypeid=PET, sectorid=98, and a source unit of thousand barrels. Petroleum-category and sector cross-checks use Electric Power Annual Table 5.2.A, Table 5.3.A, Table 5.10, and Table 5.11.
All 50 state codes are unique, every row is dated 2024, and there are no missing or zero numeric observations. The sum (27,976.703 thousand barrels), mean (559.5), median (112.5), quartiles, rankings, and cumulative shares are calculated directly from those 50 observations. The representative chart displays the top 15 states, while the full ranking and statistics use all 50.
Main takeaway
Hawaii leads 2024 electric-power Petroleum consumption at 11,633.148 thousand barrels, followed by Michigan at 3,603.167 and Ohio at 2,535.544. Hawaii and Michigan together account for 54.5% of the 50-state sum, and the top ten account for 84.3%. The most important interpretation point is that EIA’s Petroleum category combines petroleum liquids and petroleum coke, so Michigan and Ohio rank much higher than a petroleum-liquids-only comparison would suggest.
Frequently Asked Questions
Which state consumed the most petroleum fuel for electricity generation in 2024?
Hawaii ranked first at 11,633.148 thousand barrels, followed by Michigan at 3,603.167 and Ohio at 2,535.544.
Does EIA’s Petroleum category include only petroleum liquids?
No. In EIA electricity statistics, Petroleum includes petroleum liquids and petroleum coke.
Does the Electric Power sector include commercial and industrial self-generation?
No. In the EIA annual sector structure, Electric Power combines Electric Utilities and Independent Power Producers, while Commercial and Industrial generation are separate.
Why is the District of Columbia missing from the ranking?
The specific 2024 PET + Electric Power API slice returned 50 states and no District of Columbia row. The analysis preserves that absence rather than replacing it with zero.
Related Maps
Green Map creates custom-edited map images using open geographic data sources such as geoBoundaries, Natural Earth, OpenStreetMap, and government open data.
These maps are edited visual materials, not raw data files, and are provided for education, documents, presentations, and graphic reference.