Blackford County sits in east-central Indiana, and its compact size makes the relationship between towns, roads, streams, and terrain easy to compare on a county-scale map. Hartford City is the county seat and the main settlement shown near the south-central part of the county, while Montpelier stands out farther north. Shamrock Lakes appears southwest of Hartford City, and several smaller place labels help fill in the spaces between the main communities. This page combines boundary, city-connection, water, and elevation views, and the original high-resolution JPG map files are available in one download package.
The official county community page describes Hartford City and Montpelier as the county’s two primary cities and notes that Shamrock Lakes and part of Dunkirk are also associated with Blackford County. Those relationships are easy to recognize in the supplied maps. Rather than treating the county as a blank rectangle, the maps show how Hartford City sits at an important road crossing, how Montpelier aligns with the northern east-west route, how creeks divide the rural interior, and how the higher ground is concentrated more strongly in the southern half.
Table of Contents
Hartford City anchors a compact east-central Indiana county
The general county map is the best place to begin because it combines the boundary, settlement areas, highways, local place names, rail lines, and streams in one view. Hartford City forms the largest highlighted urban area, positioned a little west of the county’s centerline and below the midpoint from north to south. Montpelier is clearly separated to the north, with Roll farther west along the same general east-west corridor. Shamrock Lakes lies in the southwest, while Millgrove appears in the southeastern interior. Dunkirk is labeled along the southeastern edge, which helps orient the county where the city reaches the county line.
The county outline is mostly regular, but the eastern and southern edges include small offsets that are useful when matching the map to other county or regional references. The inset locating Blackford County within Indiana places it in the eastern half of the state, close to the middle latitude of Indiana rather than near either the northern or southern border. That statewide reference is especially helpful for readers who know Hartford City only by name and need a quick sense of where the county belongs before looking at local roads.
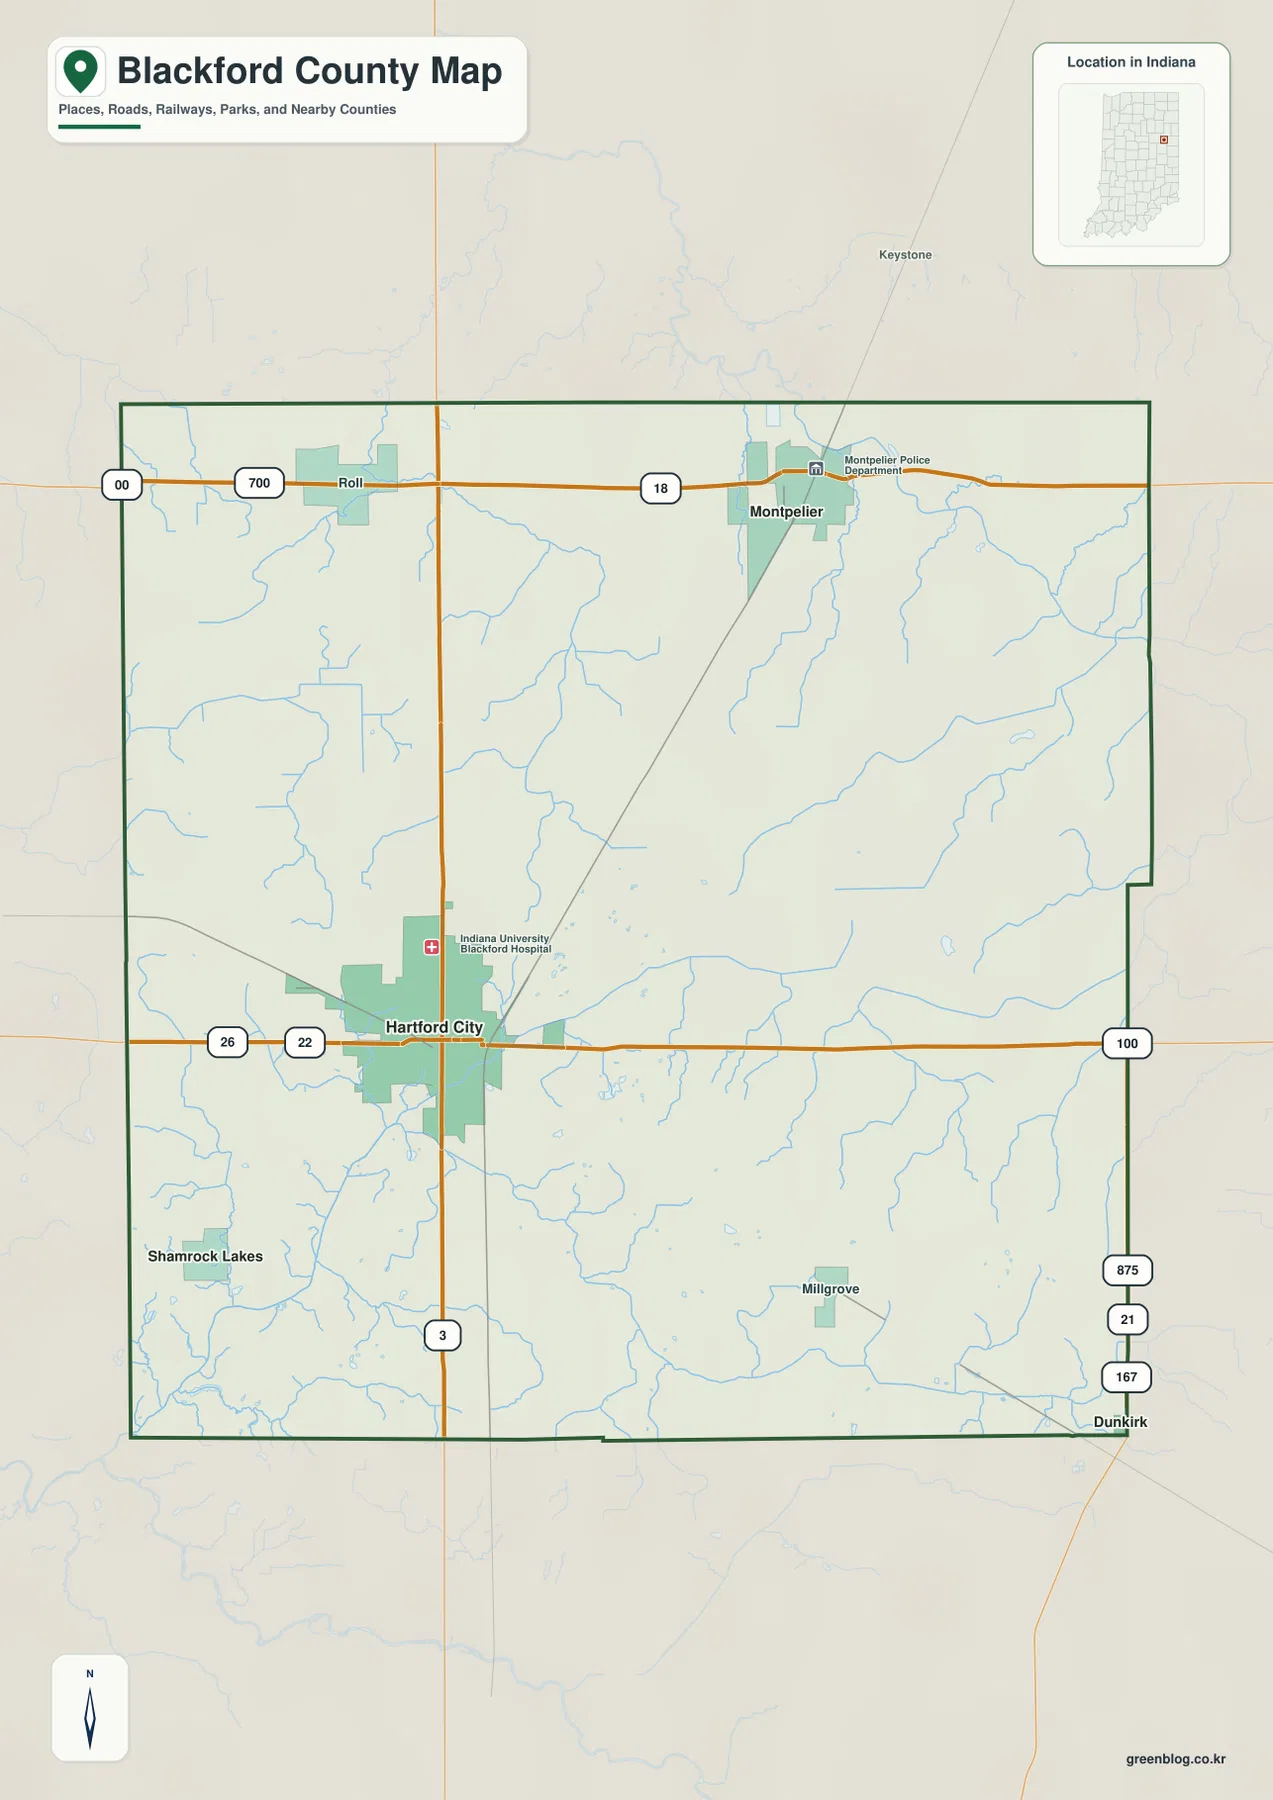
Several routes make the settlement pattern easier to understand. State Road 3 runs north-south through Hartford City and continues toward the northern part of the county. State Road 26 crosses Hartford City from west to east, while State Road 18 follows a separate east-west line through the north near Roll and Montpelier. A rail line also passes through Hartford City and bends toward Montpelier. These features explain why the two largest city areas are not randomly placed: each sits along a visible transportation corridor, although this map is intended for geographic reference rather than turn-by-turn navigation.
Straight-line connections put Montpelier and Shamrock Lakes in perspective
The city-connection map simplifies the county by making Hartford City the hub and emphasizing the relative positions of the other principal communities. Montpelier is shown about 8 miles from Hartford City, while Shamrock Lakes is about 4 miles away. Those figures are straight-line distances, not driving distances. The connecting lines are therefore most useful for comparing direction and separation at a glance; actual road mileage will be longer and depends on the route taken.
From Hartford City, Montpelier lies mainly to the north with a slight eastward offset. Shamrock Lakes is much closer and sits to the southwest. The map also labels Wells County to the north, Jay County to the east, and neighboring county territory along the west side, so the county does not appear isolated from the surrounding region. When this simplified city view is compared with the general map, the road relationships become clearer: Hartford City aligns with the State Road 3 and State Road 26 crossing, while Montpelier lies close to State Road 18 in the northern tier.
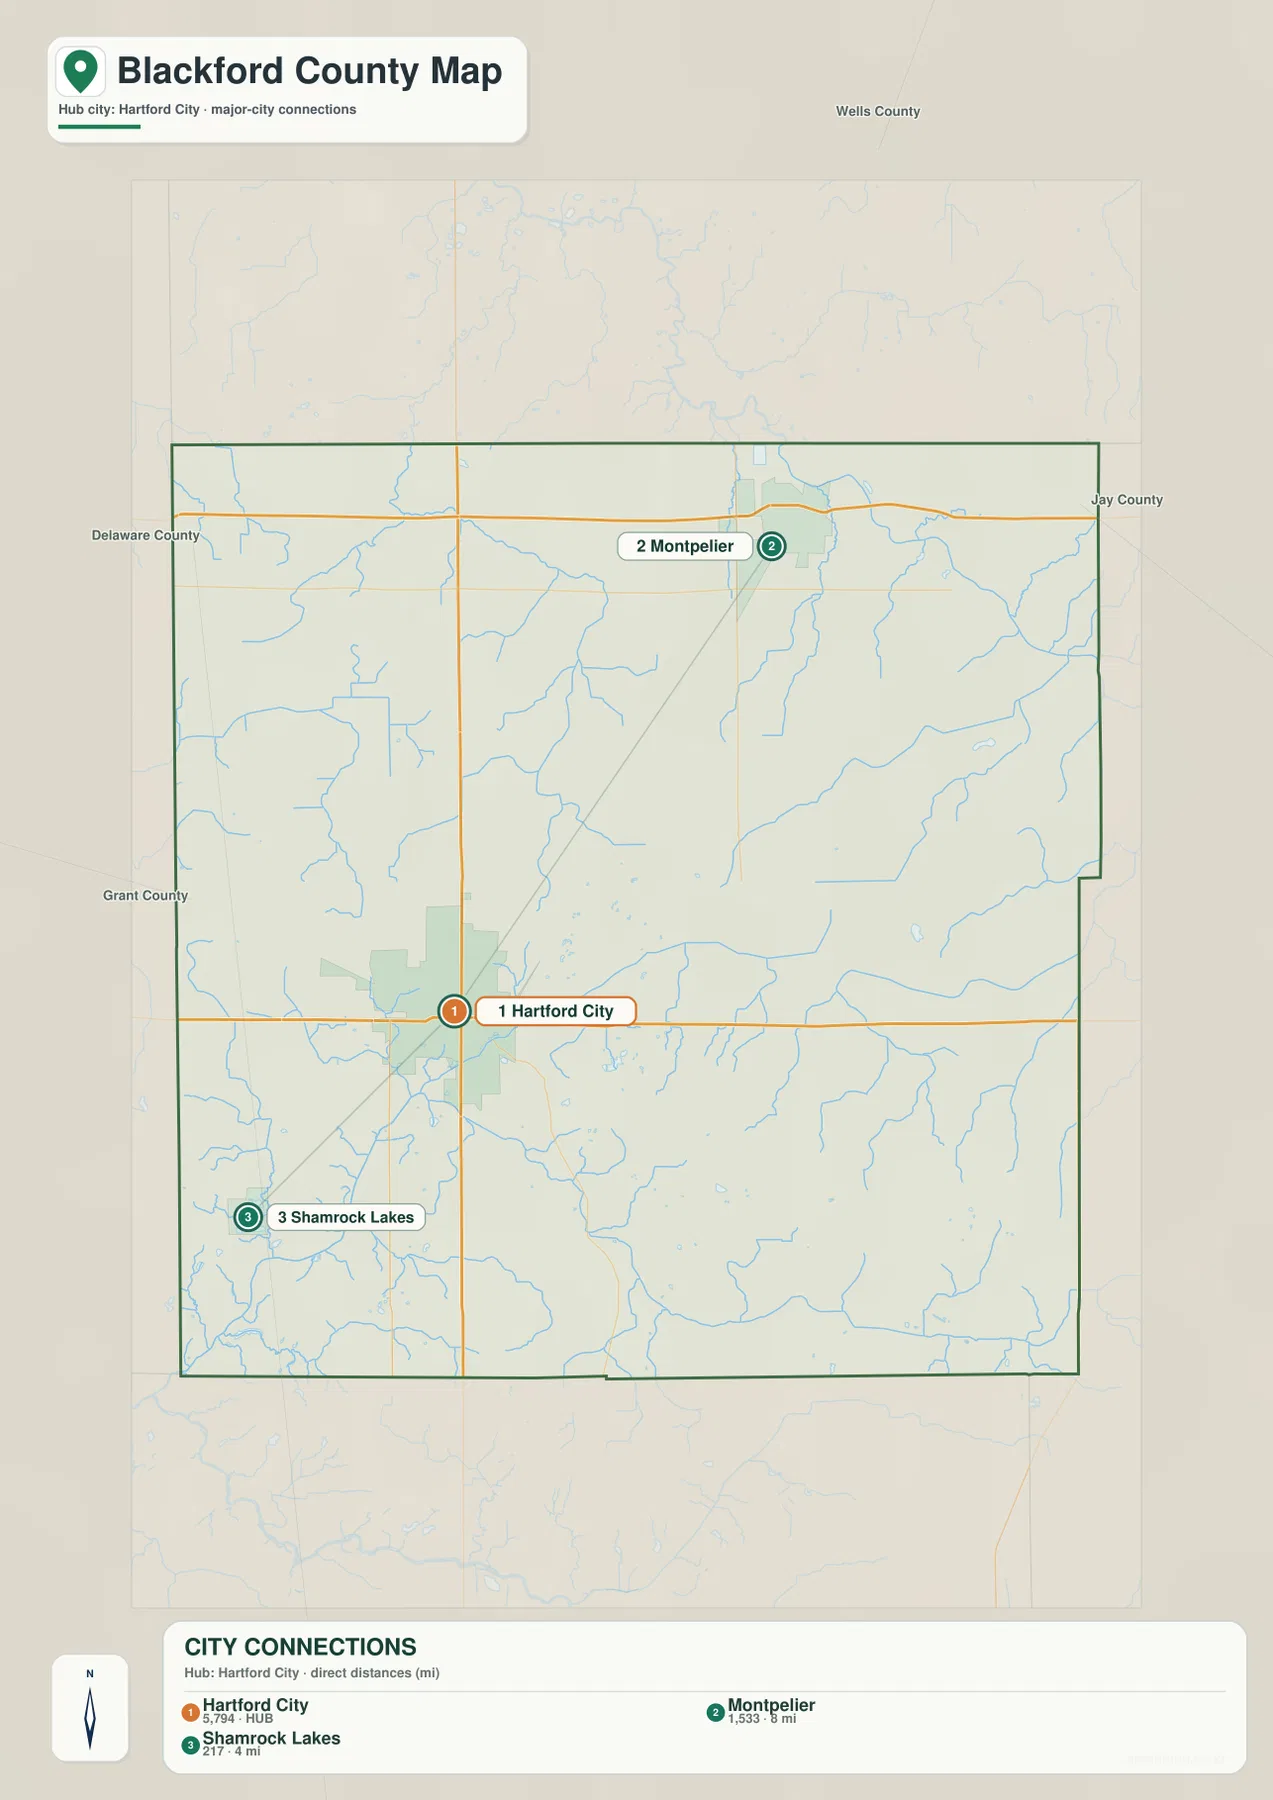
This map is useful when the question is not “which road should I drive?” but “where are the county’s main communities relative to one another?” The answer is visually immediate. Hartford City occupies the central working position, Montpelier gives the county a second urban focus in the north, and Shamrock Lakes sits close enough to Hartford City to appear as part of the same broader southern cluster at county scale. For a visitor planning a trip, the map offers orientation first; a navigation service can then provide the precise route, travel time, construction status, and current traffic conditions.
Prairie Creek and smaller waterways divide the rural interior
The terrain-and-water map removes much of the road emphasis and lets the drainage network stand out. Prairie Creek is one of the clearest named features, entering the northern part of the county and bending southward through the north-central interior. Walnut Creek is labeled in the northwest. Near the northeastern edge, the map identifies the Salamonie River and Lake Blue Water. Farther south, Little Lick Creek and Big Lick Creek cross the central and southern landscape, while Little Joe Creek and Lake Mohee appear closer to the southwest corner. Lake Placid is also marked in the southern half.
What makes this view useful is the number of smaller channels that become visible once the cities and highways are de-emphasized. Blackford County is not represented by one dominant river running through its center. Instead, creeks, tributaries, and named ditches spread across different parts of the county. Slocum Ditch and Jones Ditch are labeled on the eastern side, and several smaller branches connect to the more prominent creeks in the south and west. This helps explain why a location that seems far from a large river on the general map may still be close to a small watercourse.
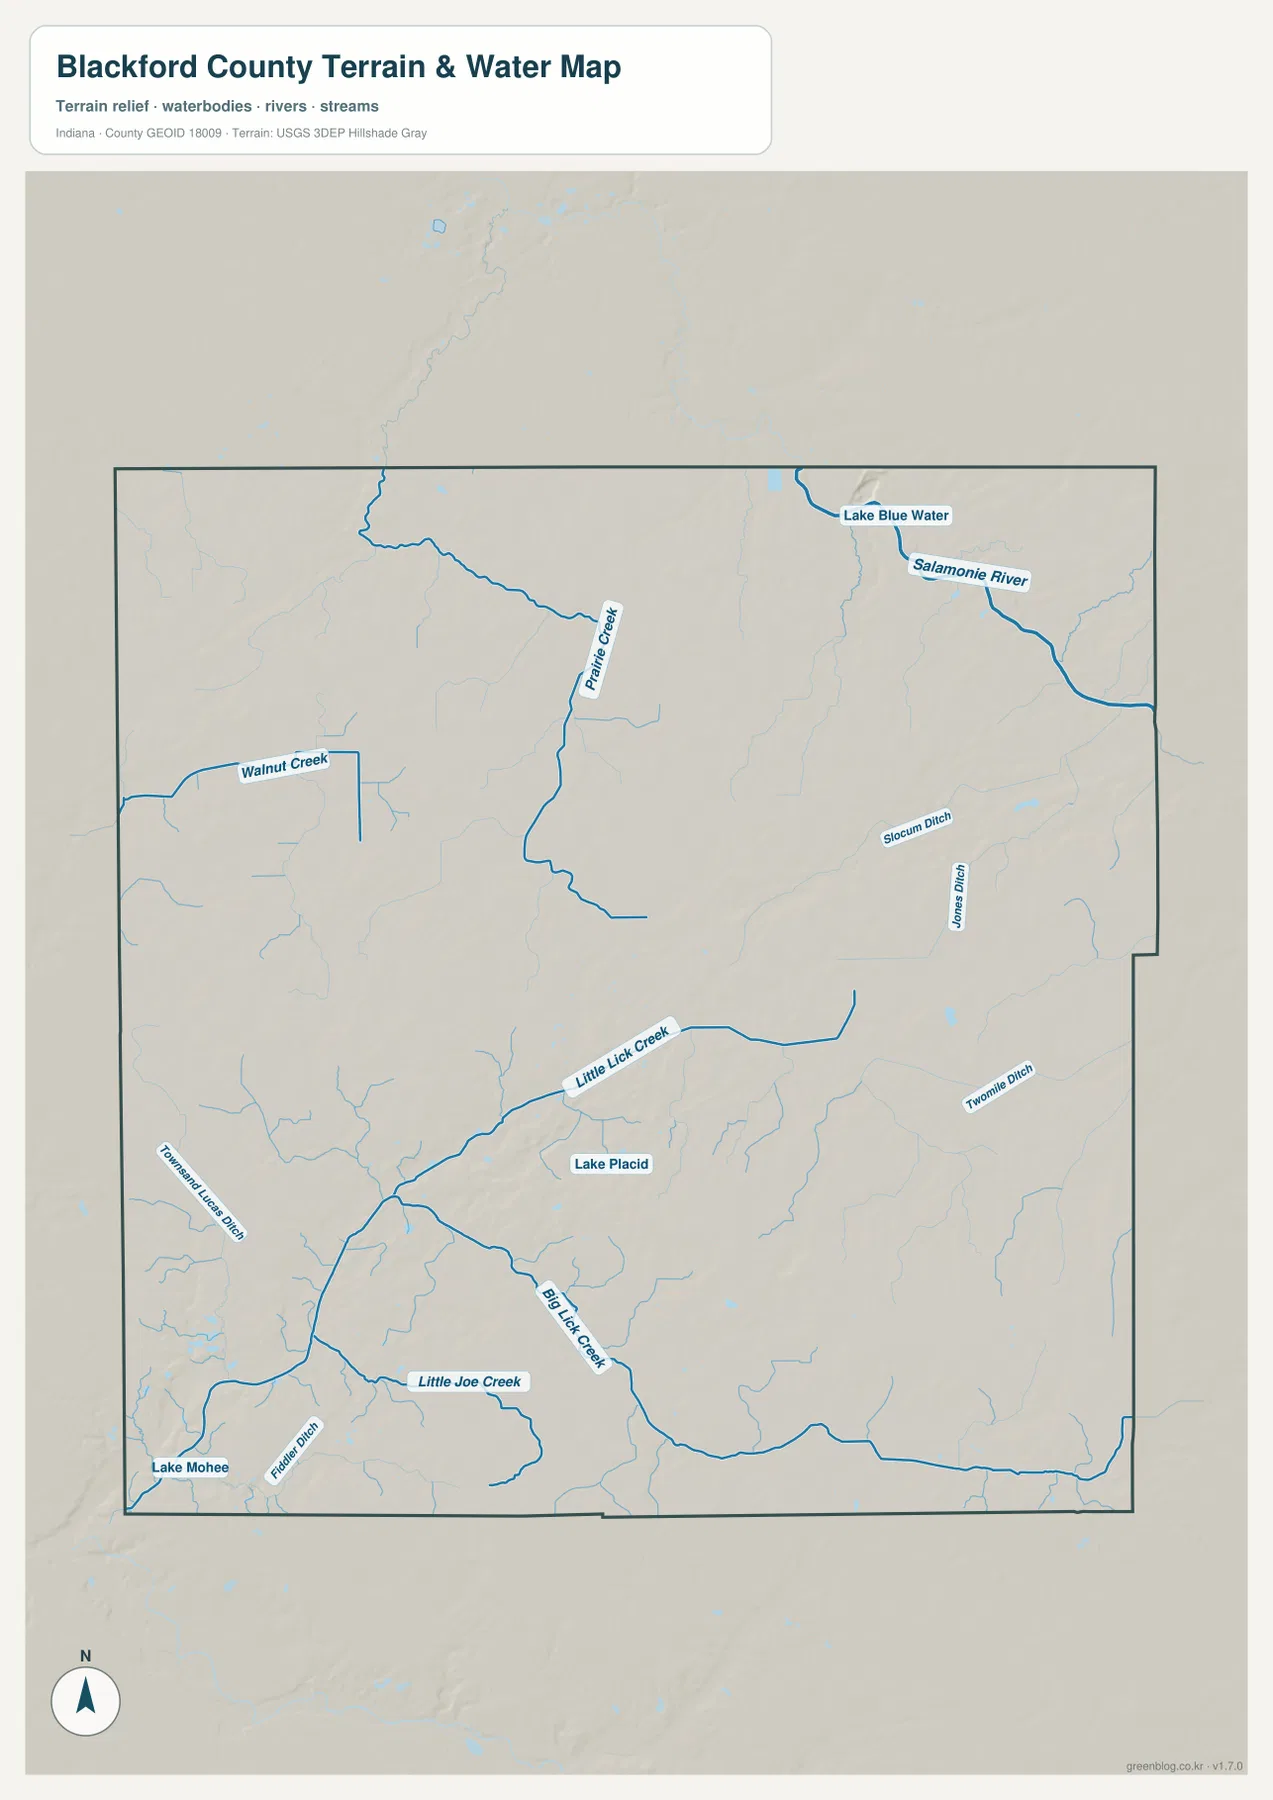
This is a reference map for the location of waterways and broad terrain relationships. It should not be used as a flood-zone map, parcel map, legal drainage boundary, or navigation chart. If a property, engineering project, or regulatory question depends on the exact position or classification of a water feature, the USGS National Hydrography products and the appropriate state or local records should be consulted. For ordinary county orientation, however, the map makes it much easier to compare the drainage network with Hartford City, Montpelier, and the surrounding rural road pattern.
Higher southern ground contrasts with lower drainage corridors
The elevation map adds another layer that is not obvious from the road map. The map reports an actual elevation range of about 234 to 292 meters and a mean elevation of about 273 meters. The strongest higher-elevation colors are concentrated across the southern half, especially from the south-central area toward the southeast. Smaller raised areas also appear in the southwest. By contrast, much of the north is shown in lower green and light-toned terrain, with especially noticeable lower corridors toward the northeast.
The southern relief is not mountainous, but it is distinct enough to create a clear county-scale contrast. A broad higher band crosses the lower third of the map, while narrow lower areas cut through or around it. When compared with the water map, some of those lower areas line up with creek valleys. The northeastern low ground is particularly easy to see, and the greener corridors elsewhere help explain how surface water fits into the terrain. The map therefore adds context to the drainage network without requiring the reader to interpret contour lines.
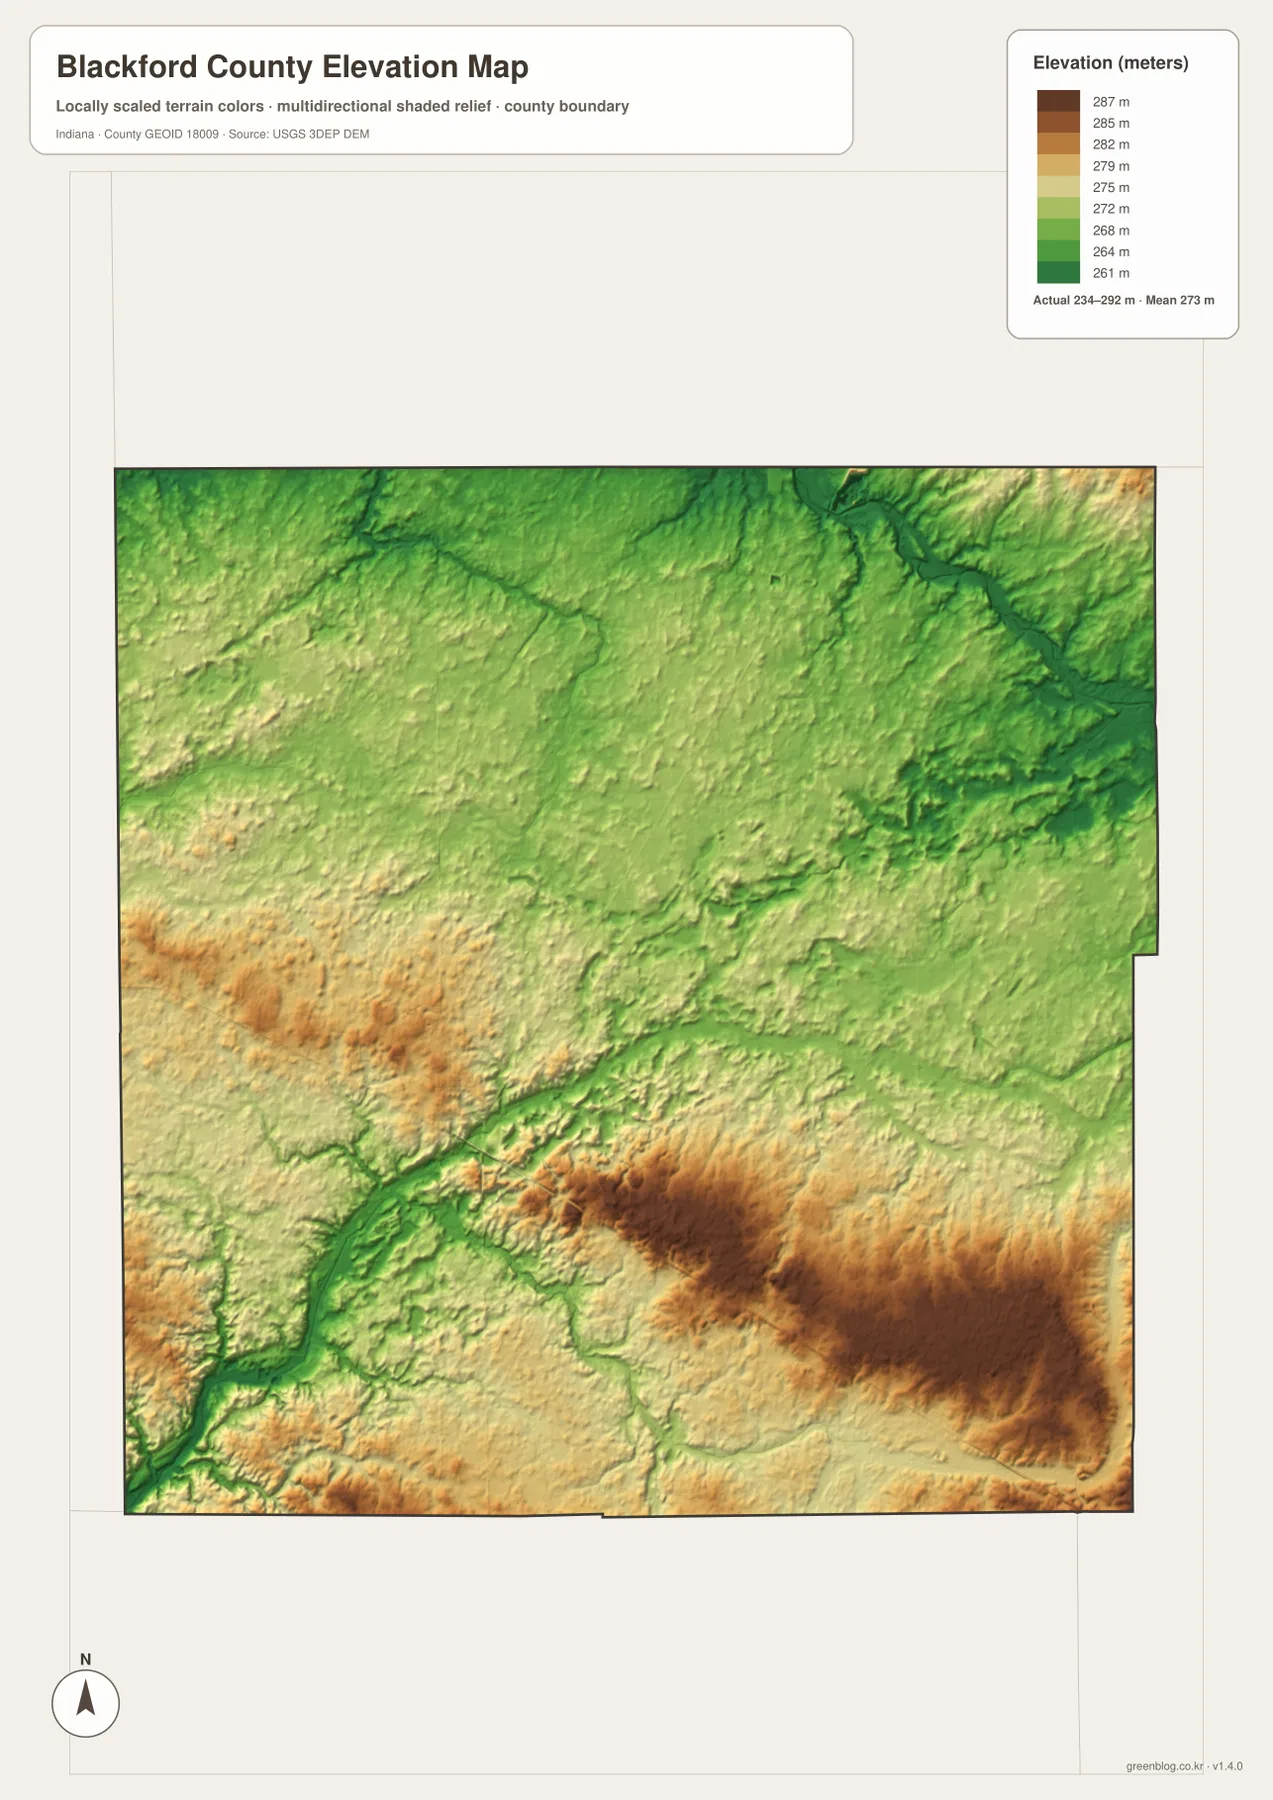
The colored surface is generalized for county-wide comparison and is not survey-grade or engineering-grade elevation data. It can show that one part of the county is higher than another, but it cannot establish the precise elevation of a building corner, drainage structure, or construction site. Those tasks require original elevation data and, where appropriate, field surveying. For readers using the map as a geographic reference, the important takeaway is the broad pattern: the south is generally higher, while lower drainage corridors create visible breaks through the landscape.
Reading the four views together
Each map answers a different practical question, but the county becomes most understandable when the views are compared. The general map establishes Hartford City, Montpelier, roads, railways, and the boundary. The city view removes much of that detail so the distance and direction between the main communities stand out. The water map shifts attention to Prairie Creek, Big Lick Creek, smaller tributaries, lakes, and ditches. Finally, the elevation view explains why some drainage corridors occupy visibly lower ground while the southern half rises above them.
One useful comparison is Hartford City itself. It is the county seat and the main road crossroads, but it is not located in the darkest high-elevation area. The highest-looking terrain lies farther south and southeast. Montpelier, meanwhile, sits near the northern transportation corridor and closer to the network of northern waterways. Shamrock Lakes is only about 4 straight-line miles from Hartford City, yet its southwestern position places it near a different set of small lakes and creeks. These differences give each community a distinct geographic setting even within a relatively small county.
For a simple printed reference, the general county map is usually the best starting point. The city-connection map is cleaner when a presentation needs to show where Hartford City, Montpelier, and Shamrock Lakes sit relative to one another. The terrain-and-water map works better for creek names and drainage context, and the elevation map is the clearest choice when the main question concerns higher and lower ground. Using two maps side by side is often more informative than trying to force every detail into a single image.
What these maps are designed to show
These files are county-reference maps rather than substitutes for specialized legal or engineering products. The boundary map is intended to show the county outline, settlements, major roads, railways, and visible streams at a useful overview scale. The city map uses straight-line connections for orientation. The water map highlights named waterways and surface-water features, and the elevation map summarizes relative terrain height across the county. Together they are well suited to classroom work, local research, travel orientation, presentations, and printed county references.
Tasks involving exact parcel ownership, legal boundaries, flood insurance determinations, construction elevations, or current driving conditions require more specialized sources. The high-resolution JPG files are valuable because they preserve the labels and terrain detail at a larger size than the web previews, but larger image dimensions do not change the intended accuracy of the underlying map. Use the maps for geographic understanding, then follow the reference links below when a question requires official source data.
Frequently Asked Questions
How far is Montpelier from Hartford City on the city map?
The city-connection map labels Montpelier at about 8 miles from Hartford City. That is a straight-line distance, not a driving distance. The actual road trip depends on the route used, while the map’s connecting line is meant to show relative direction and separation inside the county.
Which map is best for finding Prairie Creek and Big Lick Creek?
Use the terrain-and-water map. Prairie Creek is prominent in the north-central part of the county, and Big Lick Creek is labeled in the southern half. The same map also shows Little Lick Creek, Little Joe Creek, Walnut Creek, Lake Placid, Lake Mohee, and several smaller drainage features.
Can the elevation map be used for surveying or construction grades?
No. The map is a generalized county-scale elevation reference. It shows an overall range of about 234–292 meters and is useful for comparing higher and lower areas, but it does not provide survey-grade elevations for individual sites. Engineering and construction work should use original elevation data and appropriate field measurements.
Map File Information
The maps used on this page are available together as high-resolution JPG files for printing, close inspection, or offline reference.
- Included Files: general county map, city-connection map, terrain and water map, elevation map
- Printable Size: 2572 × 3638 px for each map
Related Maps
Sources and References
- Blackford County official Community page – local overview of Hartford City, Montpelier, Shamrock Lakes, and the county
- U.S. Census Bureau QuickFacts: Blackford County, Indiana – official county statistics
- Indiana Department of Transportation Maps – official Indiana road and transportation map resources
- USGS National Hydrography – official hydrography reference
- USGS 3D Elevation Program – official elevation data reference
Green Map creates custom-edited map images using open geographic data sources such as geoBoundaries, Natural Earth, OpenStreetMap, and government open data.
These maps are edited visual materials, not raw data files, and are provided for education, documents, presentations, and graphic reference.