Warren County sits in western Illinois, with Monmouth near the middle of the county and smaller communities spread north, west, and south of it. The maps on this page bring together the county boundary, principal roads, Monmouth, Alexis, Little York, Kirkwood, Roseville, a dense network of creeks, and the local elevation pattern. You can study the maps online and download the matching high-resolution JPG files in one ZIP package for printing or reference.
Monmouth is the easiest place to use as an orientation point. Several important routes meet or pass through the city, while the surrounding countryside is crossed by many small waterways. The elevation map adds another layer that is not obvious from the road map alone: Warren County is not a perfectly flat rectangle. Broad uplands are cut by creek valleys, with lower ground particularly easy to recognize in the northern and southeastern drainage corridors.
Rather than treating the maps as four versions of the same picture, it is more useful to match each one to a question. The general county map works best for roads, towns, and boundary context. The city-connection map simplifies the relationship between Monmouth and several nearby communities. The terrain-and-water map makes named creeks and small lakes easier to follow, while the elevation map shows how those valleys sit within higher surrounding ground. Read together, they provide a practical geographic overview of Warren County.
Table of Contents
Monmouth as the road and location reference point
On the general county map, Monmouth appears close to the center of Warren County and occupies the largest clearly marked built-up area. The Warren County Courthouse label is shown just to the east of the city, reinforcing Monmouth’s role as the county seat. The county’s own website also identifies Monmouth as the seat of government. For a visitor who does not already know the area, starting at Monmouth makes it much easier to understand where the other labeled communities and routes sit.
Route numbers give the map a strong directional framework. Route 34 crosses the Monmouth area from west to east, while 67 comes down from the north toward the city. Route 164 continues eastward across the central part of the county. Farther south, 116 runs through the Roseville area, and 110 is labeled on the north-south road south of Roseville. On the western side of the county, 94 and 135 appear near Little York. These lines are useful for regional orientation, but this page is not intended to replace a current navigation map for turn-by-turn driving.
The county boundary becomes more meaningful when the neighboring counties are visible. Mercer County is labeled to the north, Knox County to the east, and Henderson County to the west. Fulton County and McDonough County appear along the southwestern and southern sides. Seeing those names around Warren County helps place it within western Illinois and also explains why communities near the edge of the county may relate closely to places outside Warren County.
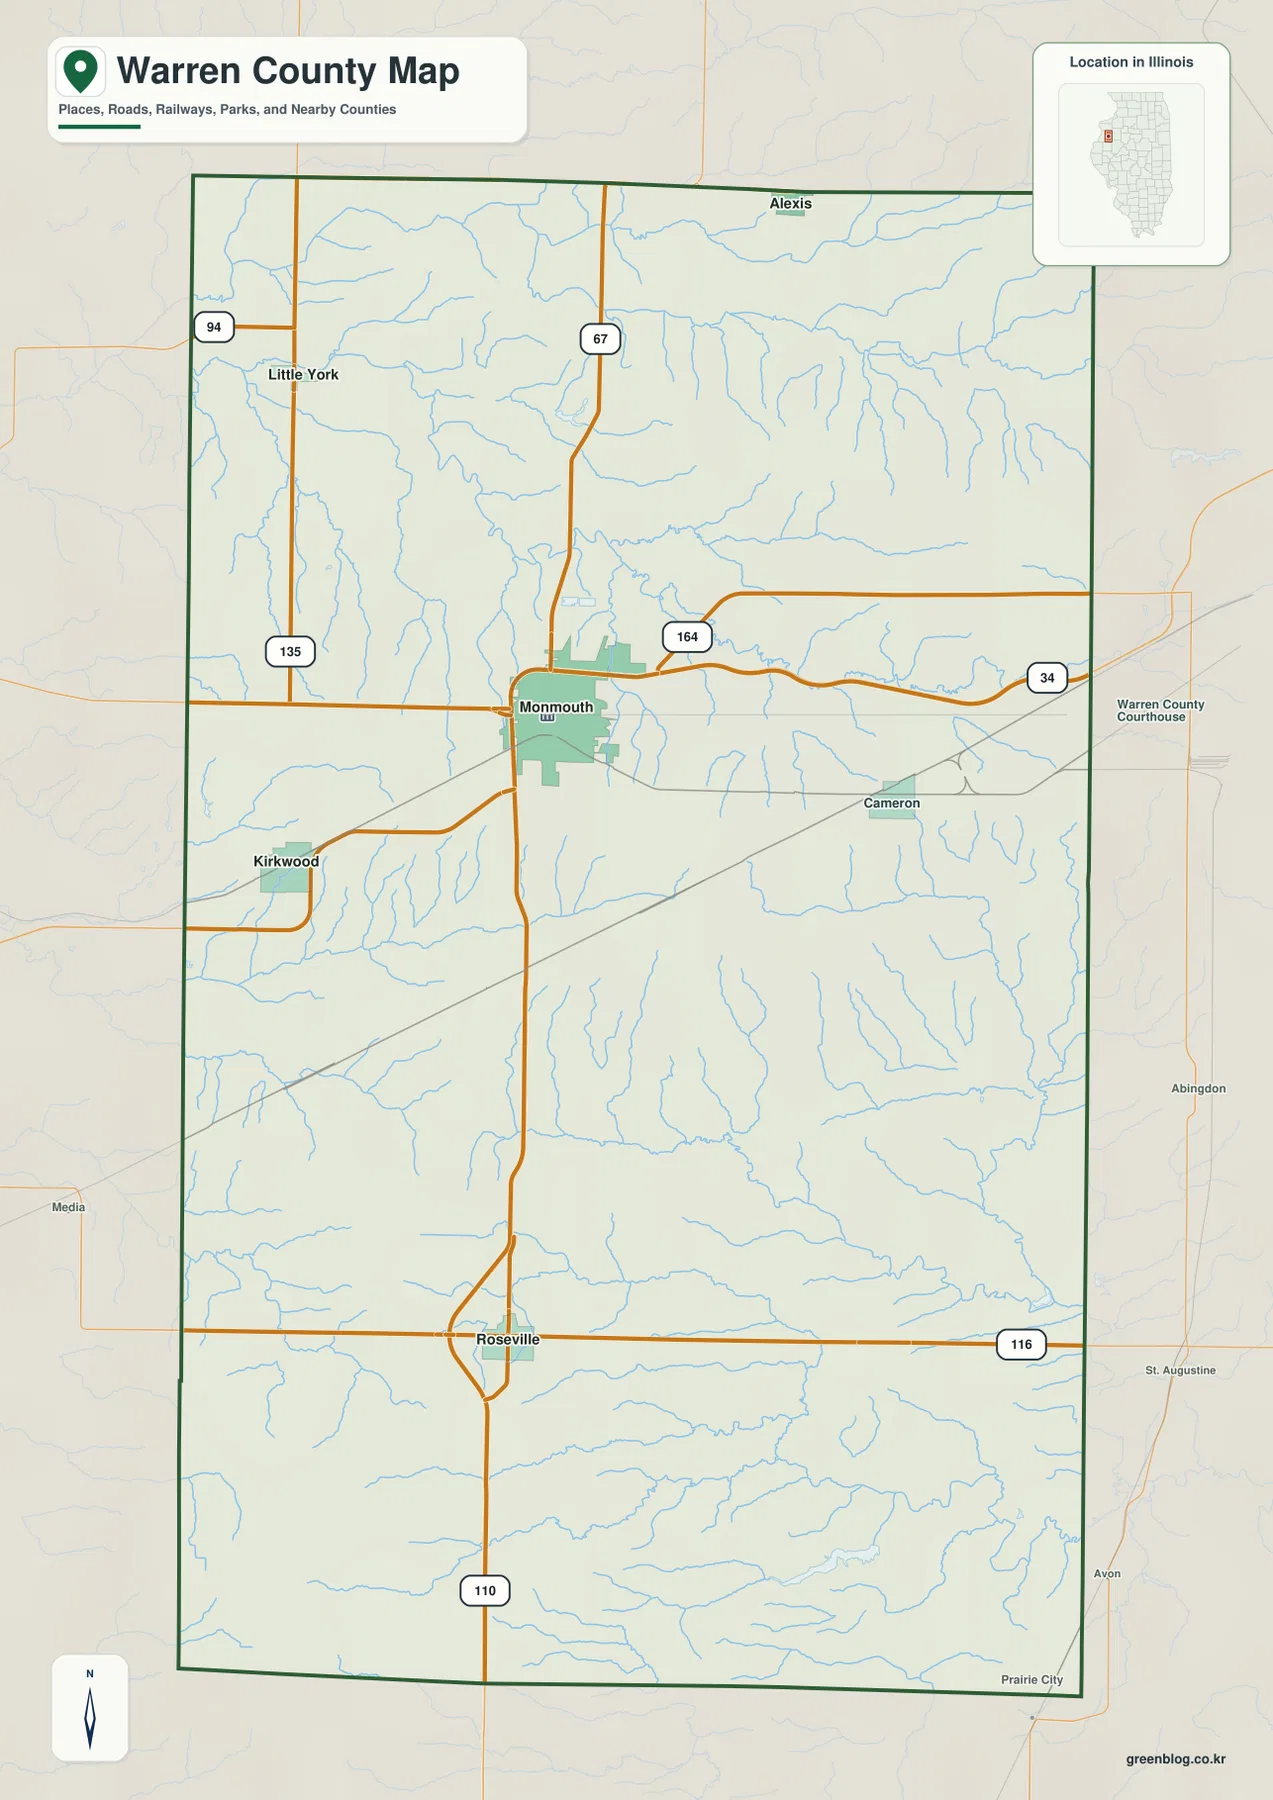
The map also makes the internal spacing of communities easy to see. Kirkwood lies west-southwest of Monmouth, Cameron is to the east, and Roseville is much farther south. Alexis and Little York are both in the northern half of the county but are separated from one another, with Little York closer to the western side. This broad distribution is important because Warren County does not read as one continuous urban area. The named communities are islands of settlement within a much larger rural landscape crossed by roads and streams.
From Alexis and Little York south to Roseville
The city-connection map strips away some detail so the relationship between Monmouth and four surrounding communities stands out. Alexis is placed to the north, Little York to the northwest, Kirkwood to the west-southwest, and Roseville to the south. Because Monmouth is near the middle of this group, it works naturally as the hub for comparing where these towns sit within the county. The pattern is more useful than a simple alphabetical list because it shows the direction of travel at a glance.
The connector values on this map are straight-line distances, not driving distances. From Monmouth, the map shows Kirkwood at about 6 miles, Little York at about 8 miles, Alexis at about 11 miles, and Roseville at about 13 miles. A road trip between the same places can be longer because roads do not follow a perfectly straight path and the exact start and end points matter. Use these numbers to compare relative spacing, then use a current road map or navigation service when planning an actual drive.
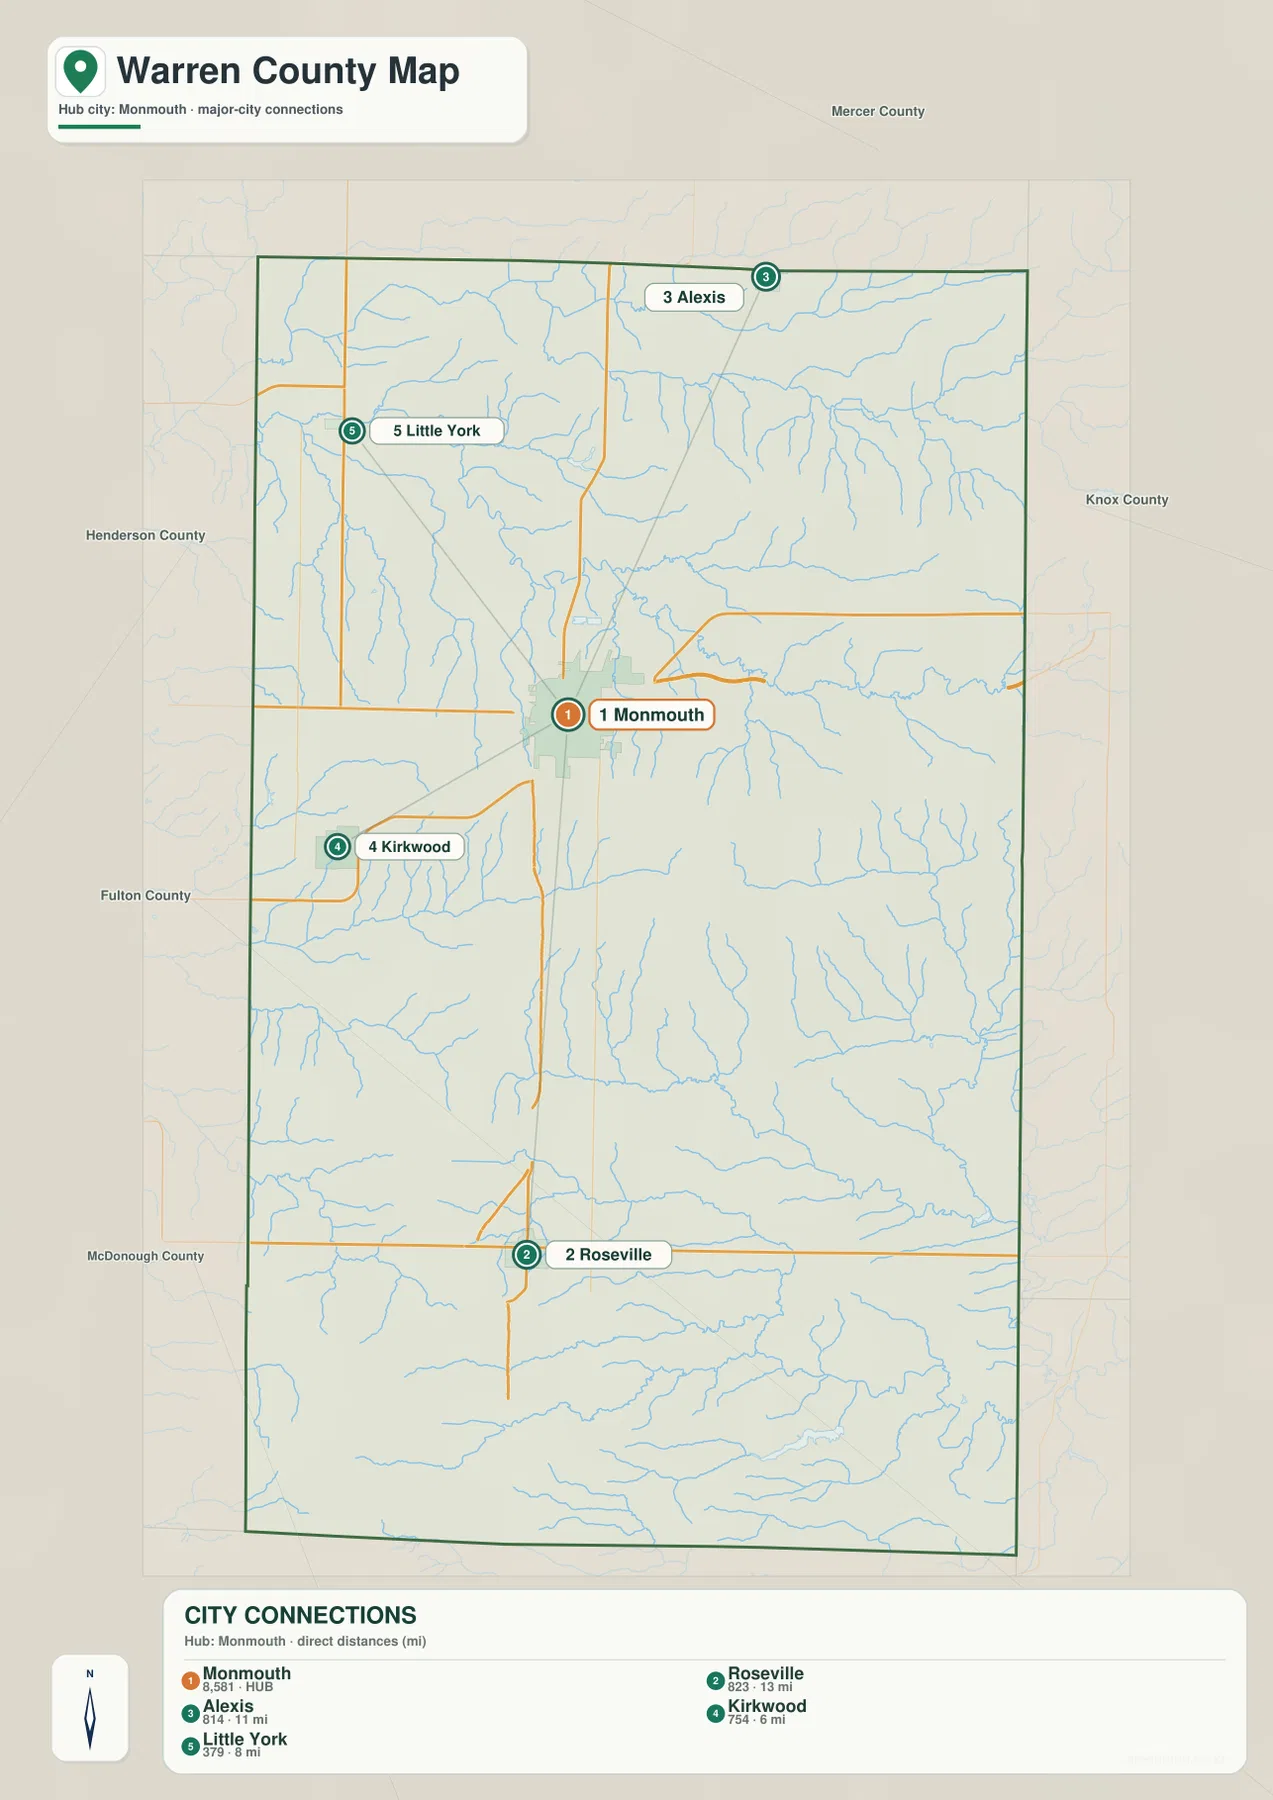
This simplified view also highlights how much of the eastern and southeastern county lacks a large labeled settlement on this particular map. That does not mean the area is empty; it means the selected hub-and-community view is focused on the named places shown in the package. In those less urban-looking portions, the stream network becomes more visually prominent. When you return to the general county map, the roads and small waterways fill in the geographic context that the city-connection map intentionally leaves in the background.
The neighboring-county labels are useful here as well. Alexis lies near the Mercer County side, Little York is closer to Henderson County, and the southern portion of Warren County approaches McDonough County. This makes it easier to understand why a community can be relatively close to a county line even though Monmouth remains the main central reference point. For regional map reading, those edge relationships are often as useful as the distance from the county seat itself.
Henderson Creek and the branching water network
The terrain-and-water map reveals a county shaped by many creeks rather than one dominant river or large lake. Henderson Creek and Middle Henderson Creek are prominent in the north. Cedar Creek and Talbot Creek appear farther south in the north-central portion, and South Henderson Creek crosses the middle-to-southern part of the county. In the south, Swan Creek and numerous smaller tributaries form another branching system. These named waterways explain many of the narrow valleys that become even clearer on the elevation map.
Henderson Creek is especially useful as a northern reference. It bends across the upper part of the county while smaller drainage lines feed toward it from surrounding ground. Cedar Creek has a more winding course in the north-central area. The map’s subtle terrain shading helps show that the creeks are not simply blue lines drawn across a flat surface: they follow lower corridors cut into broader uplands. This relationship between water and relief is one of the most distinctive things to notice in the Warren County map set.
Several small water bodies are labeled as well. Lake Warren and Winbigler’s Pond appear in the northern half of the county, Citizens Lake is closer to the central-western area, and Little Swan Lake is in the south. None dominates the county at the scale of this map, but each provides a useful local landmark. When combined with creek names, these labels can help a reader connect recreational or local place references with the larger drainage network.
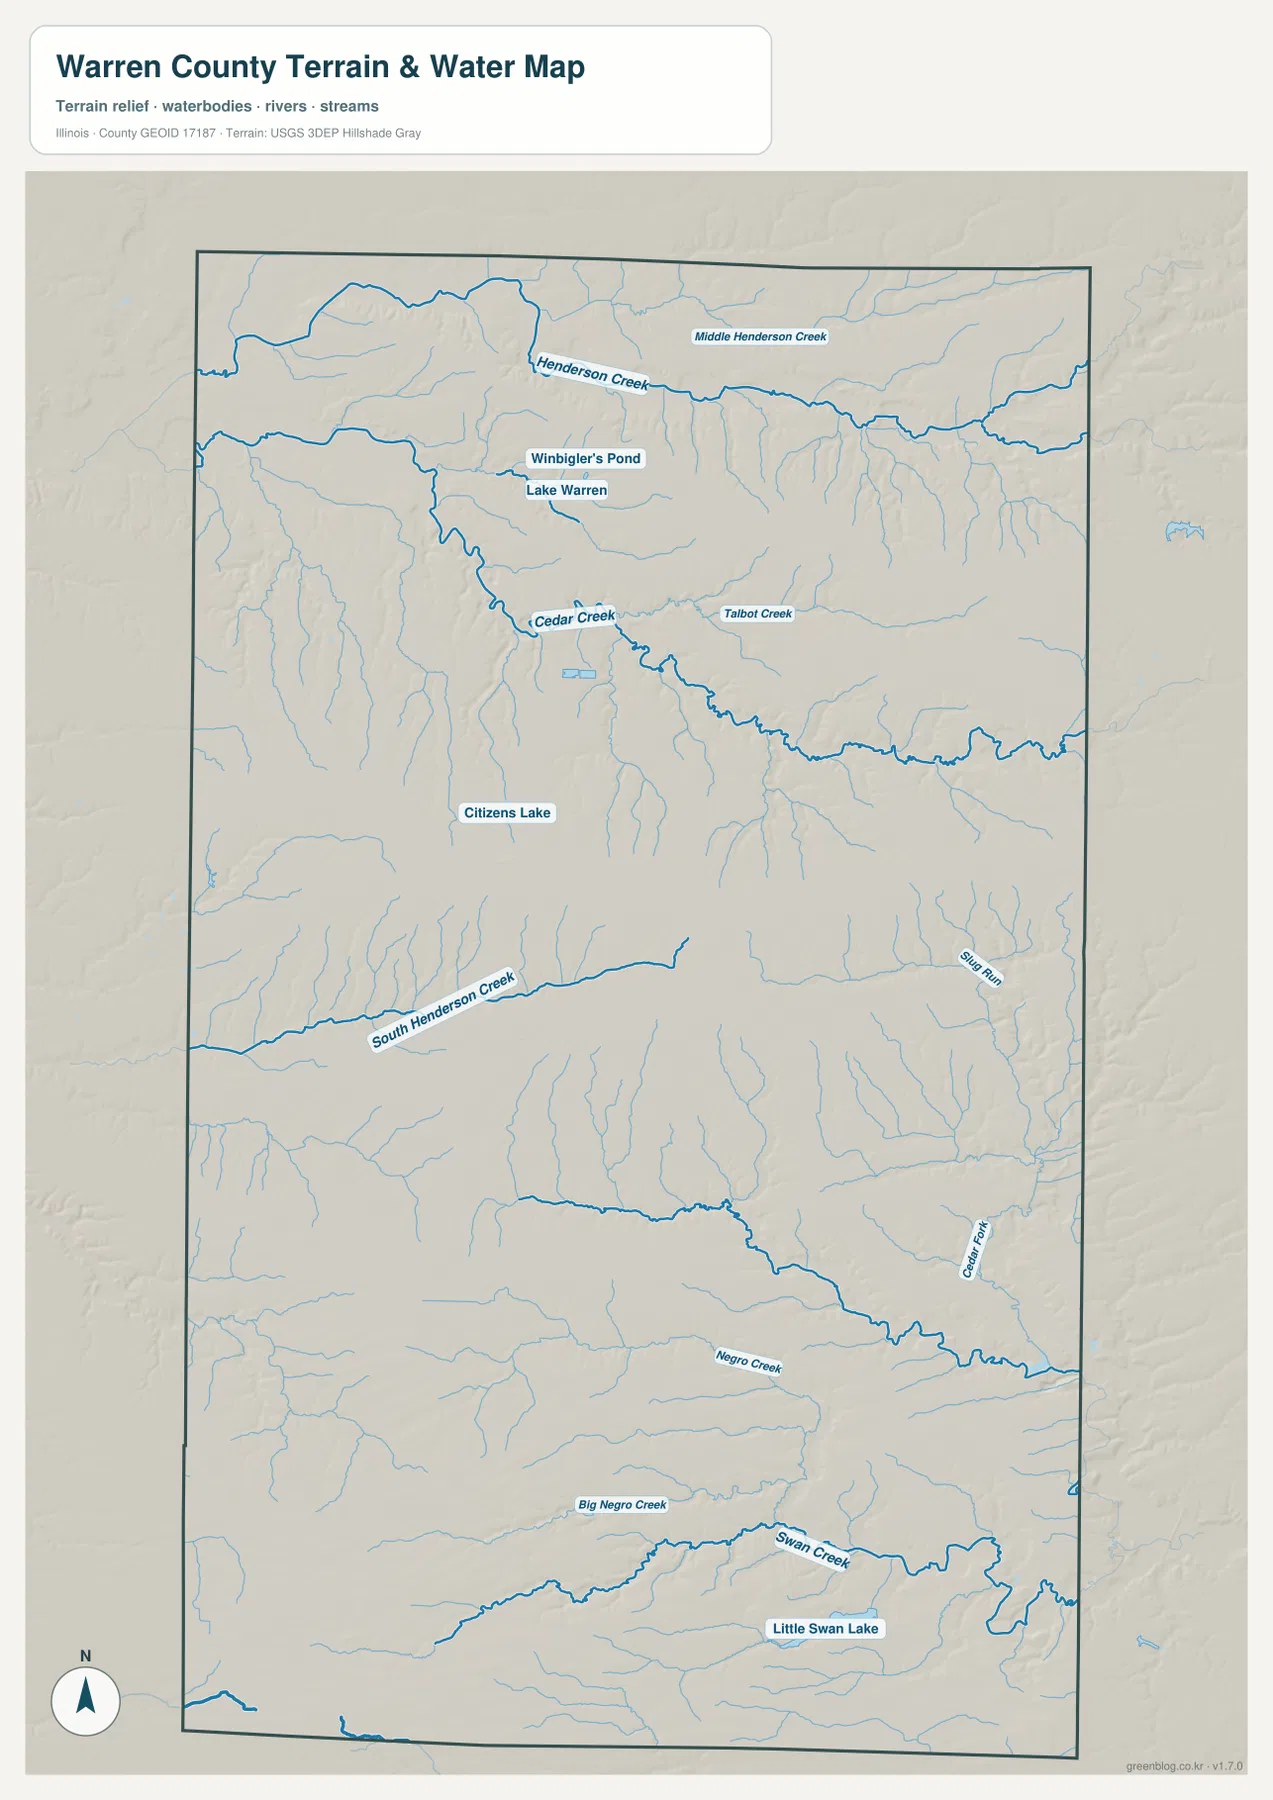
This is a reference map for geographic context, not a flood-risk, property-boundary, or navigation product. A creek shown here should not be used by itself to decide whether a property floods, where a legal water boundary lies, or whether a channel is suitable for travel. For those questions, use the appropriate official flood, parcel, or field data. The strength of this map is simpler: it shows where the named creeks and water bodies are and how their courses fit within Warren County.
Elevation from about 156 to 246 meters
The elevation map makes Warren County’s local relief much easier to see. Its legend gives an actual elevation range of roughly 156 to 246 meters, with a mean near 219 meters. Greens mark lower ground, while tan and brown tones represent higher terrain. A broad band of higher ground crosses much of the central county, and another elevated area is evident toward the southwest. Lower green corridors appear along several stream valleys, especially in the north and southeast.
The northern edge has a strong contrast between lower green terrain in the northwest and higher ground toward the northeast. Across the center, the surface is not a single ridge but a series of uplands cut by narrow drainage valleys. If you compare this map with the terrain-and-water map, the link becomes straightforward: many of the thin green indentations line up with the creek network. The same pattern continues in the southeast, where branching streams occupy lower ground between higher areas.
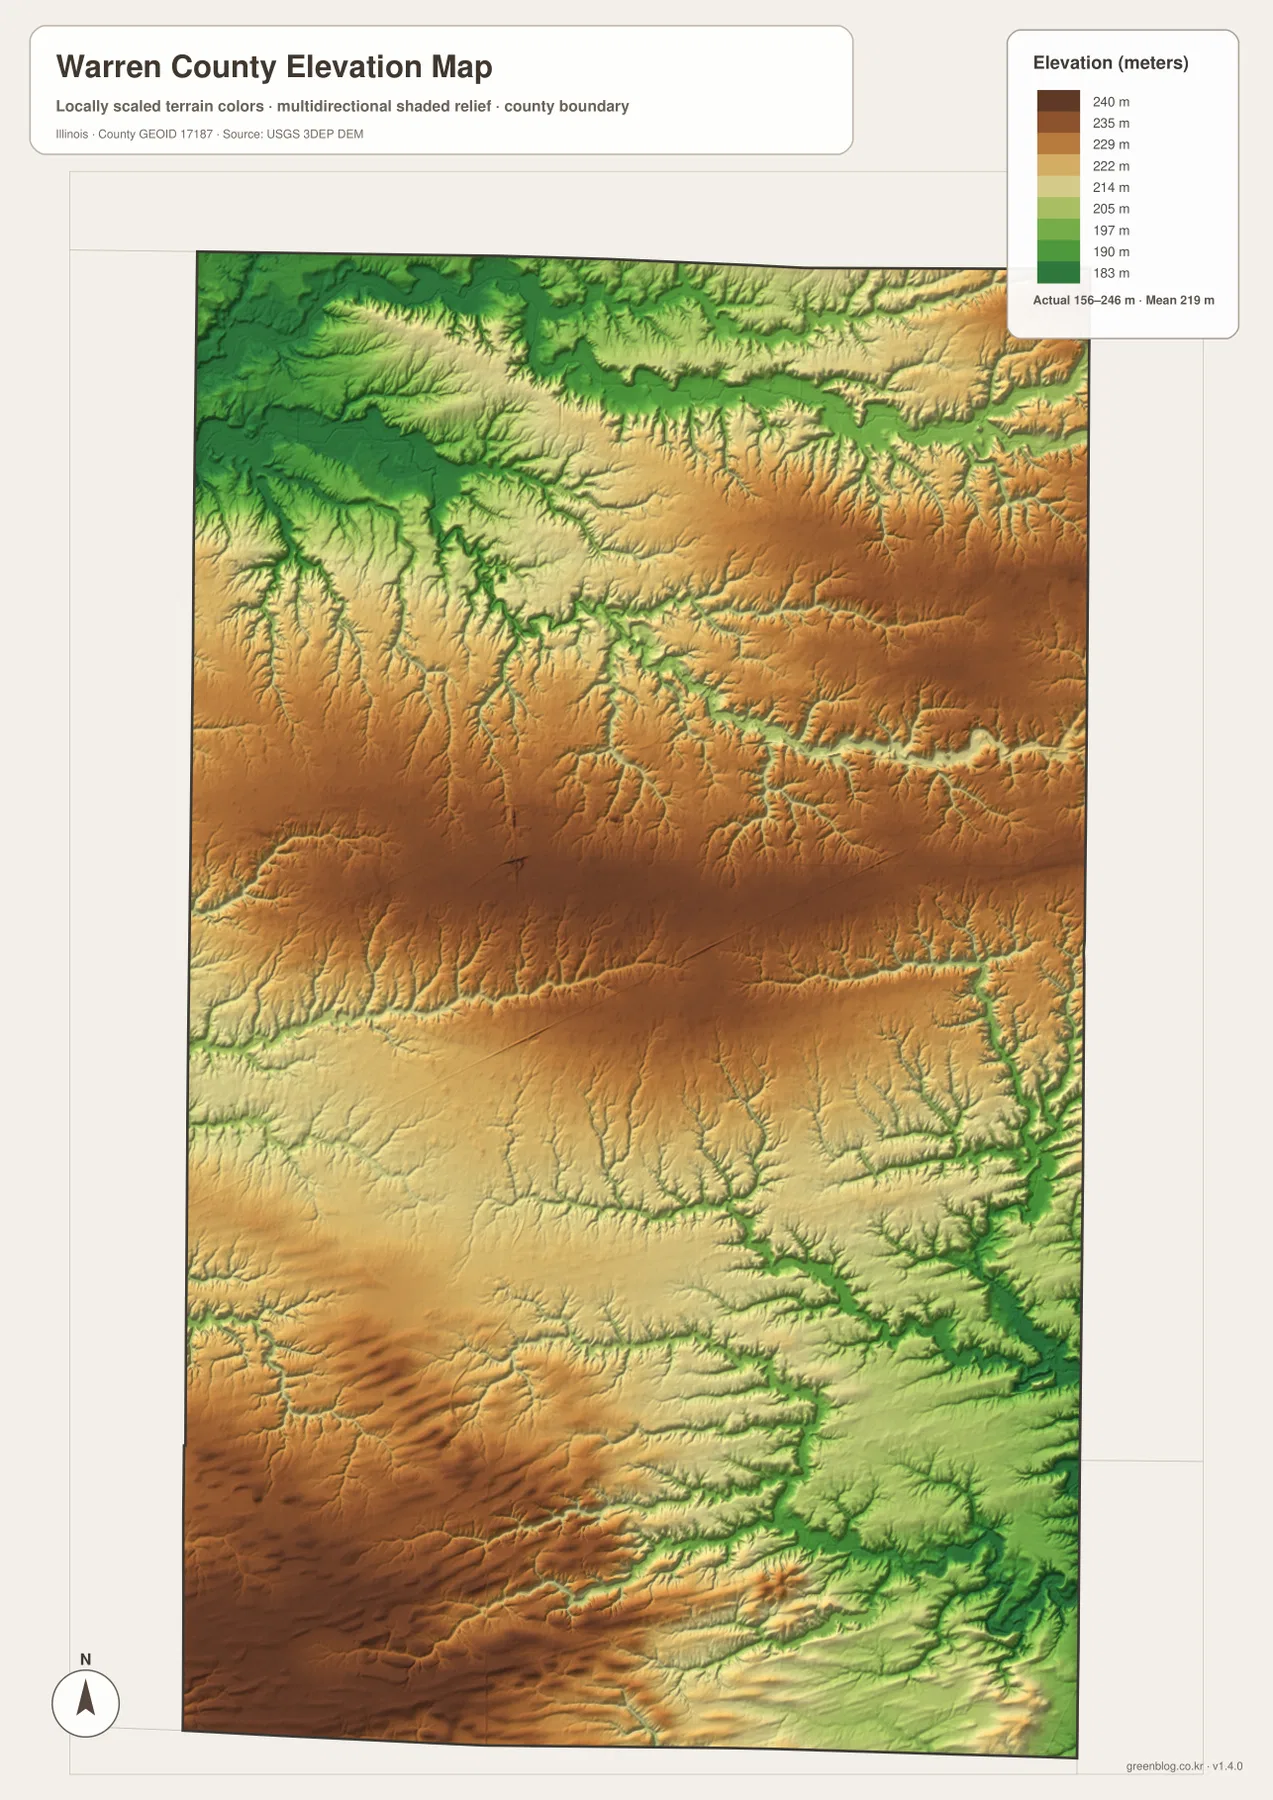
Putting the settlement map beside the elevation map adds useful context. Monmouth occupies neither the deepest valley nor an isolated high summit; instead, it sits among gently varying uplands and drainage cuts. North toward Alexis and Little York, lower stream corridors become more noticeable. South of Roseville and into the southwestern part of the county, higher colors return before the terrain drops again along southeastern waterways. This is a better description of Warren County’s relief than simply calling the entire county flat.
The elevation surface is based on USGS 3D Elevation Program data and is generalized for county-scale viewing. It is appropriate for comparing broad height differences and recognizing valleys, but it is not survey-grade data for a building site, engineering design, drainage calculations, or legal work. Those uses require more precise measurements and project-specific sources. Here, the value of the map is in showing how the creek network is set into the surrounding terrain.
Choosing the most useful Warren County map
Start with the general county map when you need a named place, a numbered route, or a quick sense of the county boundary. Monmouth is the natural anchor, and from there you can trace routes toward Kirkwood, Roseville, Alexis, Little York, and Cameron. The neighboring county names also make the map useful when a trip, study area, or local reference extends beyond Warren County itself.
Use the city-connection map when relative distance matters more than road detail. Its hub format quickly shows which selected communities are closest to Monmouth and which are farther away. Because the lines represent straight-line distance, the map is especially useful for comparing spatial relationships rather than calculating travel time. If a route choice matters, switch back to the general road map after you understand the basic direction.
For natural features, the terrain-and-water map and elevation map work best as a pair. The water map gives you the names and courses of Henderson Creek, Cedar Creek, South Henderson Creek, Swan Creek, and smaller drainage lines. The elevation map then shows the low corridors and higher ground around them. Looking at both avoids the common mistake of seeing a creek as an isolated line without understanding the valley through which it runs.
The body images are optimized for web viewing. For printing, classroom handouts, presentations, or closer inspection on a large screen, use the high-resolution JPG files in the download package below. The maps emphasize different aspects of the same county, so the best choice depends on the task: roads and places, town spacing, waterways, or relief. When a project involves more than one of those topics, using two maps together usually communicates the county more clearly than trying to make one map do everything.
Frequently Asked Questions
Are the Monmouth-to-Alexis, Little York, Kirkwood, and Roseville distances road distances?
No. The city-connection map uses straight-line distances from Monmouth. It shows Kirkwood at about 6 miles, Little York at about 8 miles, Alexis at about 11 miles, and Roseville at about 13 miles. Actual driving distances can be longer because roads curve, intersections change the route, and your exact starting and ending points may differ.
Which map best shows Warren County’s creek valleys?
Use the terrain-and-water map first to locate named waterways such as Henderson Creek, Cedar Creek, South Henderson Creek, and Swan Creek. Then compare those lines with the elevation map. Many creek courses align with lower green corridors, making the relationship between drainage and terrain much easier to see. Neither map should be treated as a flood-risk or engineering map.
Does the download contain the same maps shown in the article?
Yes. The ZIP contains high-resolution JPG files corresponding to the general county map, city-connection map, terrain-and-water map, and elevation map shown above. The article uses smaller WebP versions for efficient web viewing, while the downloadable JPG files are better suited to printing and larger displays.
Map File Information
The ZIP package contains the high-resolution JPG versions of the Warren County general map, city-connection map, terrain-and-water map, and elevation map. Review the web maps above, then download the original-size files when you need a printable or larger reference copy.
- Included Files: 4 high-resolution JPG maps
- Printable Size: 2572 × 3638 px each
Related Maps
Sources and References
For county information and the official boundary, hydrography, and elevation data used as reference points for these maps, see the following sources.
- Warren County, Illinois official website — county government and local information
- Warren County official Monmouth page — county-seat and community information
- U.S. Census Bureau TIGER/Line Shapefiles — county boundary and geographic reference data
- USGS National Hydrography — streams and water features
- USGS 3D Elevation Program — elevation and terrain data
Green Map creates custom-edited map images using open geographic data sources such as geoBoundaries, Natural Earth, OpenStreetMap, and government open data.
These maps are edited visual materials, not raw data files, and are provided for education, documents, presentations, and graphic reference.