UNESCO Institute for Statistics (UIS) observations for 2023 show a strongly concentrated destination pattern for internationally mobile tertiary students whose country of origin is Pakistan. The United Kingdom is the largest reported destination with 34,440 students. Australia follows with 16,971, while the United States is third at about 9,576. Those three destinations together account for 56.4% of the sum across the 70 country and area observations used in this comparison.
The 70 reported values add to approximately 108,052 students. That sum is useful for describing how the observed destination distribution is divided, but it is not treated here as an exhaustive worldwide total for every Pakistan-origin student abroad in 2023. Destinations not present in the table are not filled with zero, and all concentration shares below use only the observed 70-row sum as the denominator.
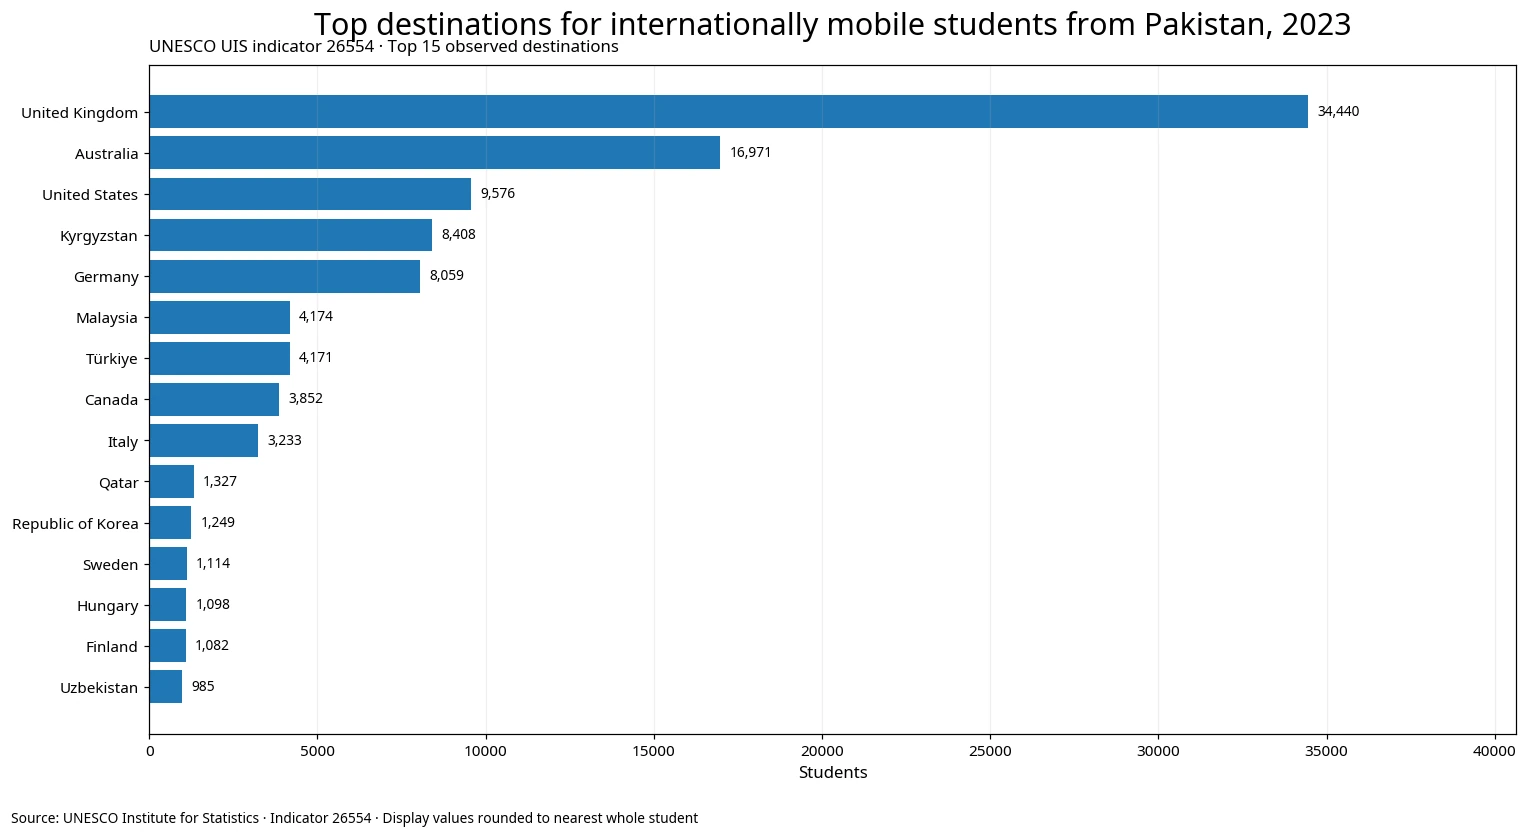
Table of Contents
The United Kingdom alone accounts for nearly one third of the observed sum
The United Kingdom represents 31.9% of the 70-row sum. Adding Australia raises the combined share of the two largest destinations to about 47.6%. With the United States included, the top three reach 56.4%. This concentration is the clearest feature of the 2023 cross-section: a relatively small set of destinations contains most of the observed student count.
There is also a noticeable step down inside the leading group. The United Kingdom reports roughly twice as many students as Australia. Australia, in turn, is more than 7,000 students above the United States. Kyrgyzstan ranks fourth with 8,408 and Germany fifth with 8,059, two values that are much closer to one another. The top five destinations together account for about 71.7% of the observed total.
These values describe where students were reported, not why they selected those destinations. The dataset does not contain tuition, visa policy, scholarship access, language, institutional partnerships, family networks, migration history or employment opportunities. Those factors may matter in real decisions, but this single indicator cannot isolate their effects. Destination size should therefore be described as an observed pattern rather than a causal ranking.
Top 15 reported destinations
The share column below uses the total of all 70 observed values. A few UIS observations include decimals, so the calculations retain the published numeric values while the chart and table display student counts rounded to the nearest whole number. This keeps the distribution calculations faithful to the source while making the public table easier to read.
| Rank | Destination | Students in 2023 | Share of 70-row sum |
|---|---|---|---|
| 1 | United Kingdom | 34,440 | 31.9% |
| 2 | Australia | 16,971 | 15.7% |
| 3 | United States | 9,576 | 8.9% |
| 4 | Kyrgyzstan | 8,408 | 7.8% |
| 5 | Germany | 8,059 | 7.5% |
| 6 | Malaysia | 4,174 | 3.9% |
| 7 | Türkiye | 4,171 | 3.9% |
| 8 | Canada | 3,852 | 3.6% |
| 9 | Italy | 3,233 | 3.0% |
| 10 | Qatar | 1,327 | 1.2% |
| 11 | Republic of Korea | 1,249 | 1.2% |
| 12 | Sweden | 1,114 | 1.0% |
| 13 | Hungary | 1,098 | 1.0% |
| 14 | Finland | 1,082 | 1.0% |
| 15 | Uzbekistan | 985 | 0.9% |
The Republic of Korea is eleventh with 1,249 students, equal to about 1.2% of the observed sum. It sits between Qatar at 1,327 and Sweden at about 1,114. That places it inside the top-15 group, but its scale is far below the three largest destinations and it is not the organizing center of the global comparison.
A median of 158.5 tells a different story from the mean of 1,543.6
The simple mean across the 70 destinations is about 1,543.6 students, while the median is only 158.5. The mean is approximately 9.7 times the median because the largest observations pull the arithmetic average upward. For a distribution this skewed, saying that an ‘average destination’ has around 1,544 students would give a misleading impression of what most rows look like.
Only 14 destinations have at least 1,000 students. By contrast, 32 destinations are below 100 and 16 are at 10 or fewer. The top ten destinations account for about 87.2% of the observed sum. These figures describe a long-tail distribution in which a small group of major destinations coexists with many much smaller reported destinations.
Small differences at the bottom of the table should not carry the same interpretive weight as the gaps near the top. A difference between one and two reported students may be statistically fragile or administratively sensitive, whereas the tens-of-thousands scale of the United Kingdom and the concentration of the top ten are unmistakable features of this cross-section. The ranking is most useful when read as a set of scale bands rather than as a precise league table from first to seventieth.
The leading destinations span several world regions
The top 15 include European destinations such as the United Kingdom, Germany, Italy, Sweden, Hungary and Finland; Australia in Oceania; the United States and Canada in North America; Kyrgyzstan and Uzbekistan in Central Asia; Malaysia in Southeast Asia; Türkiye and Qatar; and the Republic of Korea in East Asia. The destination network is geographically broad even though the student counts are numerically concentrated.
Kyrgyzstan’s fourth-place value of 8,408 is especially useful for avoiding an overly simple picture centered only on traditional English-speaking study destinations. Malaysia and Türkiye each exceed 4,000 students, and Qatar is above 1,300. The observed distribution therefore includes several substantial destinations outside the United Kingdom, Australia, the United States, Canada and continental Western Europe.
Geographic breadth and numerical concentration can exist at the same time. The leading 15 destinations are spread across multiple regions, yet the United Kingdom and Australia alone contain almost half of the observed sum. The data support both statements: the network has diverse destinations, and most of the reported students are still concentrated in a relatively small number of them.
Internationally mobile students are not simply all foreign citizens
UIS defines internationally mobile students as people who physically cross an international border for education and study in a destination country that differs from their country of origin. For tertiary students, the preferred origin concept is the country where the student obtained the upper-secondary qualification used before entering tertiary education.
When that criterion cannot be applied, usual or permanent residence may be used, and citizenship is recommended only as a last-resort proxy. That means ‘students from Pakistan’ in this indicator should not automatically be treated as exactly the same population as ‘Pakistani citizens abroad.’ The statistic is designed to capture educational mobility rather than passport status alone.
The definition also requires physical cross-border movement. A student remaining in the origin country while taking a foreign institution’s distance-learning program is not counted as internationally mobile on that basis. The word ‘inbound’ in the indicator title is from each destination system’s perspective: the United Kingdom row means Pakistan-origin mobile students enrolled in the United Kingdom, not students from the United Kingdom studying in Pakistan.
Why the 70-row sum is not a complete worldwide total
International student mobility statistics are built from destination-country reporting about where students came from. This extract contains 70 country and area observations with values for 2023, but absence from the extract cannot safely be converted into a value of zero. Reporting availability, statistical systems and timing can differ across destinations.
For that reason, the approximately 108,052-student sum is used only as the total of the observed rows. It supports internally consistent statements such as the United Kingdom representing 31.9%, the top three representing 56.4%, or the top ten representing 87.2% of this extract. It should not be relabeled as an exhaustive official count of all Pakistan-origin tertiary students worldwide without a separate total indicator that establishes full coverage.
A 2023 cross-section compares destination size, not change over time
All rows use the same 2023 reference year, which makes the dataset suitable for comparing destination size at a common point in time. The United Kingdom, Australia, the United States, Kyrgyzstan and Germany can be compared without mixing observations from different years.
A one-year cross-section cannot establish a trend. It does not show whether the United Kingdom gained students relative to 2022, whether Australia’s share has been rising, or whether policy changes caused Kyrgyzstan’s observed value. Those questions require comparable time-series observations and, for causal claims, separate evidence about the policies or conditions being evaluated.
The ‘both sexes’ label means male and female students are combined in the reported count. This series is therefore not a gender-balance measure. Any analysis of male or female representation would require sex-disaggregated observations or a separate gender indicator. Here the values are used only to compare the total reported scale across destinations.
Data source and calculation method
The country values come from UNESCO Institute for Statistics indicator 26554, “Inbound internationally mobile students from Asia: Students from Pakistan, both sexes (number),” using the 2023 NATIONAL observations in this comparison. The interpretation of student mobility follows the UIS Data Browser glossary and UIS education-statistics methodology.
- UNESCO UIS official API — indicator 26554
- UNESCO UIS Data Browser Glossary — internationally mobile students
The rankings, observed total, mean, median and concentration shares are calculated directly from the 70 non-missing observations. Published decimal values are retained for calculations and rounded only for the student-count labels shown in the chart and table. No absent destination is zero-filled and no missing country value is estimated.
The strongest conclusions supported by this dataset are therefore about relative destination size, concentration and the shape of the 2023 distribution. Questions about individual student motives, educational quality, policy effects or a fully exhaustive world total lie outside what one cross-sectional indicator can establish. Keeping that boundary clear makes the comparison more useful rather than less.
Frequently Asked Questions
Are the country rows origins or study destinations?
They are destinations. Pakistan is fixed as the origin condition, and each country or area row reports internationally mobile tertiary students from Pakistan observed in that destination.
Is the roughly 108,000-student sum the total number of Pakistan-origin students studying abroad worldwide?
No. It is the sum of the 70 destination observations present in this comparison. Destinations without an observation cannot automatically be treated as zero.
Why do some student-count values contain decimals?
A small number of UIS observations are non-integers in the source data. Calculations retain those published values, while chart and table labels are rounded to the nearest whole student for readability.
Can the 2023 data show which destinations are gaining or losing students from Pakistan?
No. A one-year cross-section compares destination sizes at that point in time. A trend requires comparable observations across multiple years.
Related Articles
- Top Destinations for Internationally Mobile Students from Japan | 2020
- Students from the Netherlands Abroad 2021 | Top Destinations
- Russian Student Destinations in 2023 | 70 Reported Destinations
Green Map creates custom-edited map images using open geographic data sources such as geoBoundaries, Natural Earth, OpenStreetMap, and government open data.
These maps are edited visual materials, not raw data files, and are provided for education, documents, presentations, and graphic reference.