Where did Brazil-origin internationally mobile tertiary students study in 2021? UNESCO Institute for Statistics (UIS) destination data contain 70 country and area observations. Argentina is the largest destination at 22,618, followed by Portugal at 17,629, the United States at about 13,964, and Australia at 8,486. The observations sum to about 85,404, and the three largest destinations account for 63.5% of that observed sum.
The official indicator title begins with ‘Inbound internationally mobile students,’ but the origin condition is fixed at students from Brazil and each row is a destination. Argentina’s value of 22,618 therefore represents Brazil-origin internationally mobile tertiary students enrolled in Argentina. It is not the number of Argentina-origin students studying in Brazil and not Argentina’s total international-student population.
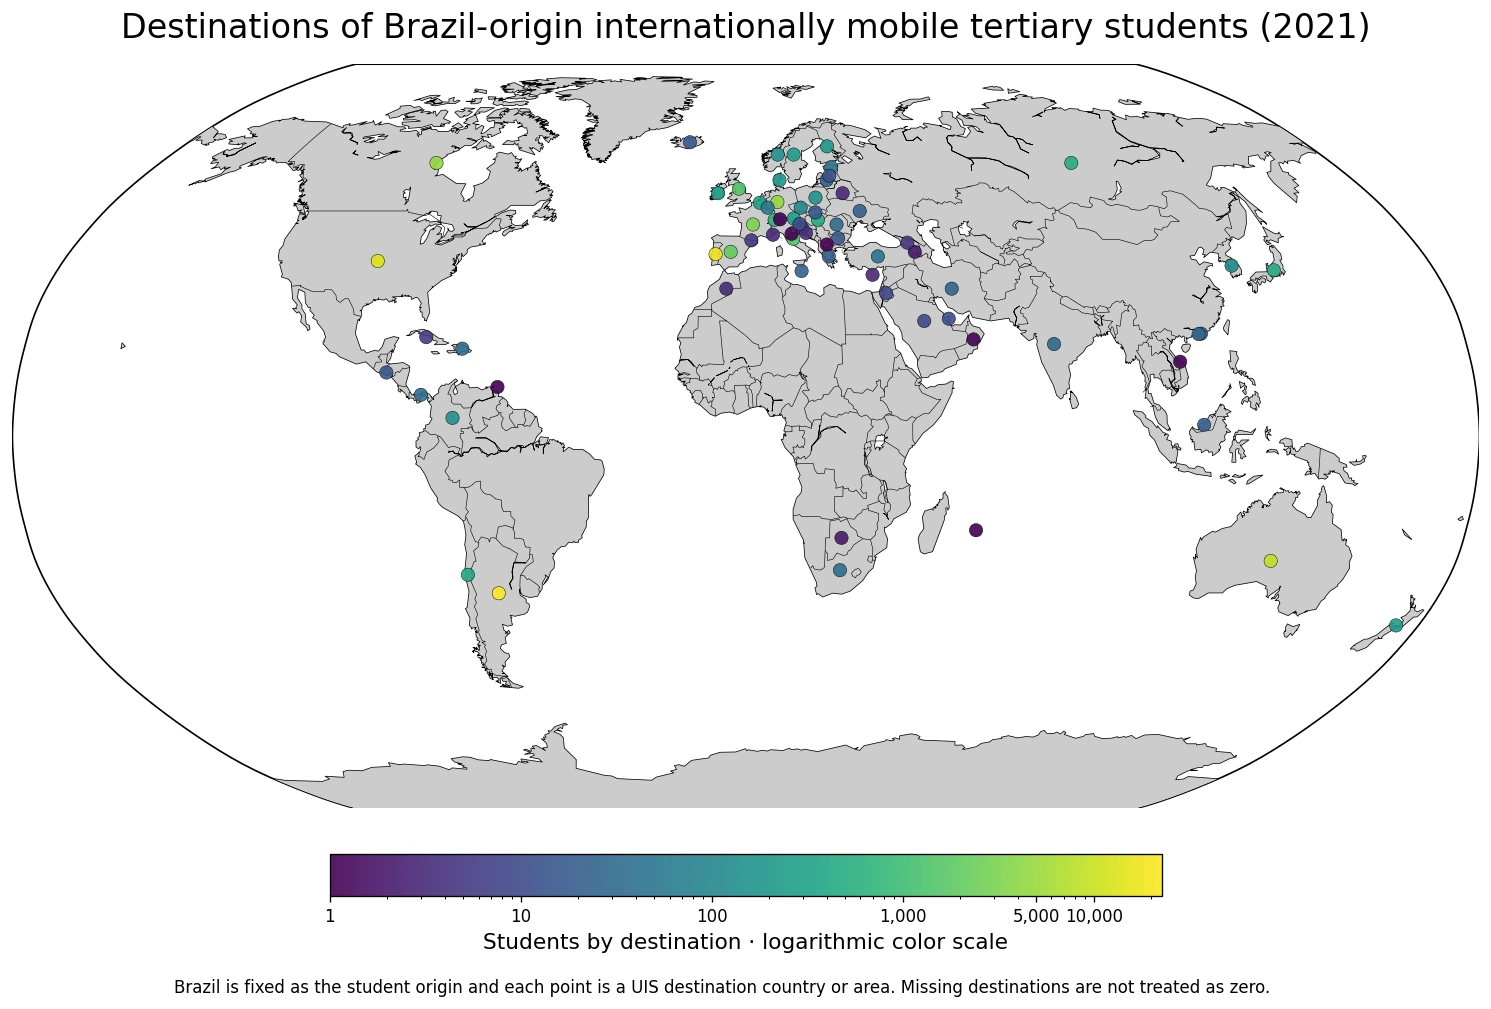
Table of Contents
Argentina, Portugal and the United States account for 63.5% of the observed sum
Argentina records 22,618 students, Portugal 17,629, and the United States about 13,964. Together they account for 63.5% of the sum across the 70 destinations. Adding Australia and Germany brings the top-five share to 78.8%, while the top ten reach 93.6%.
Argentina and Portugal alone sum to about 40,247, or 47.1% of the observed total. Argentina is a neighbouring South American destination and Portugal shares Portuguese with Brazil, but the count dataset does not establish distance or language as causal drivers. Admissions, programmes, cost, migration pathways and personal networks require separate evidence.
| Rank | Destination country or area | Brazil-origin internationally mobile students |
|---|---|---|
| 1 | Argentina | 22,618 |
| 2 | Portugal | 17,629 |
| 3 | United States of America | about 13,964 |
| 4 | Australia | 8,486 |
| 5 | Germany | 4,610 |
| 6 | Canada | 4,473 |
| 7 | France | 3,216 |
| 8 | Spain | 1,990 |
| 9 | Italy | 1,472 |
| 10 | United Kingdom of Great Britain and Northern Ireland | 1,463 |
| 11 | Switzerland | 631 |
| 12 | Hungary | 475 |
| 13 | Russian Federation | 453 |
| 14 | Japan | 448 |
| 15 | Chile | 391 |
Four major English-speaking destinations account for one third of the observed total
The United States, Australia, Canada and the United Kingdom together sum to about 28,386, or 33.2% of the observed total. The United States reports about 13,964, Australia 8,486, Canada 4,473 and the United Kingdom 1,463.
That makes English-speaking destinations an important cluster without proving that language alone explains the pattern. University scale, programme availability, tuition, scholarships, admissions, visa rules, employment options and personal networks can all influence destination choice.
Portugal, Germany, France and Spain are the largest European destinations
Portugal leads Europe at 17,629, followed by Germany at 4,610, France at 3,216, Spain at 1,990, Italy at 1,472 and the United Kingdom at 1,463. Switzerland records 631, Hungary 475, the Russian Federation 453, Austria about 325 and Belgium 306.
The European pattern is highly uneven. It is therefore more accurate to discuss specific destinations than to assume a uniform European mobility pattern. The dataset contains student counts, not the policy and cost variables needed to explain why one European destination is much larger than another.
The median destination has only 27 students
The median is 27 students and the mean is 1,220. The middle half of the observations lies between 6.5 and 253.0. The mean is more than 45 times the median because a few very large destinations pull the average sharply upward.
| Destination-count band | Countries or areas | Share of observations |
|---|---|---|
| Below 10 | 20 | 28.6% |
| 10–49 | 22 | 31.4% |
| 50–99 | 1 | 1.4% |
| 100–499 | 16 | 22.9% |
| 500–999 | 1 | 1.4% |
| 1,000–4,999 | 6 | 8.6% |
| 5,000–9,999 | 1 | 1.4% |
| 10,000–49,999 | 3 | 4.3% |
3 destinations are at or above 10,000, 1 fall between 5,000 and 9,999, and 6 between 1,000 and 4,999. At the other end, 42 destinations are below 50, including 20 below 10. Brazil-origin mobility reaches many countries, but student volumes are concentrated heavily at the top.
Internationally mobile students are not simply Brazilian citizens abroad
The UIS definition of internationally mobile students focuses on people who physically cross an international border for educational activity and study in a destination different from their country of origin. For tertiary students, the preferred origin measure is the country where the qualification leading into tertiary education was obtained.
When prior-education information is unavailable, usual residence can be used, with citizenship as a last-resort proxy. For that reason, ‘students from Brazil’ should not automatically be rewritten as a pure citizenship count. The concept is designed to capture educational mobility rather than nationality alone.
Distance learning and every form of short-term mobility are not the same measure
A student remaining in Brazil while taking an online programme from a foreign university does not physically cross a border and should not be treated as internationally mobile under this concept. Short credit mobility can also be treated differently when the academic credit remains tied to a home institution.
Indicator 26508 should therefore not be described as every Brazilian student who accesses foreign education or every person with an overseas study experience. It is a standardized tertiary-mobility measure built for destination-country comparison.
The observed sum of about 85,404 is not automatically a complete global outbound total
Adding the 70 destination observations gives about 85,404. Destination-country reporting coverage and data availability can vary, so this sum should not automatically be presented as an exhaustive count of every Brazil-origin tertiary student abroad in 2021.
The observed sum is still a consistent denominator for describing concentration within the supplied dataset. It supports the top-three, top-five and top-ten shares reported here while keeping the coverage limitation explicit. Destinations without an observation are not assigned zero.
Single-digit destinations should not be over-ranked
Oman, North Macedonia, Mauritius, San Marino, Liechtenstein, Trinidad and Tobago, and Viet Nam each record 1 student. Armenia and Botswana record 2, while Morocco, Monaco, Cyprus and Belarus record 3.
| Low-count order | Destination country or area | Students in 2021 |
|---|---|---|
| 1 | Oman | 1 |
| 2 | North Macedonia | 1 |
| 3 | Mauritius | 1 |
| 4 | San Marino | 1 |
| 5 | Liechtenstein | 1 |
| 6 | Trinidad and Tobago | 1 |
| 7 | Viet Nam | 1 |
| 8 | Armenia | 2 |
| 9 | Botswana | 2 |
| 10 | Morocco | 3 |
| 11 | Monaco | 3 |
| 12 | Cyprus | 3 |
| 13 | Belarus | 3 |
| 14 | Serbia | 4 |
| 15 | Andorra | 5 |
At this scale, a one-student change can shift the ranking substantially. The low end is more useful as evidence of a long geographic tail than as a precise hierarchy of tiny flows. Multi-year data would be more informative for deciding whether a very small destination is persistent.
Decimal values reflect statistical processing, not fractional people
A few destination observations—including the United States, Austria, Sweden and New Zealand—contain decimal values in the UIS extract. These can reflect estimation or statistical adjustment and should not be interpreted literally as fractions of a student.
The calculations retain the original decimal values, while reader-facing tables round them to the nearest student and mark approximate values where needed. This preserves the source values for concentration calculations without implying person-level precision.
A large destination count is not a ranking of education quality
Large Brazil-origin student counts in Argentina, Portugal or the United States do not directly score the quality of those education systems. System size, language, distance, programme availability, tuition, scholarships, visa rules, employment prospects and personal networks can all shape destination choice.
Indicator 26508 contains the destination distribution, not those explanatory variables. The map is therefore best used to answer where Brazil-origin mobile students are enrolled and in what volume, while causal claims require separate policy and survey evidence.
One peer destination sits above the median but far below the leading group
The Republic of Korea records 120 Brazil-origin mobile tertiary students in 2021, above the 70-destination median of 27 but far below the leading destinations. That value is a destination count, not the share of all international students in Korea who came from Brazil.
Data scope and source
The analysis uses 70 destination observations from the UNESCO Institute for Statistics official API indicator 26508 for 2021. The official topic is ‘Inbound internationally mobile students from South America: Students from Brazil, both sexes (number)’. Brazil is fixed as the origin and each row is a destination.
The observed sum is about 85,404, the median destination value is 27, and the top-three share is 63.5%. The map uses a logarithmic color scale because values span from 1 to more than 22,000, and missing destinations are not replaced with zero.
The main takeaway
The largest 2021 destinations for Brazil-origin internationally mobile tertiary students are Argentina at 22,618, Portugal at 17,629, and the United States at about 13,964. The top three account for 63.5% of the observed sum and the top ten for 93.6%, showing a highly concentrated destination structure. The indicator describes destination volumes; it does not by itself explain why students chose those destinations or rank education quality.
Frequently Asked Questions
Are the countries in this dataset origins or destinations?
They are destinations. Brazil is fixed as the student origin, and each value shows Brazil-origin internationally mobile tertiary students studying in that destination.
Does Brazil-origin mean the same thing as Brazilian citizenship?
Not necessarily. UIS prefers prior upper-secondary education to identify tertiary student origin, then usual residence, with citizenship used only as a last-resort proxy.
Is the sum across 70 destinations Brazil’s complete total abroad?
Not necessarily. It is the sum of the available 2021 destination observations and excludes destinations without an observation.
Related Articles
Green Map creates custom-edited map images using open geographic data sources such as geoBoundaries, Natural Earth, OpenStreetMap, and government open data.
These maps are edited visual materials, not raw data files, and are provided for education, documents, presentations, and graphic reference.