How similar are rural and urban students in whether their first or home language aligns with the language used for instruction by the end of lower secondary education? UNESCO Institute for Statistics (UIS) data for 2022 provide an adjusted location parity index (LPIA) for 73 countries and territories. 32 observations fall inside the commonly used 0.97–1.03 parity band, while 16 are below 0.97 and 25 are above 1.03.
The underlying SDG 4.5.2 indicator measures the percentage of students whose first or home language is the language of instruction. The UIS methodology explains that, for estimates based on international learning assessments, the language of the test is used as a proxy for the language of instruction when direct classroom-language data are unavailable. Students’ reported use of the test language at home is then used to construct the language-alignment measure.
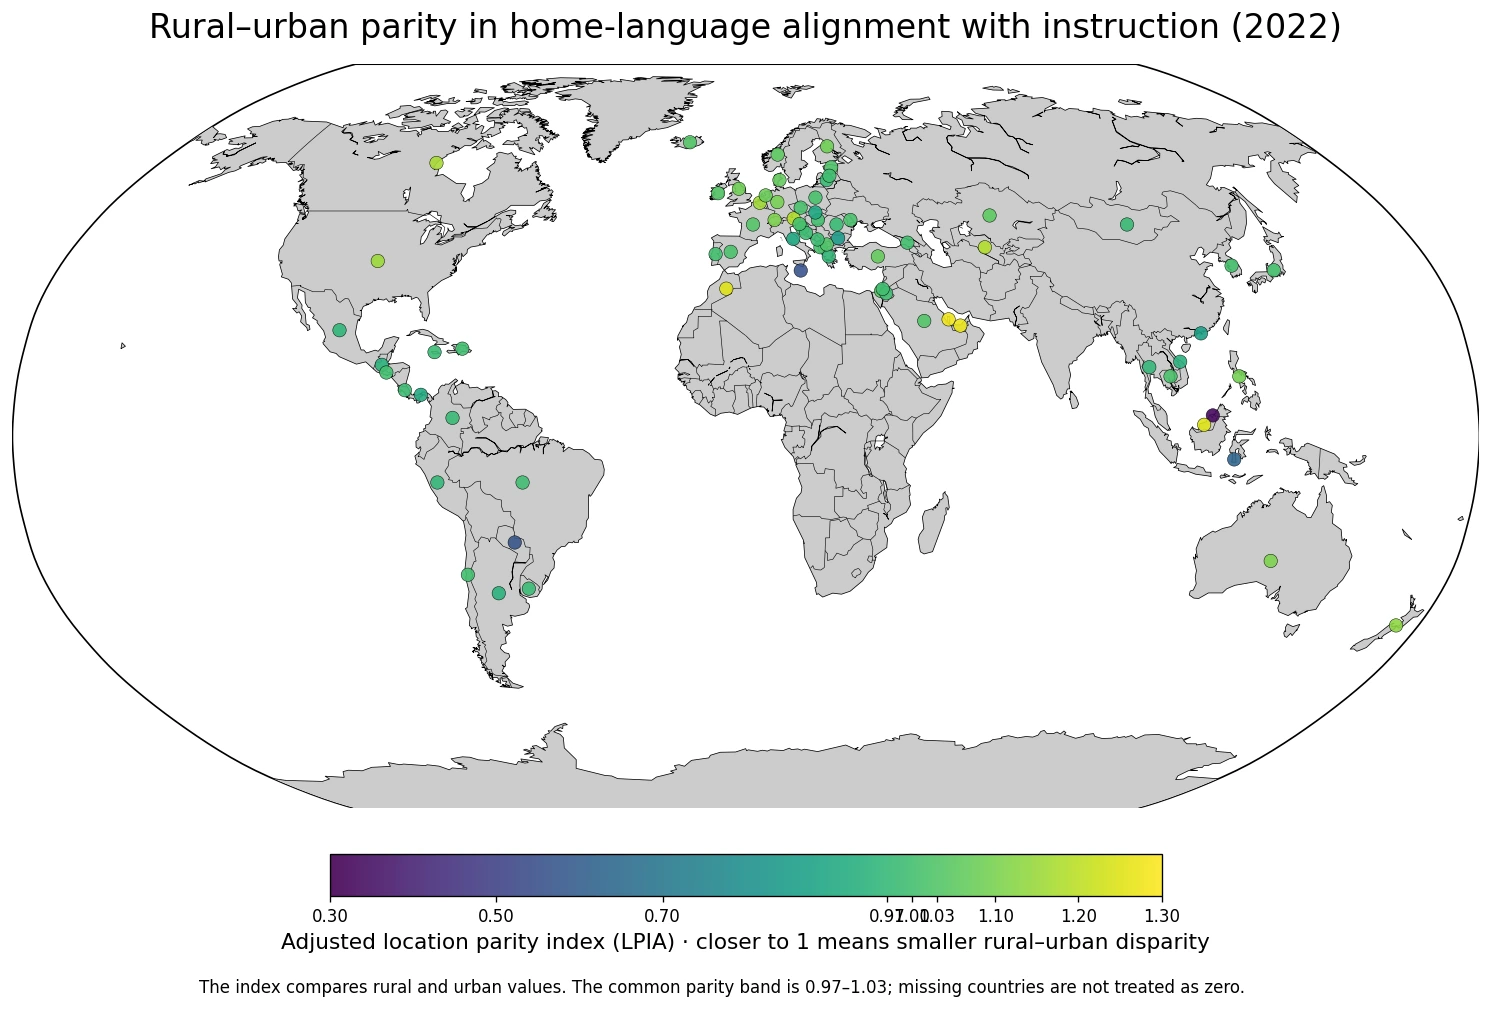
Table of Contents
Only 32 of 73 observations fall inside the parity band
The country-row median is 1.004 and the mean is 1.003, both close to 1. Those central statistics conceal an important pattern: disparities occur on both sides of parity and partly offset one another in the average. 32 observations are between 0.97 and 1.03, compared with 16 below the band and 25 above it.
The middle half of the observations runs from 0.980 to 1.064. 4 values are below 0.70 and 12 exceed 1.10. Most countries cluster relatively close to parity, but a smaller group shows large rural–urban differences in the underlying language-alignment indicator.
| LPIA band | Countries or territories | Share of observations |
|---|---|---|
| Below 0.70 | 4 | 5.5% |
| 0.70–0.969 | 12 | 16.4% |
| 0.97–1.03 parity band | 32 | 43.8% |
| Above 1.03–1.10 | 13 | 17.8% |
| Above 1.10 | 12 | 16.4% |
Values below 1 point to a lower rural value for this favorable indicator
The UIS parity-index methodology generally places the group that is more likely to be disadvantaged in the numerator; for location, the comparison is typically rural relative to urban. For a favorable indicator that should ideally be high, an LPIA below 1 therefore indicates a disparity in favour of the urban group, while a value close to 1 indicates similar rural and urban values.
The word ‘adjusted’ is important. Ratios above 1 are transformed so that the index is symmetric around 1 and bounded between 0 and 2. A value of 1.2 should therefore not be translated into a simple claim that the rural percentage is exactly 20% higher. The index is best interpreted by direction and distance from the parity point.
Brunei, Malta, Paraguay, and Indonesia are far below parity
Brunei Darussalam has the lowest observation at 0.327, followed by Malta at 0.561, Paraguay at 0.564, and Indonesia at 0.632. Bulgaria is at 0.841, Hong Kong SAR at 0.866, Italy at 0.899, Slovakia at 0.900, and Panama at 0.906.
| Low-end order | Country or territory | 2022 LPIA |
|---|---|---|
| 1 | Brunei Darussalam | 0.327 |
| 2 | Malta | 0.561 |
| 3 | Paraguay | 0.564 |
| 4 | Indonesia | 0.632 |
| 5 | Bulgaria | 0.841 |
| 6 | China, Hong Kong Special Administrative Region | 0.866 |
| 7 | Italy | 0.899 |
| 8 | Slovakia | 0.900 |
| 9 | Panama | 0.906 |
| 10 | Guatemala | 0.937 |
| 11 | Viet Nam | 0.937 |
| 12 | Argentina | 0.944 |
| 13 | Mexico | 0.957 |
| 14 | Thailand | 0.962 |
| 15 | Peru | 0.964 |
For this favorable underlying measure, these low values indicate that the rural share of students whose home language aligns with the instructional language is lower than the urban share. The parity index alone does not reveal the actual rural or urban percentages, however. Those component values are required to determine the absolute level in each location.
Qatar, the UAE, Morocco, and Malaysia show a large disparity in the opposite direction
Qatar is highest at 1.275, followed by the United Arab Emirates at 1.267, Morocco at 1.252, and Malaysia at 1.251. Uzbekistan and Austria are both near 1.185, Canada is 1.169, Belgium 1.160, and the United States 1.154.
| High-end order | Country or territory | 2022 LPIA |
|---|---|---|
| 1 | Qatar | 1.275 |
| 2 | United Arab Emirates | 1.267 |
| 3 | Morocco | 1.252 |
| 4 | Malaysia | 1.251 |
| 5 | Uzbekistan | 1.185 |
| 6 | Austria | 1.185 |
| 7 | Canada | 1.169 |
| 8 | Belgium | 1.160 |
| 9 | United States of America | 1.154 |
| 10 | New Zealand | 1.132 |
| 11 | Switzerland | 1.107 |
| 12 | Australia | 1.107 |
| 13 | Germany | 1.096 |
| 14 | Philippines | 1.089 |
| 15 | United Kingdom of Great Britain and Northern Ireland | 1.085 |
Values above 1 indicate that the rural underlying indicator is higher than the urban value for this positive measure. That does not establish that rural language alignment is high in absolute terms. Both rural and urban percentages could be low while the rural value is relatively higher, or both could be high while still differing enough to move the index away from 1.
Parity near 1 is not a score for overall language inclusion
An LPIA near 1 only tells us that rural and urban values are similar. Both groups could have strong alignment between home language and instructional language, or both could have weak alignment and still produce parity. Equity and overall level are separate dimensions.
A complete education-language assessment would therefore examine the underlying national, rural, and urban percentages alongside the parity index. The current dataset directly answers an equity question—how similar the two location groups are—not the separate question of how high the language-alignment percentage is overall.
The indicator does not measure whether mother-tongue education is guaranteed by law
SDG 4.5.2 is an outcome-oriented measure of students’ language experience. It does not directly record national laws on languages of instruction, the number of languages used in textbooks, teacher-language capacity, or the legal status of minority-language education.
Multilingual households also make the concept more complex than a one-language label. A student may use several languages at home, while assessment programmes have to translate that reality into standardized questionnaire responses. The UIS assessment-based methodology is designed for international comparability, not for a complete description of every country’s language-in-education policy.
The lower-secondary stage matters
The code LOWERSEC refers specifically to students at the end of lower secondary education. Language alignment can differ from what is observed in the early grades or at the end of primary school. Students may become more familiar with an instructional language as they progress through school, and language policies or assessment practices can also change by level.
For that reason, lower-secondary values should not be assumed to describe younger pupils. A stage-by-stage analysis would need the corresponding early-grade, end-of-primary, and lower-secondary versions of the underlying SDG 4.5.2 indicator and their equity disaggregations.
National language geography can push the index in either direction
Urban areas can contain large migrant and multilingual populations, while rural areas can be more linguistically homogeneous in some countries. In other systems, rural students from minority-language communities may face a larger gap with a nationally dominant instructional language. These different demographic structures can plausibly contribute to LPIA values appearing on both sides of 1.
The parity index itself does not identify the cause. Analysis of home-language distributions, official instructional languages, teacher language skills, migration, urbanization, and regional ethnic or linguistic composition would be needed to explain why a particular country is far from parity.
The comparison uses 73 same-year observations
All 73 rows in the supplied dataset are dated 2022, which avoids mixing observations from different reference years. Coverage is still incomplete: not every country has an observation, so the simple mean and median are summaries of the available country rows rather than population-weighted world estimates.
Countries without a value are not assigned zero or parity. Missingness can reflect participation in learning assessments, questionnaire availability, or other data constraints. A blank area on the map therefore means no included 2022 observation, not that rural and urban students have identical language experiences.
Data scope and source
The analysis uses 73 national-level 2022 observations from the UNESCO Institute for Statistics official API indicator FHLANGILP.LOWERSEC.LPIA. The indicator is the adjusted location parity index for the percentage of students at the end of lower secondary education whose first or home language is the language of instruction.
The observed range is 0.327 to 1.275, with a median of 1.004. 32 observations fall in the 0.97–1.03 parity band, 16 fall below it, and 25 lie above it. The map uses the published index values directly and does not replace missing observations with zero.
The main takeaway
Only 32 of the 73 available 2022 observations fall inside the common 0.97–1.03 rural–urban parity band for language alignment at the end of lower secondary education. Brunei, Malta, Paraguay, and Indonesia are far below 1, while Qatar, the United Arab Emirates, Morocco, and Malaysia are far above 1. The index shows the direction and relative size of location disparity, but it does not reveal the absolute rural and urban percentages or explain why the disparity exists.
Frequently Asked Questions
What does an LPIA close to 1 mean?
It means the rural and urban values of the underlying indicator are similar. UIS commonly uses 0.97–1.03 as a practical parity band.
What does an LPIA below 1 mean for this indicator?
For this favorable indicator, it points to a lower rural value relative to the urban value. The actual rural and urban percentages are not contained in the parity index itself.
Does the indicator always observe the classroom language directly?
No. For estimates based on international learning assessments, UIS can use the test language as a proxy for language of instruction and compare it with students' reported home-language use.
Related Articles
Green Map creates custom-edited map images using open geographic data sources such as geoBoundaries, Natural Earth, OpenStreetMap, and government open data.
These maps are edited visual materials, not raw data files, and are provided for education, documents, presentations, and graphic reference.