UNESCO Institute for Statistics (UIS) estimates for 2023 show a highly concentrated pattern in the mobile outbound gross enrolment ratio for tertiary students studying in Central Asia. Uzbekistan is highest at 2.05832%, followed by Turkmenistan at 0.83341%, Georgia at 0.62546%, Azerbaijan at 0.48065%, and Mongolia at 0.42141%. The median across 155 country and territory observations is only 0.00204%.
The official measure is the mobile outbound gross enrolment ratio. The UIS glossary defines it as internationally mobile tertiary enrolment in a host country or region expressed as a percentage of the origin population in the five-year age group immediately following the end of upper secondary education. In this indicator, the destination region is fixed as Central Asia. It is therefore not the percentage of all tertiary students studying in Central Asia and not the share of a country’s total outbound students choosing Central Asia.
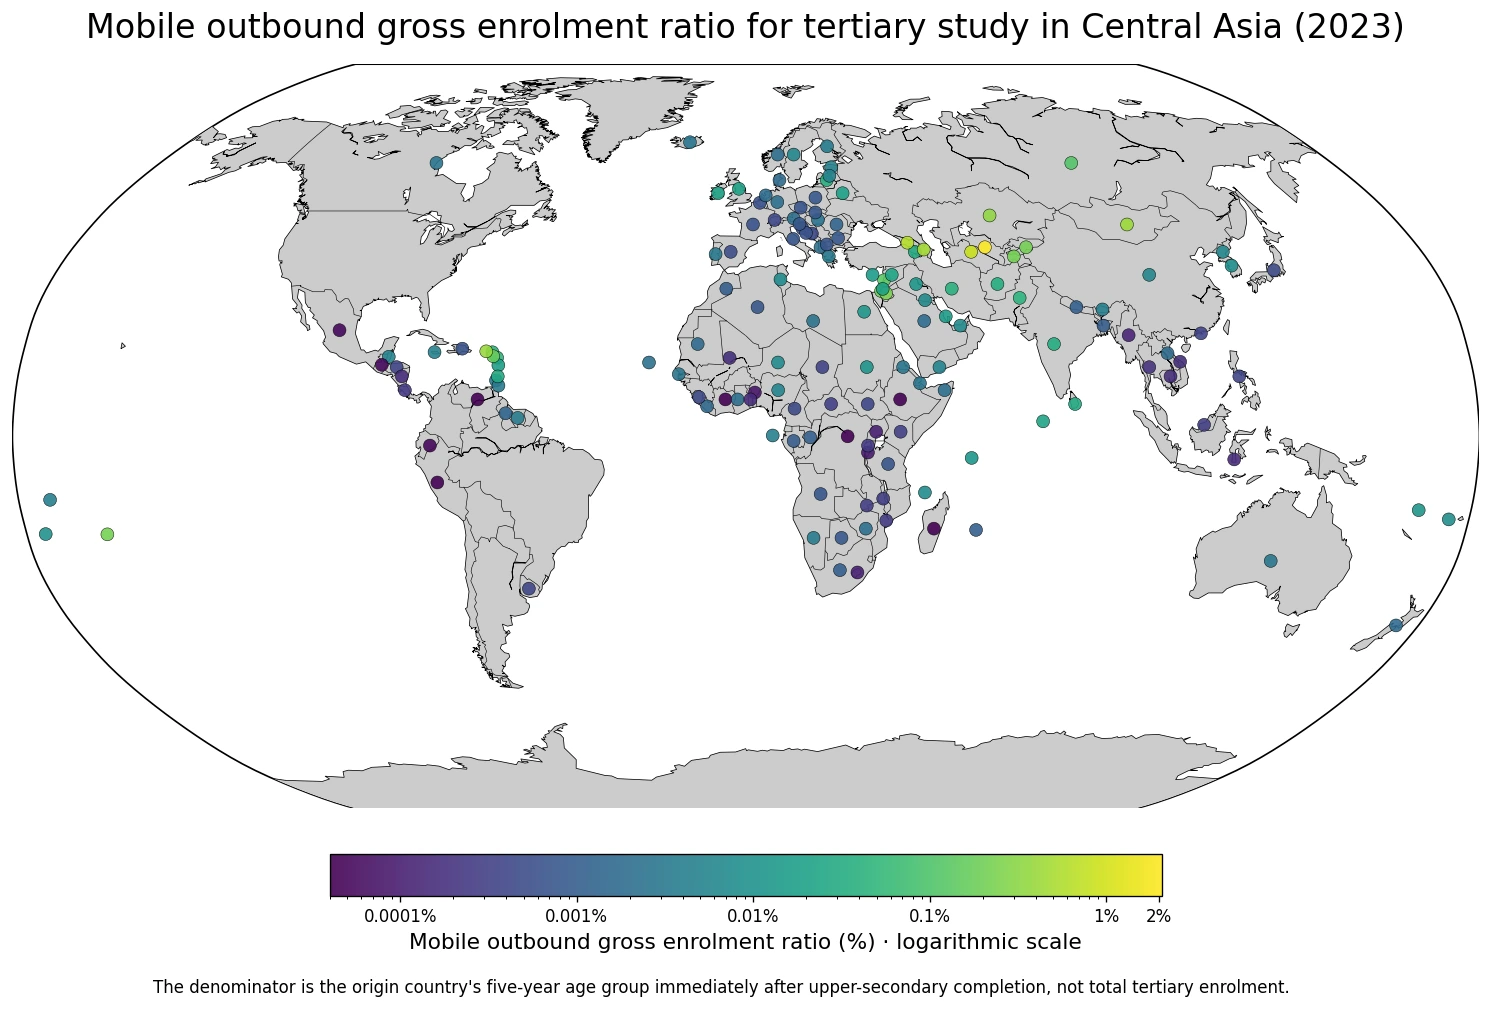
Table of Contents
Uzbekistan is the only observation above 1%
Uzbekistan records 2.05832%, making it the only country in the supplied dataset above one percent. Turkmenistan follows at 0.83341% and Georgia at 0.62546%. Azerbaijan, Mongolia, Kazakhstan, Jordan, the Cook Islands, Kyrgyzstan, Tajikistan, Israel, Lebanon, and the Russian Federation also appear among the higher observations.
The numerator is the number of internationally mobile tertiary students from the origin country studying in the Central Asia destination region, while the denominator is the relevant five-year post-upper-secondary age population. A high value therefore signals a large Central Asia study flow relative to the origin country’s reference-age population. The indicator does not identify the specific destination country, field of study, scholarship status, or reason for mobility.
| Rank | Origin country or territory | 2023 ratio |
|---|---|---|
| 1 | Uzbekistan | 2.05832% |
| 2 | Turkmenistan | 0.83341% |
| 3 | Georgia | 0.62546% |
| 4 | Azerbaijan | 0.48065% |
| 5 | Mongolia | 0.42141% |
| 6 | British Virgin Islands | 0.39062% |
| 7 | Kazakhstan | 0.33920% |
| 8 | Jordan | 0.23918% |
| 9 | Cook Islands | 0.21810% |
| 10 | Kyrgyzstan | 0.21457% |
| 11 | Tajikistan | 0.20890% |
| 12 | Israel | 0.19250% |
| 13 | Saint Kitts and Nevis | 0.16303% |
| 14 | Lebanon | 0.12658% |
| 15 | Russian Federation | 0.11091% |
The high end is geographically concentrated around Central Asia and nearby regions
Several of the highest values come from Central Asian origin countries themselves, including Uzbekistan, Turkmenistan, Kazakhstan, Kyrgyzstan, and Tajikistan. Nearby Georgia, Azerbaijan, Mongolia, and the Russian Federation also appear toward the upper end, while Jordan, Israel, and Lebanon provide higher observations from Western Asia.
The map is consistent with a strong regional concentration, but the indicator does not contain variables that explain why students choose Central Asia. Distance, language, tuition, scholarships, historical education networks, migration ties, and institutional agreements could matter, but those explanations require separate evidence. The data support a geographic pattern, not a causal claim.
About three quarters of the observations are below 0.01%
60 observations are below 0.001%, and another 56 are between 0.001% and 0.0099%. Together, 116 of the 155 observations, or 74.8%, are below 0.01%. For most origin countries, the number of mobile tertiary students studying in Central Asia is therefore very small relative to the reference-age population.
| 2023 ratio band | Countries or territories | Share of observations |
|---|---|---|
| Below 0.001% | 60 | 38.7% |
| 0.001–0.0099% | 56 | 36.1% |
| 0.01–0.0999% | 24 | 15.5% |
| 0.1–0.4999% | 12 | 7.7% |
| 0.5–0.9999% | 2 | 1.3% |
| 1% or more | 1 | 0.6% |
The middle half of the dataset runs from 0.00047% to 0.01052%. The mean is 0.04799%, far above the median of 0.00204%, because Uzbekistan, Turkmenistan, Georgia, and the other high observations pull the average upward. The distribution is strongly right-skewed, so the median and the upper outliers are more informative than the mean alone.
This is not the same as the outbound mobility ratio
The mobile outbound gross enrolment ratio uses a population denominator: the five-year age group immediately following upper-secondary completion. The outbound mobility ratio is a different measure that compares students studying abroad with the origin country’s total tertiary enrolment. Because the denominators differ, the two indicators should not be relabelled as if they were interchangeable.
Both measures can be useful. The gross enrolment ratio relates international mobility to the size of the population around typical tertiary-entry ages, while the mobility ratio relates it to the size of the current tertiary student body. A country can have different positions under the two measures even when the same outbound students are involved.
Each mapped country is an origin; Central Asia is the fixed destination region
The direction of the indicator is easy to misread. Each row in the table and each point on the map is an origin country or territory. The destination is fixed as the Central Asia region. Kazakhstan’s value of 0.33920%, for example, is not an inbound-student ratio for universities in Kazakhstan; it represents Kazakhstan-origin internationally mobile tertiary students studying somewhere in the Central Asia destination region, relative to Kazakhstan’s reference-age population.
UIS also distinguishes internationally mobile students from a simple foreign-citizenship classification. International mobility requires a physical cross-border move for education, and tertiary origin is preferably based on the country of prior upper-secondary education. Distance learning from a foreign institution while remaining in the origin country is not treated as international student mobility.
Very small ratios are still positive observations, not zeros
At the low end, Côte d’Ivoire, the Democratic Republic of the Congo, Ethiopia, Madagascar, Peru, and Venezuela are each around 0.00004%. Guatemala, Mexico, and Ecuador are around 0.00005%. These are positive observations rather than missing values or confirmed zeros.
| Low-end order | Origin country or territory | 2023 ratio |
|---|---|---|
| 1 | Côte d’Ivoire | 0.00004% |
| 2 | Democratic Republic of the Congo | 0.00004% |
| 3 | Ethiopia | 0.00004% |
| 4 | Madagascar | 0.00004% |
| 5 | Peru | 0.00004% |
| 6 | Venezuela (Bolivarian Republic of) | 0.00004% |
| 7 | Guatemala | 0.00005% |
| 8 | Mexico | 0.00005% |
| 9 | Ecuador | 0.00005% |
| 10 | Benin | 0.00008% |
| 11 | Burundi | 0.00009% |
| 12 | Lesotho | 0.00011% |
| 13 | Uganda | 0.00011% |
| 14 | Myanmar | 0.00013% |
| 15 | Mali | 0.00015% |
Tiny rank differences in this part of the distribution should not be over-interpreted. A difference between 0.00004% and 0.00005% says little about the practical scale of student mobility without the underlying student counts and multi-year data. The strongest signals are the large gap between the leading origin countries and the very low ratios across most of the dataset.
Counts and ratios answer different questions
A ratio helps compare origin countries of very different population sizes, but it does not show the actual number of students involved. A populous origin can have a very small ratio and still send a meaningful number of students, while a small origin can have a relatively large ratio with a modest absolute count.
If the question is how many students move to Central Asia, the relevant count indicator is more direct. If the question is how large that flow is relative to the origin country’s post-upper-secondary reference-age population, this gross enrolment ratio is the more appropriate measure. Using both provides a clearer view of scale and intensity.
A one-year snapshot cannot establish a trend
The 2023 values describe one point in time. Uzbekistan’s leading position does not by itself show that mobility to Central Asia is increasing or decreasing. A trend claim requires the same indicator across multiple years.
The indicator is also labelled as a UIS estimate. Broad differences and the strong regional concentration are more informative than tiny differences among countries with very small ratios. A multi-year series and the underlying student counts would be needed for a more detailed mobility analysis.
Data scope and source
The analysis uses 155 national-level 2023 observations from the UNESCO Institute for Statistics official API indicator MOGER.5T8.40505. The indicator covers both sexes and fixes the destination region as Central Asia. All rankings, averages, medians, and ratio bands in this article are calculated directly from the supplied values.
The map places each origin country or territory at a representative location and encodes the ratio by color. Because the range runs from 0.00004% to 2.05832%, a logarithmic color scale is used. Missing countries are not converted to zero, and point size does not represent the ratio.
The main takeaway
Uzbekistan has the highest 2023 mobile outbound gross enrolment ratio for tertiary students studying in Central Asia at 2.05832%, followed by Turkmenistan at 0.83341% and Georgia at 0.62546%. The median across 155 observations is only 0.00204%, and 116 observations are below 0.01%. The distribution therefore shows a strong concentration in a small group of Central Asian and nearby origin countries. The key interpretation rule is that the denominator is the post-upper-secondary five-year age population, not total tertiary enrolment.
Frequently Asked Questions
What does the mobile outbound gross enrolment ratio measure?
It compares internationally mobile tertiary students studying in Central Asia with the origin country's population in the five-year age group immediately after upper-secondary completion.
Is this the percentage of tertiary students who study abroad?
No. The denominator is a five-year reference-age population, not total tertiary enrolment, so it is different from the outbound mobility ratio.
Which origin country has the highest 2023 value?
Uzbekistan is highest at 2.05832%, followed by Turkmenistan at 0.83341% and Georgia at 0.62546%.
Related Articles
Green Map creates custom-edited map images using open geographic data sources such as geoBoundaries, Natural Earth, OpenStreetMap, and government open data.
These maps are edited visual materials, not raw data files, and are provided for education, documents, presentations, and graphic reference.