UNESCO Institute for Statistics (UIS) estimates for 2023 show a highly concentrated distribution of outbound internationally mobile tertiary students studying in North America and Western Europe. India has 607,214 students and China 580,053, far ahead of Germany in third place at 110,487. India and China alone account for about 34.4% of the sum of the 210 supplied country and territory observations.
This indicator is an absolute count by country of origin. It is useful for showing which origin countries have the largest numbers of tertiary students studying in this destination region, but it is not a study-abroad rate. Population size, the size of the tertiary education system, and mobility patterns can all influence the number. A country with a large student population can produce a large count even when only a modest share studies abroad.
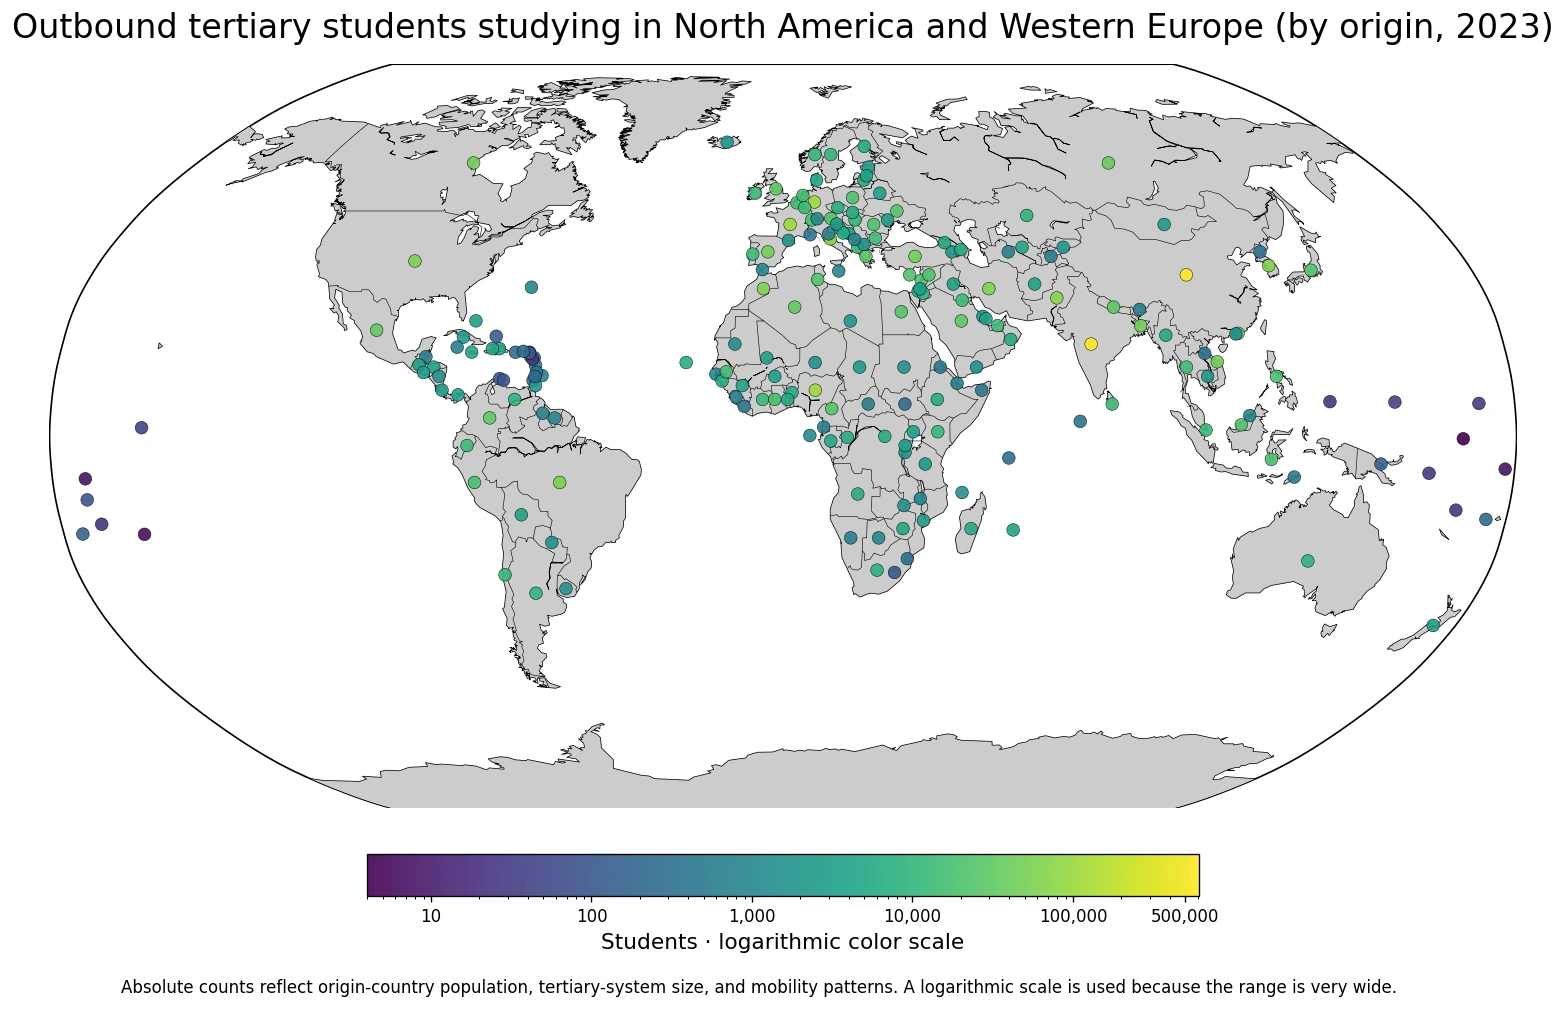
Table of Contents
India and China are far ahead of every other origin country
India records 607,214 students and China 580,053. Germany is third at 110,487, followed by Nigeria at 109,665 and France at 103,165. The top two observations make up 34.4% of the observed sum, the top five 43.8%, and the top ten 53.1%.
Italy follows at 74,856, Pakistan at 64,892, the Republic of Korea at 63,111, Iran at 60,099, and the United States at 58,767. The upper group spans Asia, Europe, Africa, and North America, so the pattern is not confined to one origin region.
| Rank | Origin country or territory | Tertiary students studying in North America and Western Europe |
|---|---|---|
| 1 | India | 607,214 |
| 2 | China | 580,053 |
| 3 | Germany | 110,487 |
| 4 | Nigeria | 109,665 |
| 5 | France | 103,165 |
| 6 | Italy | 74,856 |
| 7 | Pakistan | 64,892 |
| 8 | Republic of Korea | 63,111 |
| 9 | Iran (Islamic Republic of) | 60,099 |
| 10 | United States of America | 58,767 |
| 11 | Morocco | 57,626 |
| 12 | Brazil | 54,335 |
| 13 | Bangladesh | 46,990 |
| 14 | Türkiye | 46,612 |
| 15 | Viet Nam | 45,545 |
Only five origin countries are above 100,000
Only 5 of the 210 observations reach 100,000 or more students. 7 are between 50,000 and 99,999, while 52 are between 10,000 and 49,999. The largest band is 1,000–9,999 with 83 observations, and another 48 are between 100 and 999.
| Student-count band | Countries or territories | Share of observations |
|---|---|---|
| Below 100 | 15 | 7.1% |
| 100–999 | 48 | 22.9% |
| 1,000–9,999 | 83 | 39.5% |
| 10,000–49,999 | 52 | 24.8% |
| 50,000–99,999 | 7 | 3.3% |
| 100,000 or more | 5 | 2.4% |
The middle half of the observations lies between about 786 and 13,759, and the median is 3,644. The mean is much higher at 16,440 because the two values above half a million and several six-figure observations pull the average upward. For this long-tailed distribution, the median and concentration among the largest origins are more informative than the mean alone.
An absolute count is not the same as a mobility rate
A high count does not automatically mean that a high share of a country’s tertiary students study abroad. Large origin countries can generate very large numbers even with modest outbound mobility rates. Small countries can have high international mobility relative to their tertiary population while still producing only hundreds or a few thousand students in absolute terms.
A direct comparison of study-abroad propensity would therefore need a denominator such as the size of the tertiary student population or a formal outbound mobility ratio. The current indicator answers a different question: how many students from each origin are studying in North America and Western Europe.
The destination region is specific, not global
The indicator covers students studying in North America and Western Europe. It is not the total number of outbound tertiary students from each origin across every possible destination. Students studying in East Asia, Oceania, the Middle East, other parts of Europe, or elsewhere may fall outside this destination grouping.
Changing the destination region can change the country ranking substantially. Some origin countries may have especially strong mobility ties with neighboring countries or other world regions. For that reason, the published count should be described with its North America and Western Europe destination scope rather than shortened to a general ‘total students abroad’ figure.
Several European origin countries are also near the top
Germany ranks third at 110,487 and France fifth at 103,165, while Italy records 74,856. Spain has 42,630 and the Russian Federation 35,729. The data therefore include substantial mobility originating in Europe as well as movement from other parts of the world.
Asian origins remain prominent beyond India and China: Pakistan, Iran, Bangladesh, Türkiye, and Viet Nam are all among the larger observations. Nigeria and Morocco stand out among African origins. The map helps show that the largest origin-country counts are geographically dispersed even though India and China dominate the total.
The smallest observations are mostly small island states and territories
At the low end, Nauru records 4 students, the Cook Islands 6, Tokelau and Tuvalu 7 each, Niue 22, Palau and Montserrat 24 each, the Solomon Islands 29, Vanuatu 30, and the Marshall Islands 32. These values are strongly shaped by the very small populations and tertiary student bases of the origin places.
| Low-count order | Origin country or territory | Students |
|---|---|---|
| 1 | Nauru | 4 |
| 2 | Cook Islands | 6 |
| 3 | Tokelau | 7 |
| 4 | Tuvalu | 7 |
| 5 | Niue | 22 |
| 6 | Palau | 24 |
| 7 | Montserrat | 24 |
| 8 | Solomon Islands | 29 |
| 9 | Vanuatu | 30 |
| 10 | Marshall Islands | 32 |
| 11 | Micronesia (Federated States of) | 40 |
| 12 | Kiribati | 49 |
| 13 | Anguilla | 63 |
| 14 | Curaçao | 90 |
| 15 | Samoa | 92 |
A count of a few dozen should not be interpreted as evidence of little interest in international study. The relevant origin population can itself be very small. To compare international mobility intensity across small and large countries, a rate based on the tertiary student population would be more appropriate.
The observed sum is not a global total for all study abroad
The 210 supplied observations add to about 3.45 million students. That number describes the sum of the observations in this indicator and destination scope; it should not be presented as the total number of tertiary students studying abroad worldwide. The destination region is restricted to North America and Western Europe.
Countries without an included observation are not converted to zero. A missing value means that no value is present in this comparison, not that the origin country has no internationally mobile students. Keeping missing data separate from true zero values is important when mapping international education statistics.
The UIS estimate label is part of the interpretation
The official indicator name includes ‘UIS estimate.’ The values should therefore be understood as the official UIS estimates for 2023 rather than as perfectly synchronized direct headcounts collected in exactly the same way in every origin country. That makes them suitable for broad international comparison, while very small differences should not be over-interpreted.
This is also a one-year snapshot. A country can move substantially from year to year as destination demand, mobility conditions, study opportunities, and the underlying tertiary student population change. A trend analysis would require the same indicator across multiple years rather than inferring direction from the 2023 level alone.
Data scope and source
The analysis uses 210 national-level 2023 observations from the UNESCO Institute for Statistics official API indicator OE.5T8.40500. The indicator reports the estimated number of outbound internationally mobile tertiary students, both sexes combined, studying in North America and Western Europe.
The map places each observation at a representative location for the origin country or territory. Color represents the published student count and point size does not. Because values range from 4 to 607,214, the map uses a logarithmic color scale while tables and prose retain the original number of students.
The main takeaway
India and China dominate the 2023 origin-country counts, with 607,214 and 580,053 tertiary students respectively studying in North America and Western Europe. Together they account for about 34.4% of the observed sum, while only 5 origins exceed 100,000. The measure is best used to understand the scale and geographic distribution of student mobility into this destination region. It should not be treated as a direct ranking of countries’ study-abroad propensity without a denominator such as the size of the tertiary student population.
Frequently Asked Questions
Does this indicator include all students studying abroad from each country?
No. It covers outbound internationally mobile tertiary students studying specifically in North America and Western Europe.
Does a larger count mean a higher study-abroad rate?
No. Absolute counts are strongly affected by the size of the origin country's tertiary student population. A mobility rate needs an appropriate denominator.
Which origin countries have the largest 2023 counts?
India is highest at 607,214, followed by China at 580,053.
Related Maps
Green Map creates custom-edited map images using open geographic data sources such as geoBoundaries, Natural Earth, OpenStreetMap, and government open data.
These maps are edited visual materials, not raw data files, and are provided for education, documents, presentations, and graphic reference.