How many children are there for each trained teacher in pre-primary education? UNESCO Institute for Statistics indicator PTRHC.02.TRAINED divides the number of children enrolled in pre-primary education by the number of teachers who meet the minimum organized pedagogical training requirements for that level in the country.
Across the 72 country and area observations dated 2024, the unweighted median is 19.0 children per trained teacher and the mean is 30.6. The Republic of Korea is 10.94, the 9th-lowest observation. UIS interprets higher ratios as lower relative access to trained teachers.
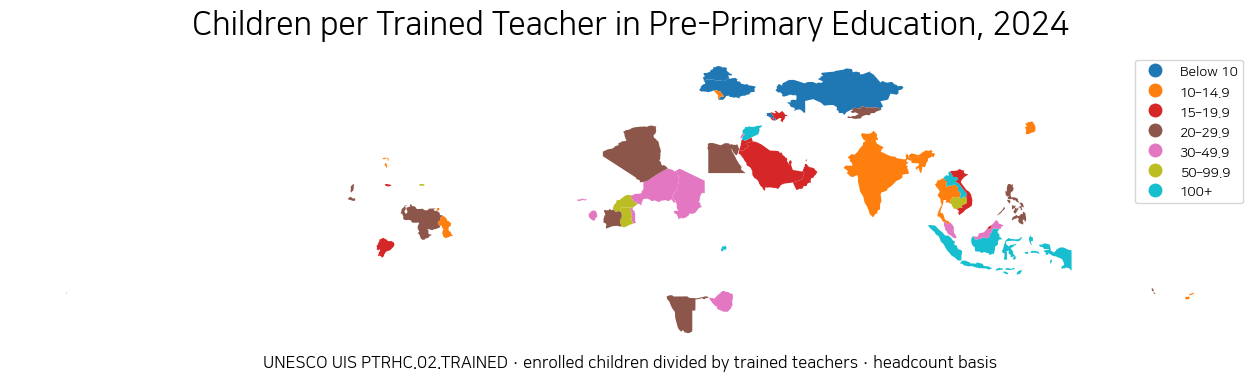
Table of Contents
The denominator includes trained teachers, not all teachers
A conventional pupil-teacher ratio divides enrolment by all teachers in the relevant level. This indicator is narrower: the denominator includes only trained teachers. UIS defines a trained teacher as someone who has completed at least the minimum organized pre-service or in-service pedagogical training required to teach that level under national policy or law.
A high value can therefore arise for several reasons. Enrolment may be large, the teacher workforce may be small, or a relatively small share of teachers may meet the country’s training requirement. The ratio alone cannot distinguish among those mechanisms.
The indicator is reported on a headcount basis. Part-time teaching, double shifts, multi-grade arrangements and other staffing practices can affect the meaning of a simple headcount ratio, which UIS lists among the limitations of pupil-teacher indicators.
Lower values generally indicate better access to trained teachers, but there is no universal ideal
UIS states that a higher pupil-trained teacher ratio indicates lower relative access to trained teachers. A lower ratio can imply that trained teachers have fewer enrolled children to serve and may have more opportunity to provide individual attention.
That does not create one universal target for every education system. The age and needs of children, teacher experience, classroom support, programme length, teaching hours and other resources all affect what staffing level is appropriate. A ratio of 10 should not automatically be labelled good and a ratio of 20 bad without context.
The 2024 median is 19.0 children per trained teacher
The median across the 72 observations is 19.0. The first quartile is 13.5 and the third quartile is 29.5, so the middle half of the observations lies roughly in that range. 39 observations are at or below 20, and 25 are at or below 15.
At the high end, 17 observations are at least 30, 9 are at least 50 and 4 exceed 100. A small number of extreme ratios raises the mean to 30.6, making the median a better description of the centre of the distribution.
Syria, Lao PDR, Indonesia and Rwanda exceed 100
The Syrian Arab Republic has the highest observation at 229.9 children per trained teacher. Lao PDR is 161.1, Indonesia 139.6 and Rwanda 105.5. Burkina Faso is 76.5, Puerto Rico 74.7 and Cambodia 73.9.
These figures are not average class sizes. The ratio uses total pre-primary enrolment divided by the number of teachers meeting the national training standard. Teachers who work in classrooms but do not meet that training definition may not be included in the denominator.
| High-ratio rank | Country or area | ISO3 | Children per trained teacher |
|---|---|---|---|
| 1 | Syrian Arab Republic | SYR | 229.9 |
| 2 | Lao PDR | LAO | 161.1 |
| 3 | Indonesia | IDN | 139.6 |
| 4 | Rwanda | RWA | 105.5 |
| 5 | Burkina Faso | BFA | 76.5 |
| 6 | Puerto Rico | PRI | 74.7 |
| 7 | Cambodia | KHM | 73.9 |
| 8 | Micronesia (Fed. States of) | FSM | 51.3 |
| 9 | Ghana | GHA | 50.7 |
| 10 | Togo | TGO | 43.2 |
| 11 | Sierra Leone | SLE | 43.2 |
| 12 | Zimbabwe | ZWE | 38.9 |
| 13 | Gambia | GMB | 38.8 |
| 14 | Malaysia | MYS | 36.1 |
| 15 | Chad | TCD | 35.3 |
The Republic of Korea is 10.9, among the lower observations
The Republic of Korea records 10.94 children per trained pre-primary teacher in 2024. It is the 9th-lowest observation among the 72 rows and is well below the median of 19.0.
India is 13.5, also below the median. Indonesia is 139.6, showing how widely ratios can vary even among countries in the same broad region. The indicator describes trained-teacher resource access rather than a simple regional pattern.
| Low-ratio rank | Country or area | ISO3 | Children per trained teacher |
|---|---|---|---|
| 1 | Niue | NIU | 4.5 |
| 2 | Cayman Islands | CYM | 4.7 |
| 3 | San Marino | SMR | 5.9 |
| 4 | Belarus | BLR | 6.8 |
| 5 | Armenia | ARM | 8.8 |
| 6 | Ukraine | UKR | 9.0 |
| 7 | Kazakhstan | KAZ | 9.0 |
| 8 | Thailand | THA | 10.6 |
| 9 | Republic of Korea | KOR | 10.9 |
| 10 | Republic of Moldova | MDA | 11.1 |
| 11 | Trinidad and Tobago | TTO | 11.4 |
| 12 | Tuvalu | TUV | 11.8 |
The range runs from 4.5 in Niue to 229.9 in Syria
Niue has the lowest observation at 4.5, followed by the Cayman Islands at 4.7, San Marino at 5.9, Belarus at 6.8 and Armenia at 8.8. Ukraine and Kazakhstan are close to 9.
Ratios in very small systems can move substantially when only a few teachers or pupils change. National differences in how trained teachers are defined also mean that a ratio of 5 in one country and 10 in another should not be interpreted as a precise two-to-one difference in instructional quality.
This ratio is not the same as average class size
Average class size describes the number of children assigned to a classroom or instructional group. The pupil-trained teacher ratio is a system-level staffing measure based on enrolment and trained-teacher headcounts. One teacher may serve multiple groups, assistants may be present, and double-shift arrangements can produce very different class-size and teacher-ratio figures.
Calling this indicator ‘average children per kindergarten class’ would therefore be incorrect. A more accurate plain-language description is ‘children per trained pre-primary teacher.’
National training standards differ
The UIS concept of a trained teacher does not require one identical international credential. It is based on the minimum organized teacher-training requirement established for the relevant education level under each country’s policy or law. Training commonly covers pedagogical knowledge, classroom organization and professional knowledge.
Because national requirements differ, identical ratios do not necessarily imply identical teacher preparation. International comparisons are useful for broad resource patterns, but small numerical differences should not be treated as precise rankings of teacher quality.
Comparing with the ordinary pupil-teacher ratio can reveal another part of the story
If a country has both an ordinary pupil-teacher ratio and a pupil-trained teacher ratio for the same year and level, the two together can be informative. A much higher trained-teacher ratio may indicate that only part of the teaching workforce meets the training standard.
The current dataset does not include the matched ordinary pupil-teacher ratio, so no trained-teacher share is reverse-engineered here. A direct percentage-of-trained-teachers indicator is better suited to measuring what share of the teacher workforce meets the training requirement.
The ratio is an education-resource indicator, not a complete quality score
Access to trained teachers is an important input to pre-primary education, but it is not the whole of education quality. Curriculum, teacher practice, staff retention, compensation, facilities, classroom composition, assistants, family engagement and children’s attendance all matter.
A high ratio can signal pressure on trained-teacher resources, while a low ratio can signal more favourable staffing. Learning and child-development outcomes require separate evidence.
All observations are from 2024, but coverage is limited to 72 countries and areas
The dataset has the advantage of a common 2024 reference year, but it does not cover every country. Several large economies familiar to readers are absent from this 72-observation set. The results should therefore be described as a same-year comparison within the available reporting countries and areas.
Countries without a value are not converted to zero. Small islands and separately reported areas can also be missing from the low-resolution map geometry even when they have statistical observations.
Data source and calculation method
Country values come from the UNESCO UIS Data Browser for PTRHC.02.TRAINED, using the 2024 observations. The official definition and interpretation follow the UIS Pupil-trained teacher ratio by education level metadata.
The mean, median, quartiles and rankings give every country or area equal weight. The source metadata stored the unit generically as ‘value’; the public content clarifies the operational unit as children per trained teacher. The internal provider tag is also corrected from World Bank to UNESCO UIS to match the official source.
Frequently Asked Questions
Is a lower pupil-trained teacher ratio always better?
Lower ratios generally indicate better relative access to trained teachers, but there is no universal ideal. Appropriate staffing depends on children's needs, teacher experience, programme design and other resources.
What is the Republic of Korea’s 2024 value?
Korea records 10.94 children per trained pre-primary teacher, the ninth-lowest value among the 72 observations.
Is this the average class size?
No. It is total pre-primary enrolment divided by the number of trained teachers. Actual class size can differ because of staffing patterns, shifts, assistants and how children are grouped.
Does ‘trained teacher’ mean the same qualification in every country?
No. UIS uses each country's minimum organized teacher-training requirement for the relevant education level, so national standards can differ.
Related Articles
- Education-Field Share Among Tertiary Graduates by Country
- Private Pre-Primary Enrolment Share
- Government Education Spending as % of GDP
Green Map creates custom-edited map images using open geographic data sources such as geoBoundaries, Natural Earth, OpenStreetMap, and government open data.
These maps are edited visual materials, not raw data files, and are provided for education, documents, presentations, and graphic reference.