Southeastern Connecticut Planning Region brings together two very different kinds of geography: an inland network of towns and rivers around Norwich, and a coastal zone that reaches from New London and Groton through Mystic, Stonington, and Pawcatuck. The supplied map set makes that contrast easy to see. One map focuses on the boundary, settlements, and numbered roads; a second ranks six selected places; and a third follows the Yantic, Shetucket, Quinebaug, and Thames river system down to Long Island Sound and Fishers Island Sound. High-resolution JPG versions can be downloaded later on this page.
The name is important because Connecticut now uses planning regions as county equivalents in current federal geography. The identity file in this package assigns Southeastern Connecticut Planning Region state FIPS 09 and county-equivalent FIPS 180. The Southeastern Connecticut Council of Governments describes a regional organization made up of twenty-two municipal members that work together on planning, transportation, and other shared concerns. The maps do not attempt to label every member municipality, so this article stays closely tied to the places and features actually visible in the supplied images.
The outline is unusually varied. A narrow northern extension reaches the Willimantic and South Windham area, the west pushes out around Colchester, and Norwich sits near the middle of the main inland body. South of Norwich, the region opens toward New London and Groton on the Thames estuary, then continues east across the Mystic and Stonington coast toward Pawcatuck. That combination of inland river junctions, coastal settlements, and an irregular boundary is the best starting point for reading the maps.
Table of Contents
Roads converge around Norwich before spreading toward the New London and Groton coast
Norwich is the easiest place to find first on the general map. Routes 2, 12, and 32 meet or pass close to the city, while I-395 provides the strongest north-south connection toward the lower part of the region. Jewett City lies to the northeast near routes labeled 138 and 165. Colchester is separated to the west in a projecting section of the boundary, with Route 16 giving a clear reference there. These points immediately show that the region is not organized around a single coastline corridor.
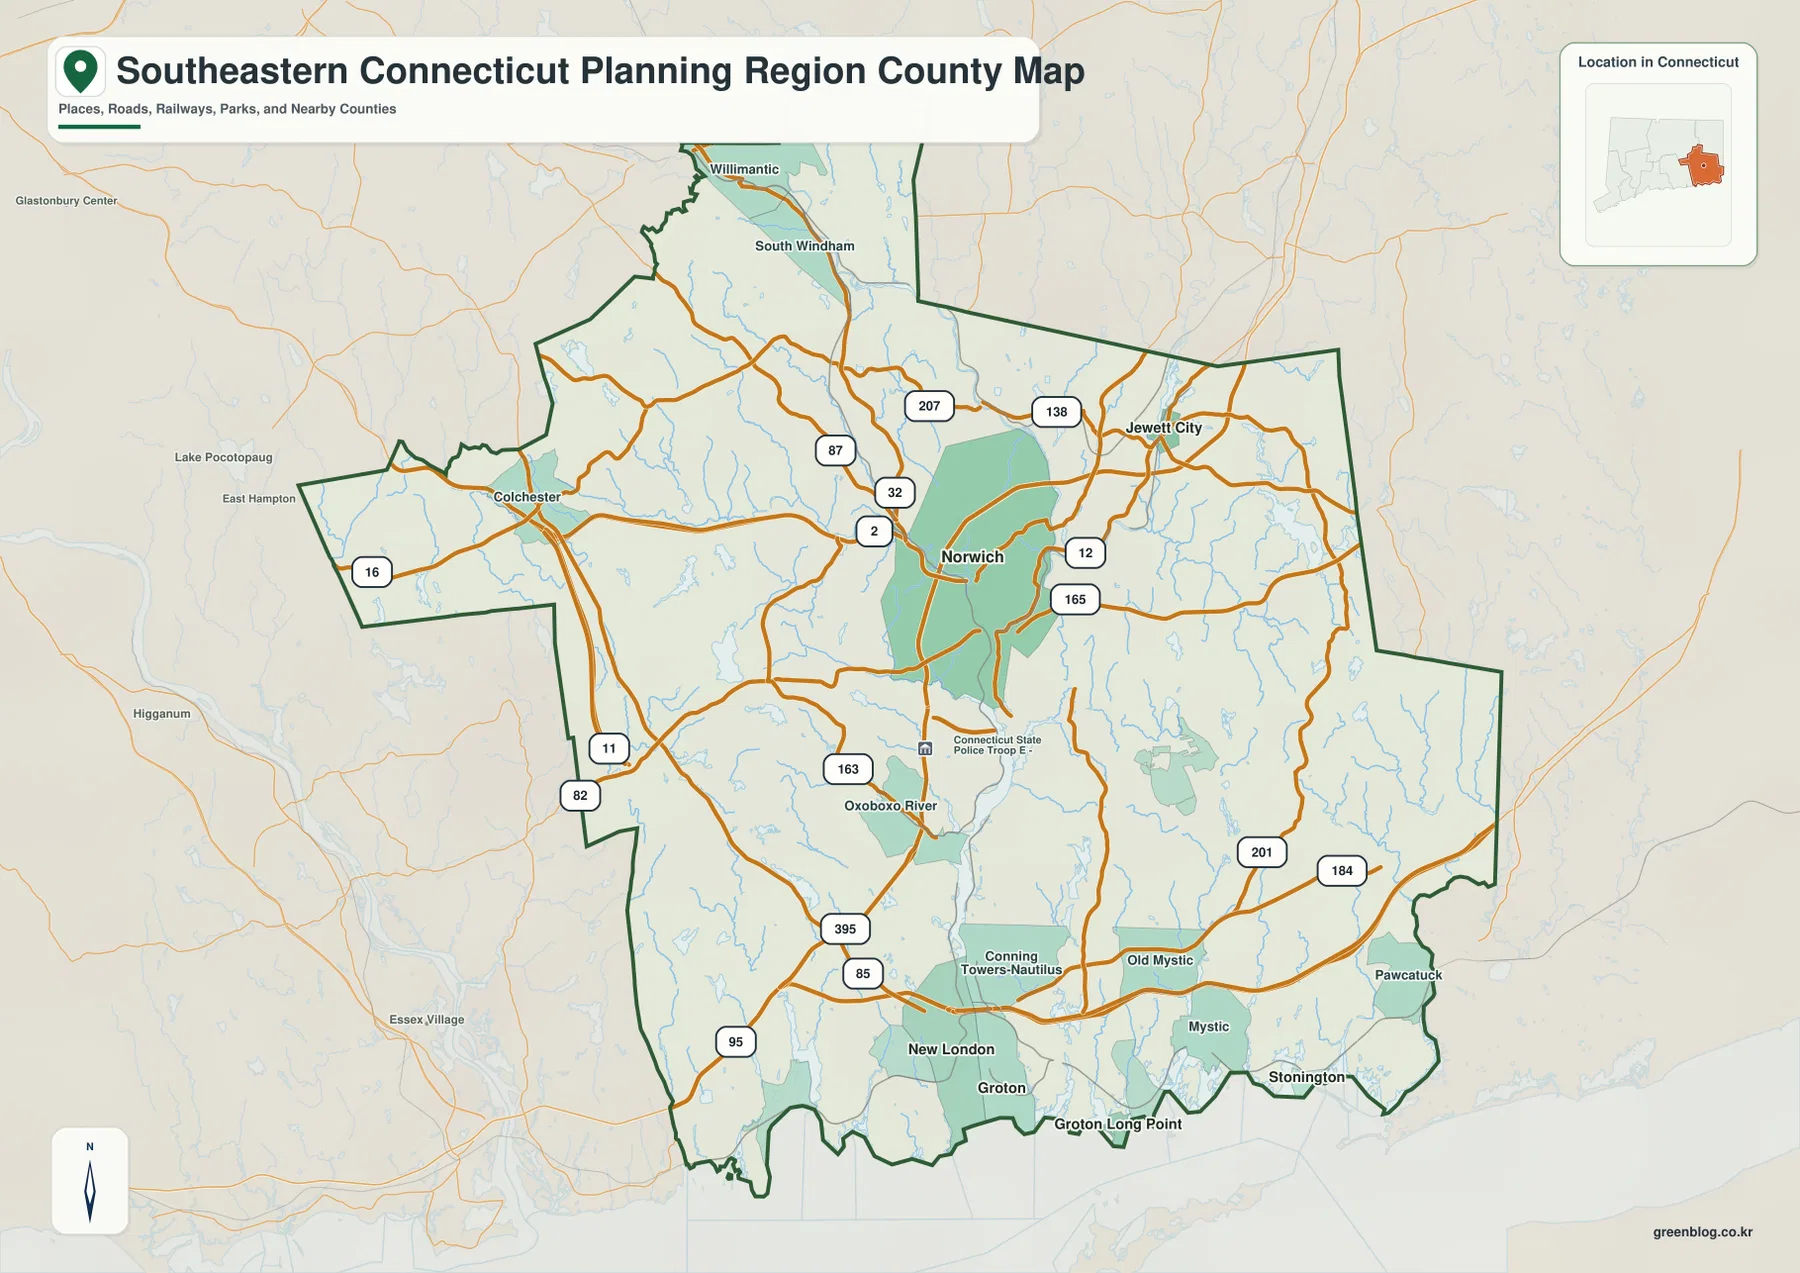
Moving south from Norwich, I-395 and several local routes lead toward New London and Groton. Near the coast, Route 85 and the 95 corridor become prominent, while the Thames River estuary separates New London on the west from Groton on the east. Old Mystic and Mystic appear farther east, followed by Stonington and Pawcatuck near the southeastern edge. This southern band contains the map’s densest concentration of familiar coastal place names, but it is only one part of a region that extends far inland.
The eastern interior has a more branching road pattern. Route 12 continues through the Norwich side of the region, while routes 165, 201, and 184 provide additional references between the Jewett City area and the Stonington interior. The planning-region boundary steps inward and outward along the east side, so a place that looks geographically close to another may sit near an edge or outside the outline. Following the dark boundary along with the roads prevents nearby places from being mistaken for members of the subject region.
The west and north feel different from the coast. Around Colchester, Routes 16, 11, and 82 are visible, and the northern extension follows roads toward Willimantic and South Windham. Settlement labels become less dense in these areas, while small streams and local roads occupy more of the map. A practical way to understand the whole region is to treat Norwich as the inland center, then compare the western Colchester side, the northern Windham extension, and the southern New London–Groton coast.
The general map also labels smaller places such as Corning Towers-Nautilus, Oxoboxo River, and Groton Long Point. These details are useful when a reader needs more than a city-level overview. They should not be confused with parcel or zoning information, however. The map is designed for regional orientation; current road closures, legal property boundaries, zoning, and turn-by-turn travel require dedicated municipal, state, or navigation sources.
The city index separates the inland Norwich center from the coastal group
The city-index map ranks six places and prints a value beside each name. Norwich is first at 39,973, followed by New London at 27,625. Groton is listed at 9,490, Jewett City at 4,329, Stonington at 934, and Groton Long Point at 546. These are the figures printed in the supplied map legend. The article does not silently convert them into a different year or claim that they are the latest official population estimates; they are best understood as the map’s own ranking values.
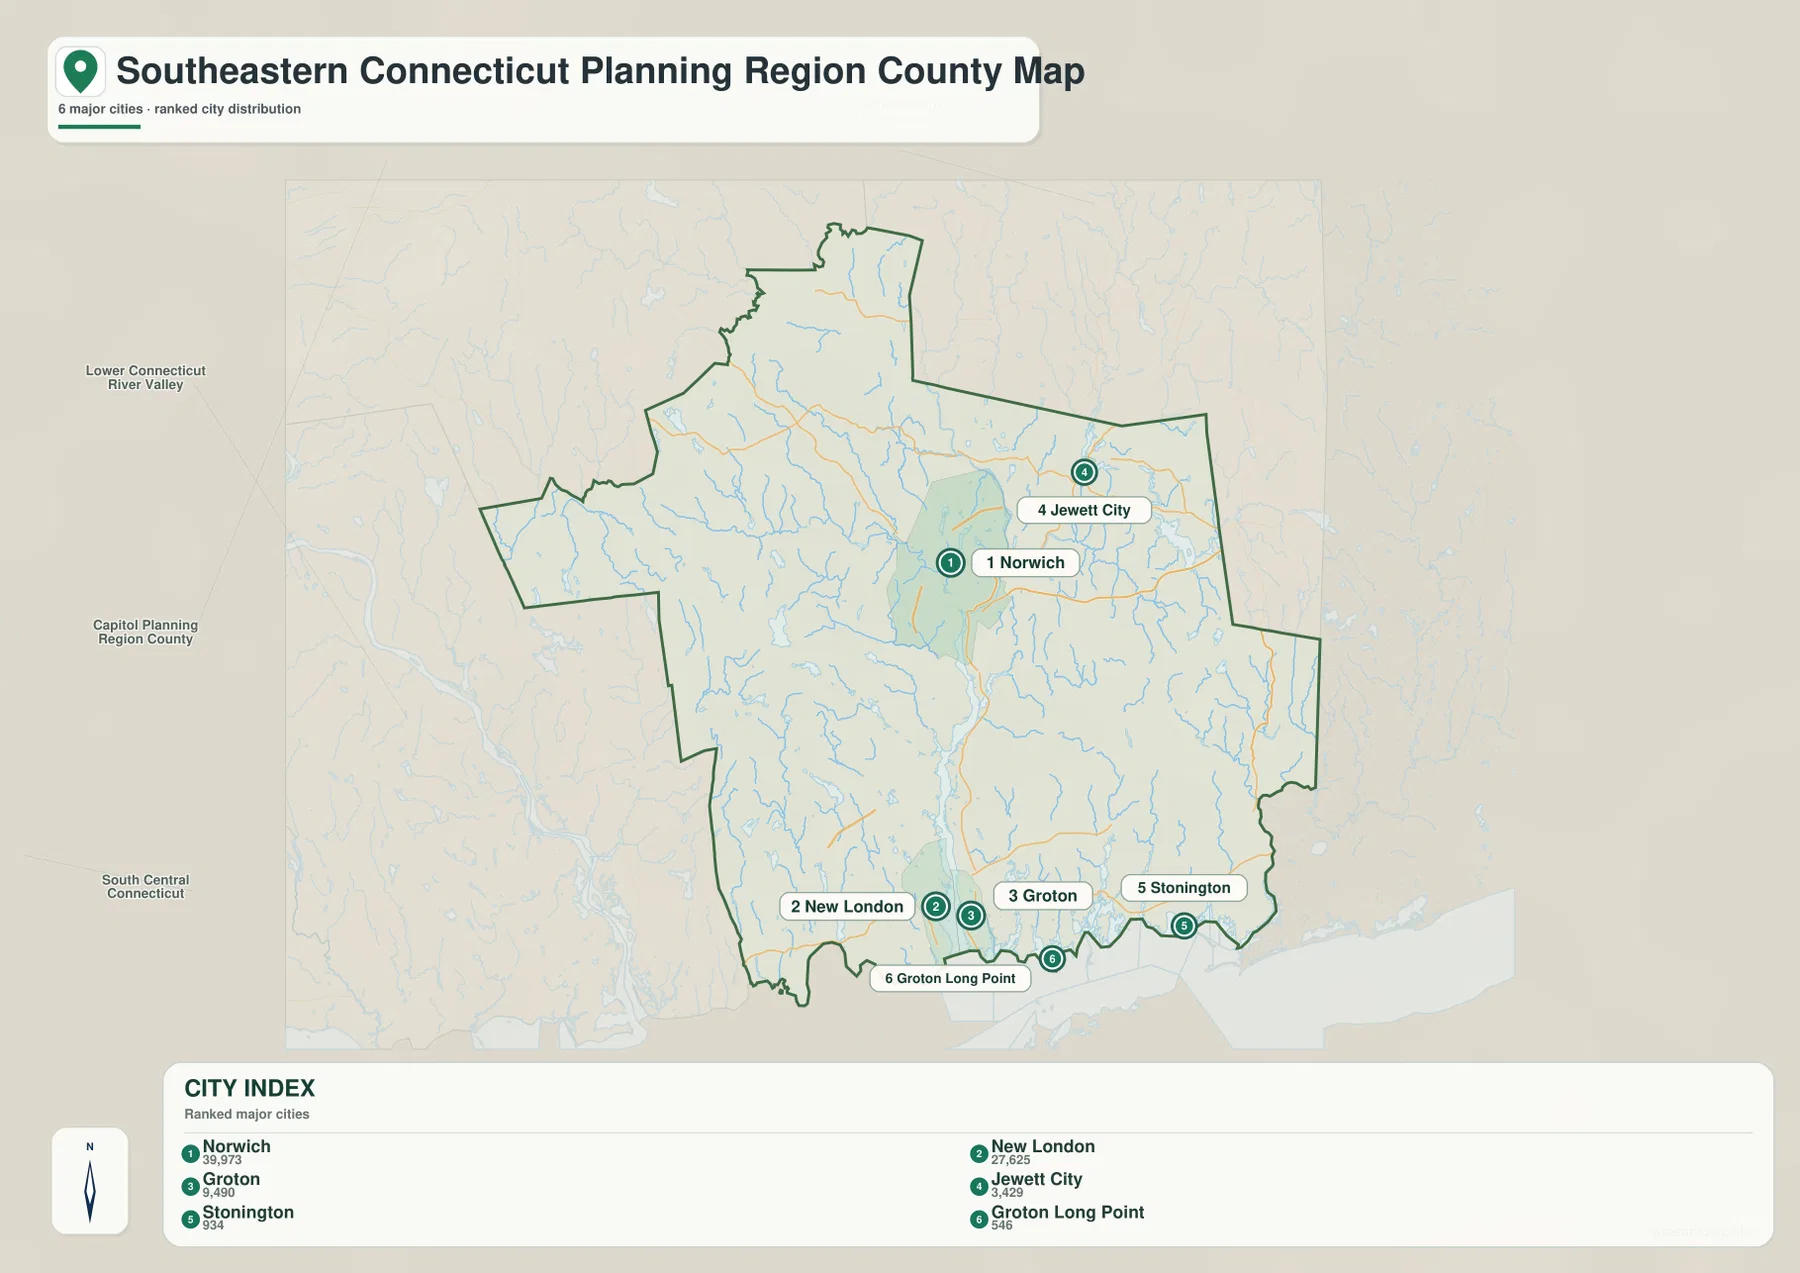
The placement of those six markers is more informative than the ranking alone. Norwich and Jewett City are inland, while New London, Groton, Stonington, and Groton Long Point cluster near the southern coast. New London and Groton face each other across the lower Thames River, and the Stonington markers continue east toward Fishers Island Sound. Mystic and Pawcatuck do not appear as ranked points on this layer even though they are clearly labeled on the general map, which is why the city index should not be treated as a complete settlement list.
Norwich’s inland position is especially useful for understanding the region. It is not simply the northern member of a coastal chain. The water map shows the Yantic and Shetucket river system meeting in the Norwich area before the Thames River runs south. The road map also shows several numbered routes spreading away from the city. Reading the three layers together explains why Norwich stands out even though the region’s best-known coastal places lie many miles farther south.
Along the shore, New London and Groton form a closely spaced pair, while Groton Long Point and Stonington extend the selected city pattern eastward. This creates a coastal cluster that is different from the inland spacing around Norwich and Jewett City. For a presentation about settlement distribution, the city index keeps that contrast simple. For roads, smaller villages, or a wider set of place names, the boundary map provides the additional detail that the index intentionally leaves out.
Names of neighboring planning regions appear outside the outline, including Lower Connecticut River Valley, the Capitol area, and South Central Connecticut. They are there to help with statewide orientation. The dark subject boundary is what determines the area being mapped; an outside planning-region label should not be read as a city or municipality within Southeastern Connecticut.
Three inland rivers feed the Thames system before it reaches Long Island Sound
The water map makes Norwich the key junction for a second reason. The Yantic River approaches from the west, while the Shetucket River comes in from the east. The Quinebaug River is labeled farther upstream as part of that eastern drainage. Near Norwich, these river systems feed the Thames River, which then runs south through the middle-lower part of the planning region. This is the most important water relationship on the map because it connects the inland river network directly with the coast.
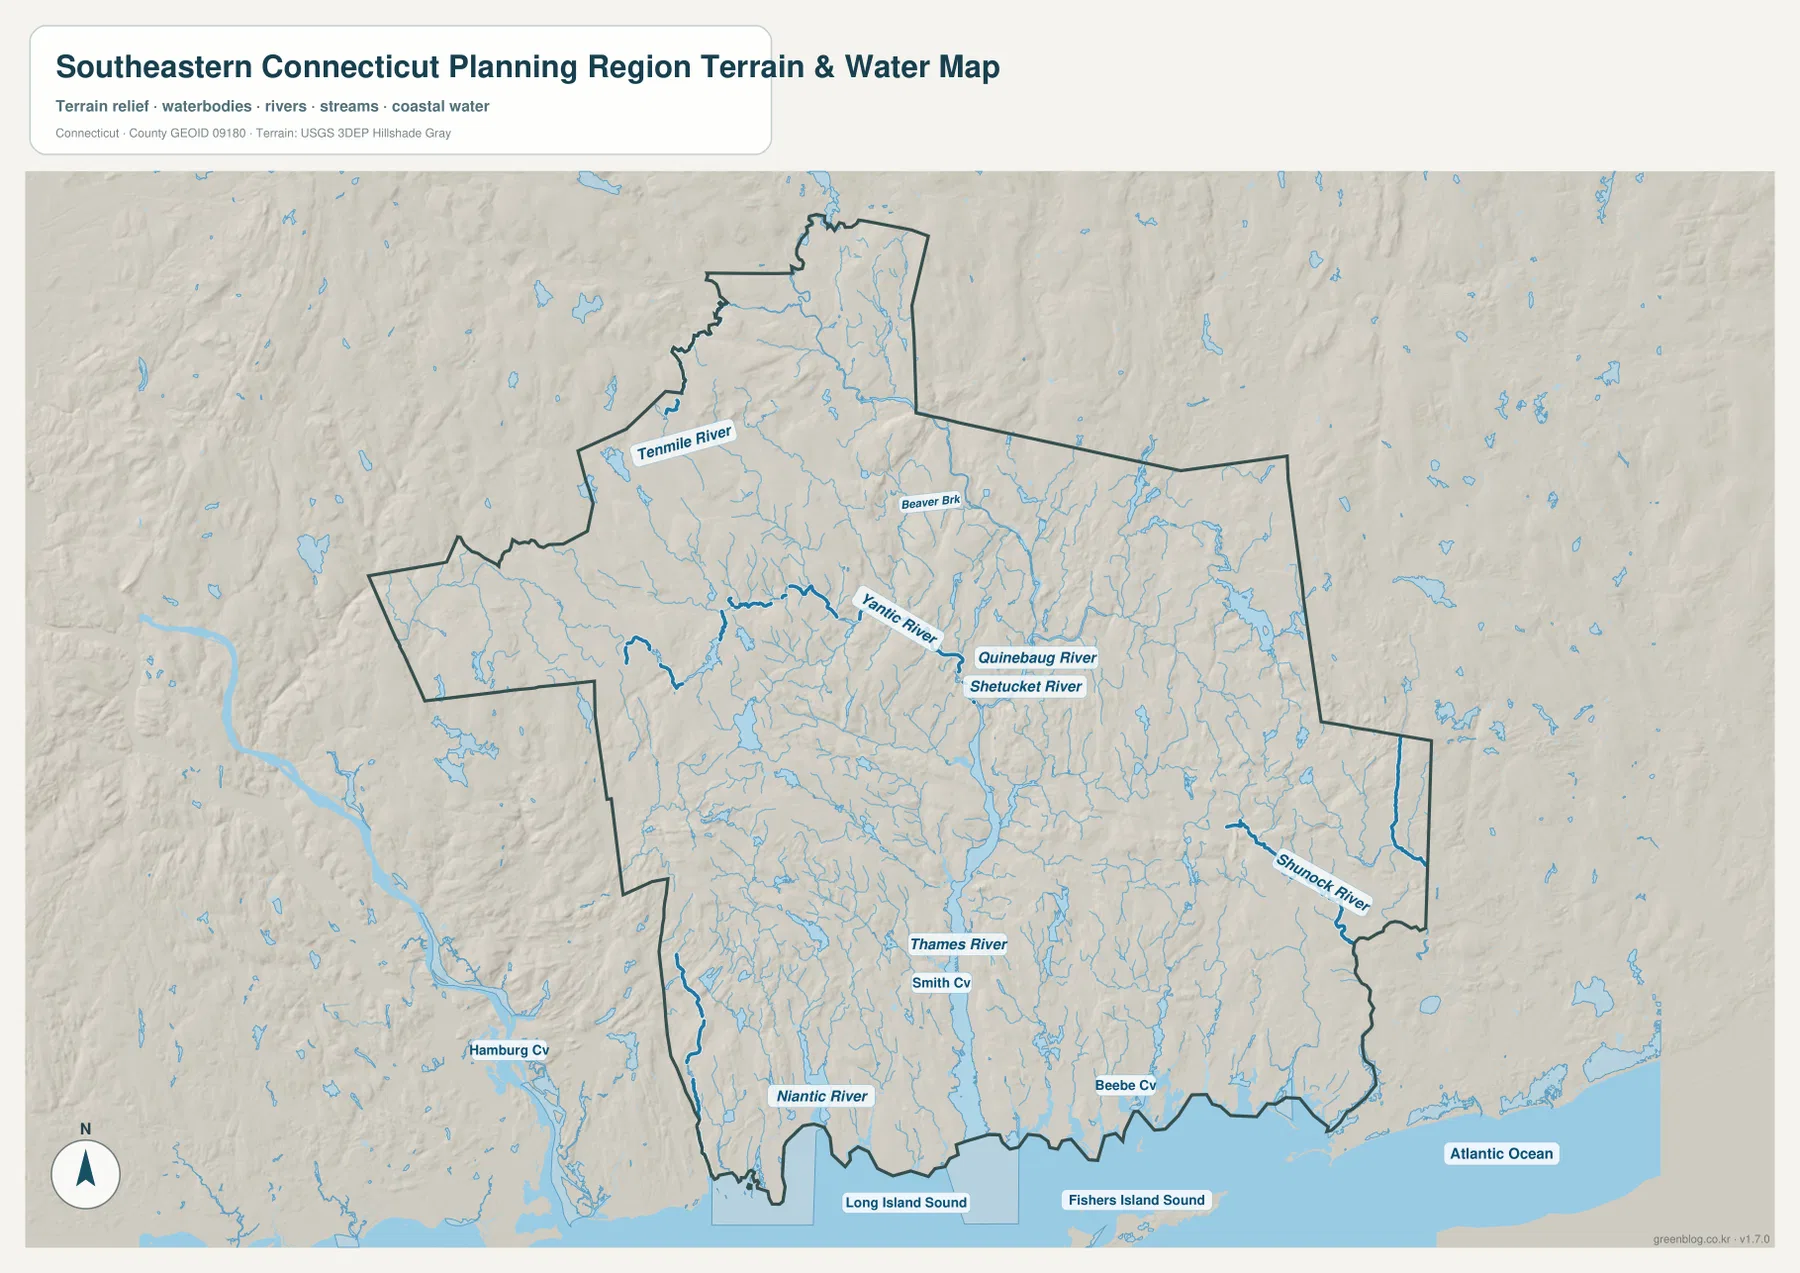
The Thames River continues from the Norwich area toward New London and Groton, widening as it approaches the coast. Smith Cove is labeled along the lower part of the river system. South of the land boundary, Long Island Sound fills the central coastal edge, Fishers Island Sound is named farther east, and the Atlantic Ocean label appears beyond the southeastern side. The map therefore covers a clear transition from inland freshwater rivers to an estuary and coastal waters rather than stopping at the shoreline.
Other waterways show that the drainage is not limited to the Thames. The Niantic River appears near the southwestern coast, while the Shunock River runs through the southeastern interior. Tenmile River is labeled in the northwest, and Beaver Brook appears farther north toward the center. Numerous smaller blue lines fill the spaces between the named rivers. That density matters because the region’s rolling terrain is crossed by many local streams even where the general road map gives more visual attention to highways and settlements.
A few water labels outside the dark boundary provide useful context but should remain outside the core description. Hamburg Cove is visible to the southwest beyond the subject outline, for example. Beebe Cove is labeled near the eastern coast, where Mystic and Stonington lie close to a complicated shoreline. Comparing the boundary and water layers helps distinguish internal features from nearby reference points and prevents a familiar coastal name from being assigned to the wrong planning region.
Shaded relief adds broad landform information. The coastline is low relative to many inland areas, while small ridges and valleys repeat farther north. The shading is useful for seeing why rivers curve and why local roads do not form a uniform grid, but it is not survey-grade elevation data. The blue water features are also not a flood-insurance, navigation, water-depth, water-quality, or legal-shoreline product. Those decisions require current FEMA, Connecticut DEEP, municipal, or other authoritative sources.
Long Island Sound is a major part of the region’s geographic setting, and Connecticut DEEP maintains separate official information on coastal management, access, water quality, wetlands, and coastal hazards. This map provides the geographic frame for New London, Groton, Mystic, and Stonington, but it should not replace those specialized coastal resources. It is most useful for answering the first question: where do the inland rivers meet the estuary and which coastal communities sit around that connection?
Read the region from the Norwich river junction to the eastern Sound
For a first visit to the map, find Norwich and New London before anything else. Norwich gives the inland reference point where major roads and rivers gather. New London gives the coastal reference point on the west side of the Thames estuary. Place Groton across the river, then follow the coast east through Mystic and Stonington toward Pawcatuck. After that, move back inland to Jewett City and north toward the Willimantic extension, then west to Colchester. This order turns the irregular outline into a series of recognizable steps.
If settlement distribution is the main question, start with the city index and compare inland Norwich with the New London–Groton coastal pair. Then use the general map to add Mystic, Pawcatuck, Old Mystic, Colchester, and the smaller labeled places. If rivers are more important, begin with the Yantic and Shetucket, follow them into the Thames, and continue south to Long Island Sound. Returning to the road map afterward shows how Norwich, New London, and Groton sit beside that river system.
The downloadable originals are landscape-oriented JPG files measuring 3638 by 2572 pixels each. They preserve more detail than the WebP previews when small road numbers, place labels, or water names are enlarged. The archive contains the boundary-and-road map, the six-place city index, and the terrain-and-water map. They are suitable for printed handouts, classroom work, presentations, or personal geographic reference, while active navigation should rely on a current road source.
When comparing this page with older Connecticut material, check the geographic system first. Current Census county-level products can use planning regions, while historic sources may be organized around older county names such as New London County. The areas overlap in ways that can look familiar without being identical. This page follows the Southeastern Connecticut Planning Region boundary identified by the supplied package and current county-equivalent geography.
Frequently Asked Questions
Should I use Norwich or New London as the main reference point?
Use Norwich when the question is about the inland road and river network, because Routes 2, 12, and 32 and the Yantic–Shetucket river system are easy to orient from there. Use New London and Groton together when the focus is the coast, the lower Thames River, or access to Long Island Sound. Switching reference points according to the task makes this unusually shaped planning region much easier to understand.
Are the six numbers in the city index current population estimates?
This page treats them only as the values printed in the supplied city-index map: Norwich 39,973, New London 27,625, Groton 9,490, Jewett City 4,329, Stonington 934, and Groton Long Point 546. The map does not provide enough information here to silently relabel them as a different statistical year. For current official population estimates, consult the U.S. Census Bureau directly.
Can the water map be used to judge flood zones or coastal access rules?
No. It is a regional reference showing the general positions of the Thames, Yantic, Shetucket, Quinebaug, and other rivers together with Long Island Sound and broad shaded terrain. Flood zones, coastal permits, navigation, water depth, shoreline rights, and property boundaries require current specialized information from FEMA, Connecticut DEEP, municipalities, or other responsible agencies.
Sources and reference material
- Southeastern Connecticut Council of Governments: official regional organization and member-municipality information.
- U.S. Census Bureau QuickFacts – Southeastern Connecticut Planning Region: current county-equivalent identification and regional statistics.
- U.S. Census Bureau TIGER/Line Shapefiles: boundary and geographic reference data.
- USGS National Hydrography: official river, stream, and water reference data.
- Connecticut DEEP – Long Island Sound: official coastal, water-quality, habitat, and management information.
Map File Information
Download the Southeastern Connecticut Planning Region boundary-and-road map, six-place city-index map, and terrain-and-water map as three high-resolution JPG files in one ZIP archive.
- Included Files: 3 maps
- File Type: JPG files in a ZIP archive
Related Maps
Green Map creates custom-edited map images using open geographic data sources such as geoBoundaries, Natural Earth, OpenStreetMap, and government open data.
These maps are edited visual materials, not raw data files, and are provided for education, documents, presentations, and graphic reference.