You can download four high-resolution JPG maps of Sanborn County in one ZIP file from this page. The maps use Woonsocket as the main settlement and road reference, place Letcher to the south and Artesian to the east, and follow the James River as it winds down the middle of the county. Snake Creek, Redstone Creek, West Redstone Creek, Jim Creek, several lakes, and the elevation layer add a much more detailed picture of how roads, water, and relief fit together.
Woonsocket is the easiest place to start on the general county map. Road 34 crosses the county through the Woonsocket area, and a railroad line also passes through the western-central part before continuing toward Letcher. Forestburg sits farther east along the central road network, Artesian lies in the eastern half, and Upland Colony is marked in the southeast. The settlement pattern is spread across the county rather than concentrated in one corner.
The James River is the strongest physical feature on the other two map layers. It enters from the north, bends repeatedly through the center, and continues south. The elevation legend reports an “Actual” range of about 369 to 418 meters with a mean near 397 meters. The James River valley forms the lowest continuous green corridor, while the eastern edge and parts of the southwest rise into higher tan and brown terrain.
Table of Contents
Use Woonsocket and road 34 to organize the road map
The general county map becomes straightforward once Woonsocket is located. Road 34 runs east-west through the Woonsocket area and continues toward Forestburg and the eastern part of the county. Lane and Alpena appear outside the western boundary and help show where Sanborn County begins, while Fedora and a courthouse label appear beyond the east side. These outside labels are useful orientation points because the county boundary itself is fairly regular and can otherwise blend into the surrounding road grid.
South of the central corridor, roads 22, 21, 7, and 2 break the interior into smaller sections. Around Letcher, road 4 and the railroad line provide strong references. The southern boundary carries labels 80, 11, 23, 37, and 35, while the northeast contains roads 12, 15, 27, 25, and 24. There are many numbers on the map, but the easiest reading order is Woonsocket first, then the Forestburg–Artesian direction, and finally Letcher and the south.
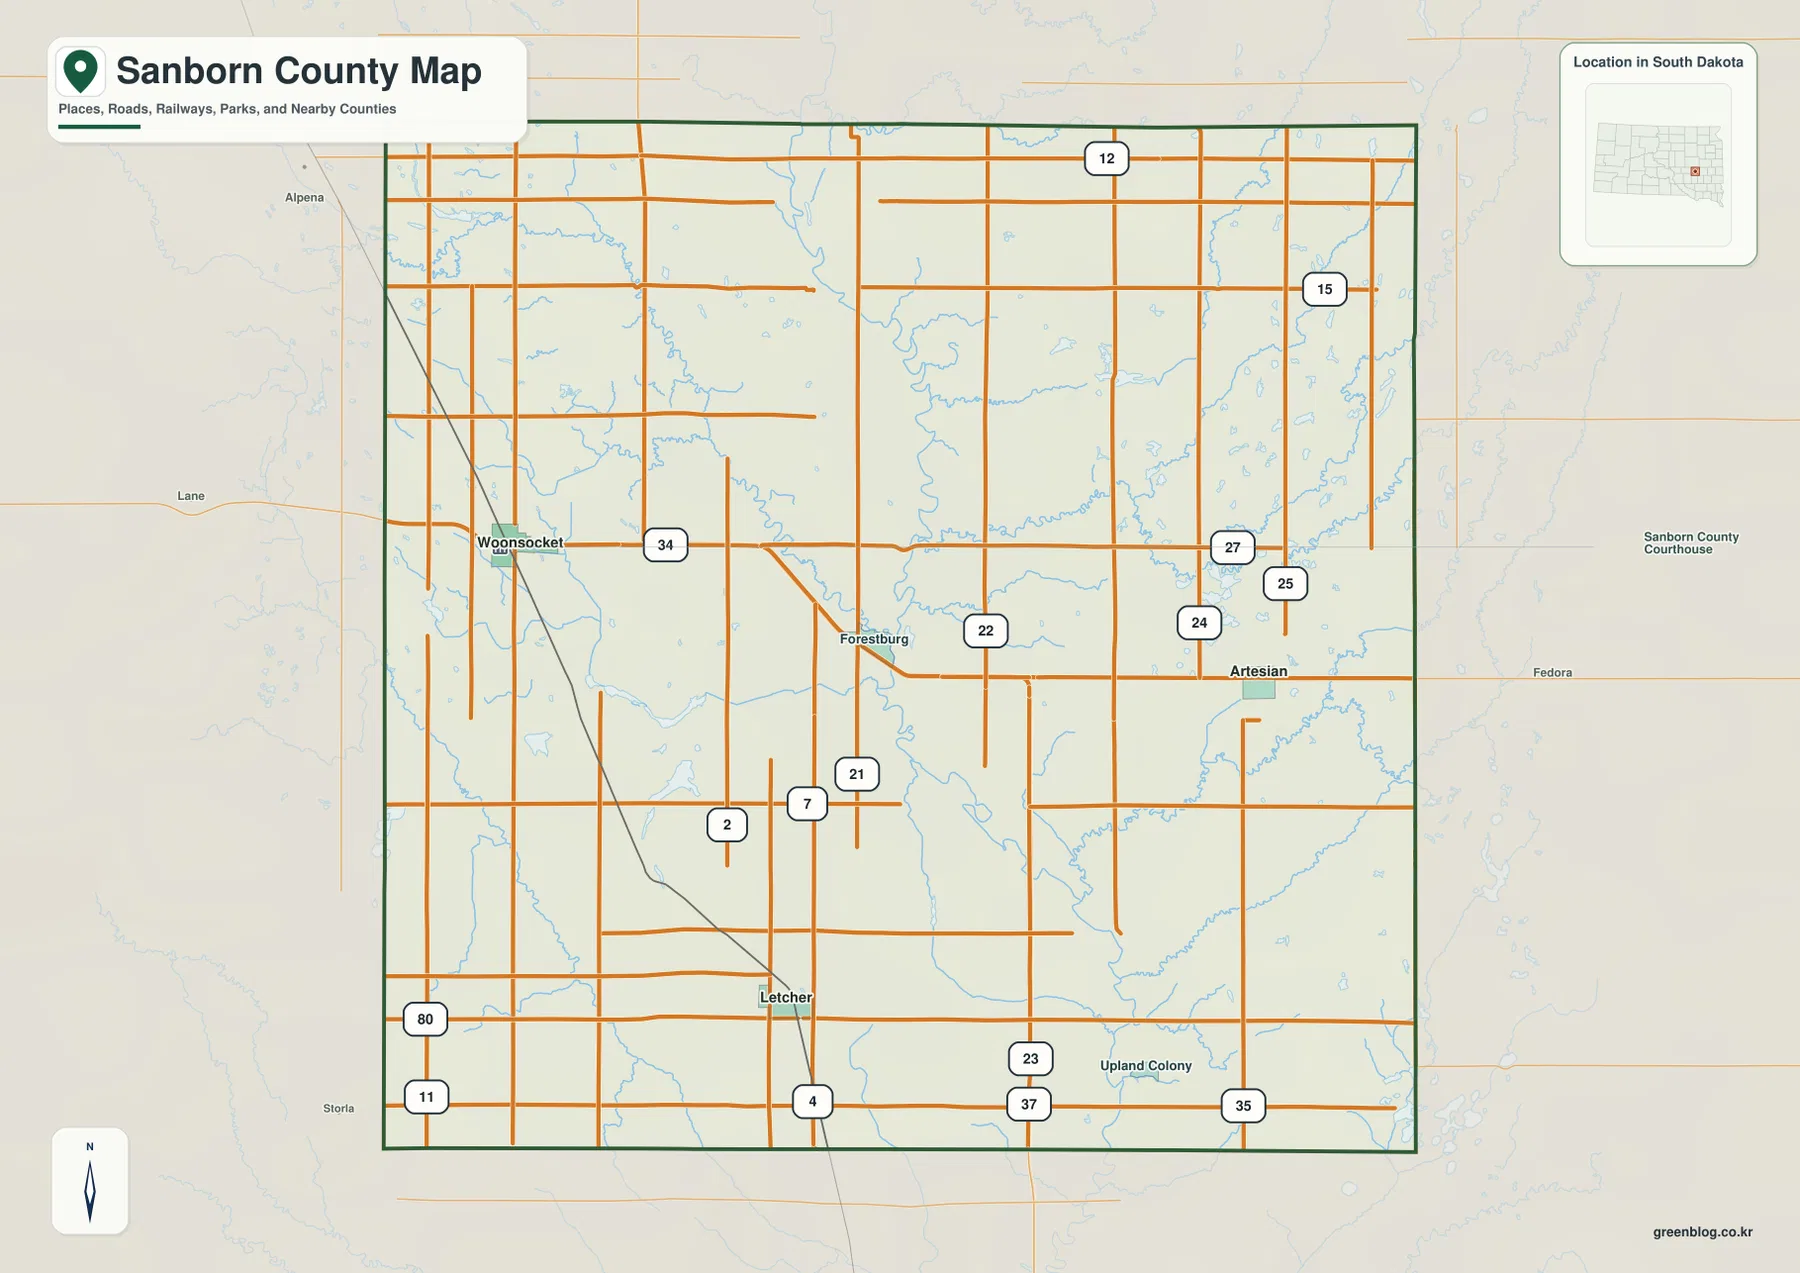
Blue drainage lines are visible throughout the road map, especially around the central James River corridor and across the eastern half near Artesian. Smaller tributaries also cut through the northwestern part of the county. Those water features are easier to understand on the terrain-and-water layer, where the largest channels are named and their connections to the James River become much clearer.
Woonsocket connects directly to Letcher and Artesian
The city-connections map uses Woonsocket as the hub and draws direct lines to Letcher and Artesian. Letcher is south of Woonsocket, while Artesian lies farther east. The different directions make Woonsocket a practical anchor for understanding how the county’s three ranked cities relate to one another. Neighboring-county labels around the map also provide useful orientation, including Beadle, Miner, Hanson, Kingsbury, Jerauld, Aurora, and Davison counties.
The CITY CONNECTIONS legend lists Woonsocket to Letcher at about 12 miles and Woonsocket to Artesian at about 17 miles. These are straight-line distances between the mapped points, not driving distances along the road network. Actual road mileage can be longer and depends on the route used, so the labels are best treated as a quick geographic comparison rather than a routing guide.
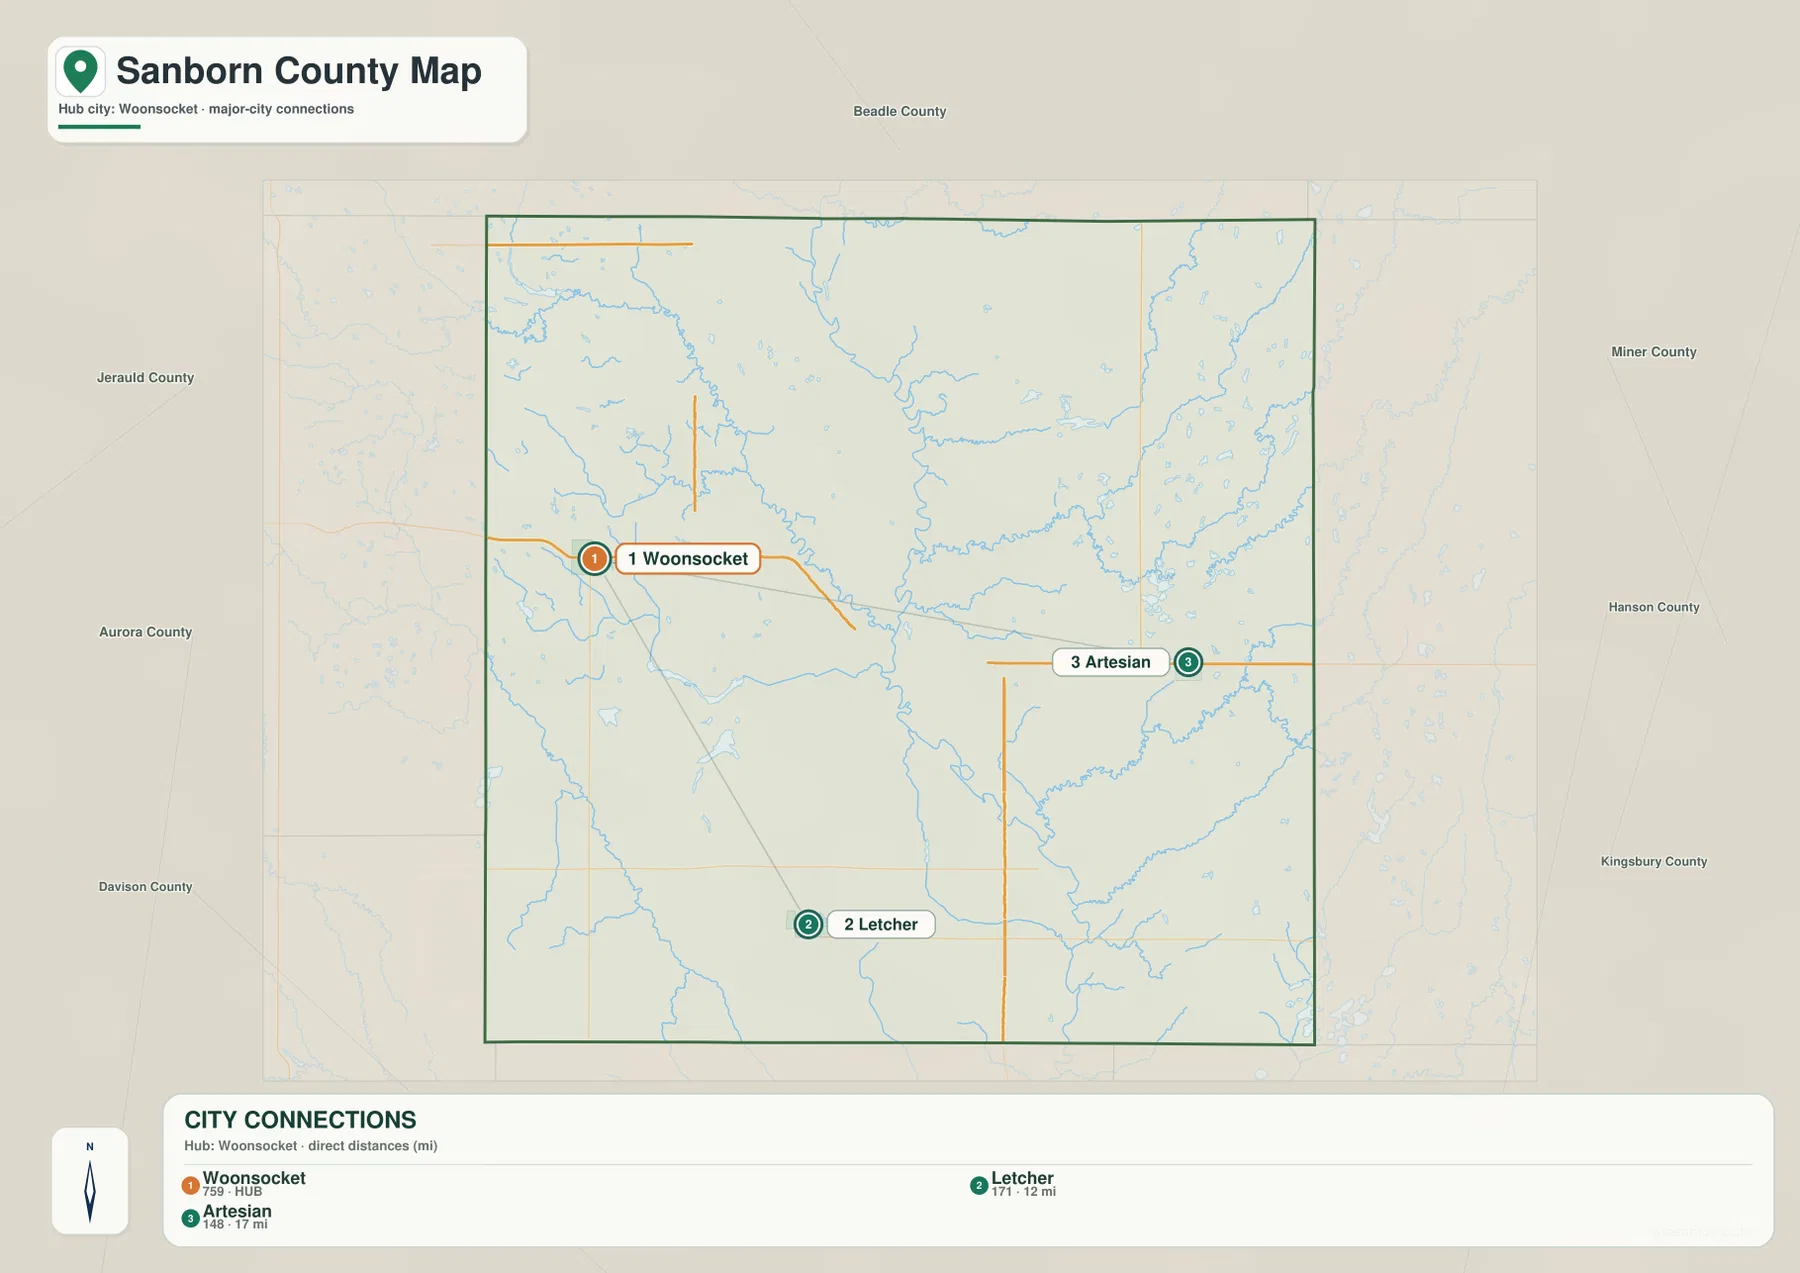
The CITY INDEX numbers are identifiers for the labels: Woonsocket is 1, Letcher is 2, and Artesian is 3. They do not represent population rank, travel sequence, elevation, or mileage. Use the printed mile values for direct-distance comparison and a current routing source when an actual driving distance is required.
James River gathers Snake Creek and the Redstone Creek system
James River is the dominant water feature on the terrain-and-water map. It enters from the north, follows a strongly meandering course through the county center, and continues south. Snake Creek approaches from the northwest and bends toward the James River corridor. On the eastern side, Redstone Creek runs westward through the interior, while West Redstone Creek forms a separate winding channel closer to the county edge.
Jim Creek provides a strong southeastern reference, and Dry Run is labeled in the southwest. Named lakes are spread across several parts of the county: McCoy Lake and Long Lake lie in the western interior, Letcher Lake is farther south, and Rifle Lake is east of the James River in the upper half. County Ditch No. 9, No. 28, and No. 14 are also labeled, so the map includes managed drainage features alongside natural streams and lakes.
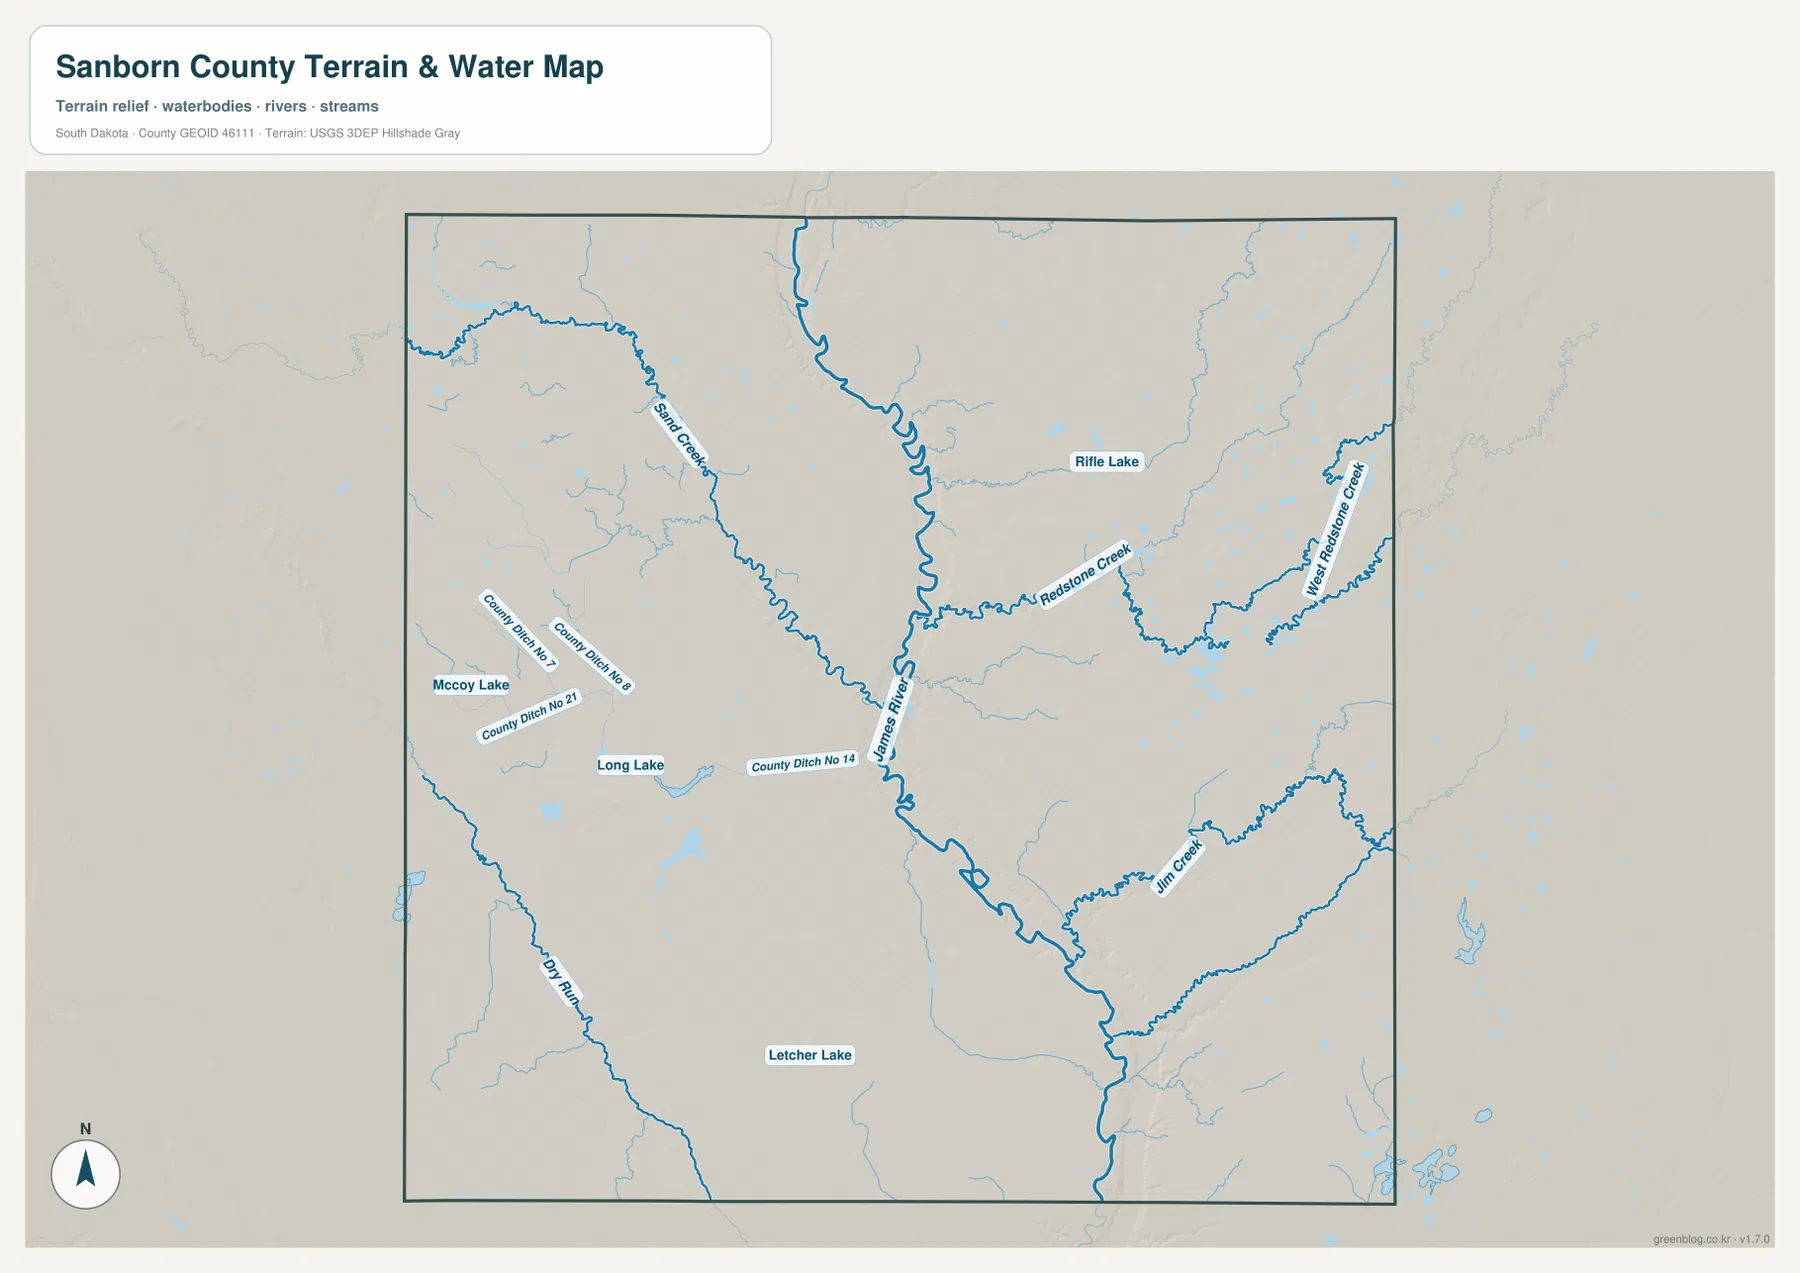
This water layer is a geographic reference for stream, lake, and drainage-ditch names and positions. It does not show real-time flow, water depth, water quality, flood zones, or navigability, and a blue line should not be treated as a property or legal boundary. For current hydrographic source data, consult an authoritative dataset such as USGS National Hydrography.
Elevation ranges from about 369 to 418 m, with the James River valley lowest
The elevation map’s “Actual” line reports about 369 to 418 meters with a mean near 397 meters. The James River valley is the darkest continuous green feature and marks the lowest major corridor through the county. Moving east from the river, the surface rises through light green and tan into broader brown terrain near the eastern edge. The southwestern margin also contains higher ground, so the county’s uplands are not limited to one side.
The tributaries cut lower channels through the surrounding terrain. Snake Creek descends from the northwest toward the central lowland, while Redstone Creek and Jim Creek form green grooves across the higher eastern side. Long Lake and McCoy Lake also sit within relatively low western terrain. Comparing the water map with the elevation layer makes the relationship easy to see: the main streams generally occupy the lower corridors, while the land between them rises into modest ridges and uplands.
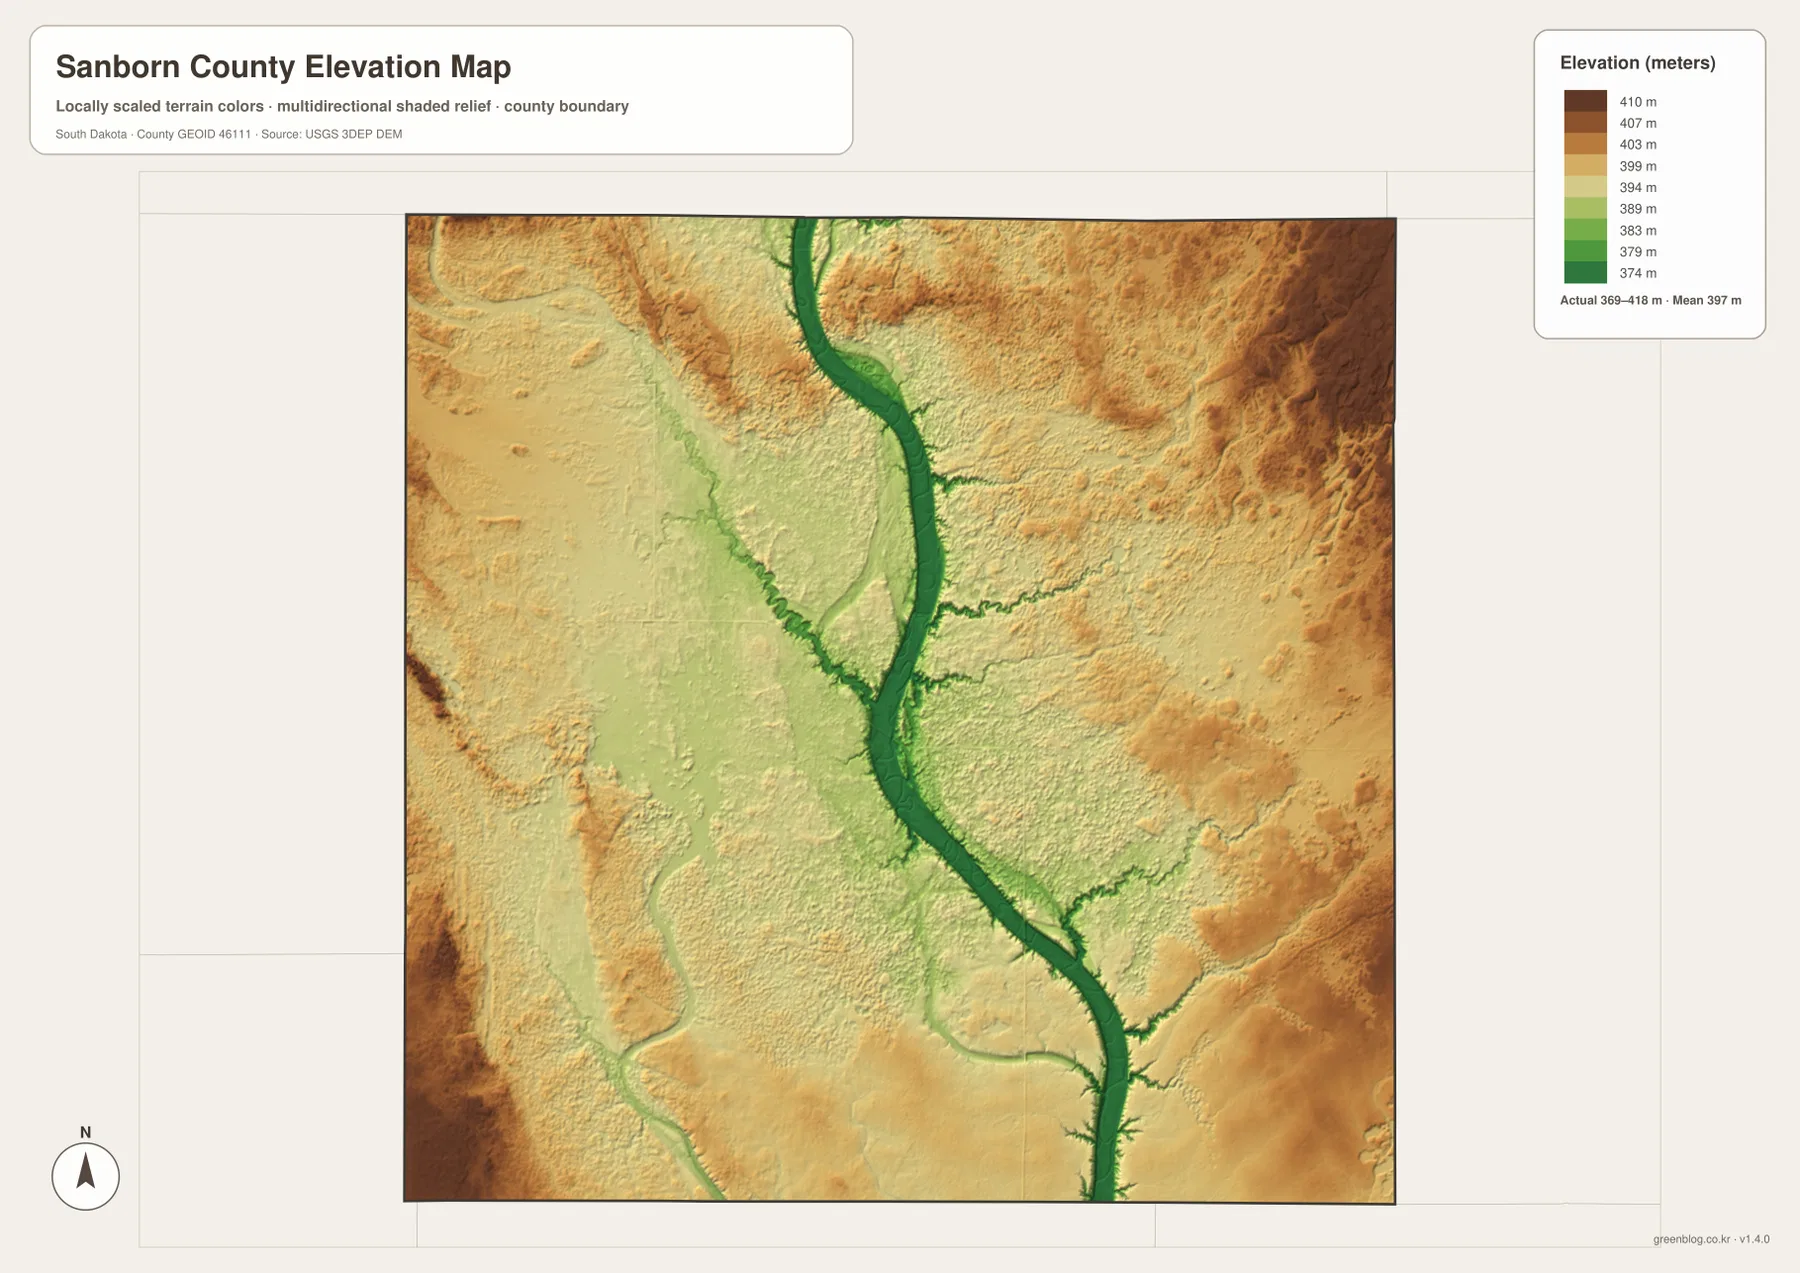
The elevation colors are designed for broad county-scale comparison rather than site measurement. They cannot provide a survey-grade elevation for a road point, building site, field corner, or engineering location. When a precise value is required, use official DEM products such as the USGS 3D Elevation Program or an appropriate survey.
Compare Artesian and Letcher to see two different parts of the county
Artesian is a useful reference for the eastern side. On the general map it sits within a dense road network east of the James River, and the water layer places it closer to the Redstone Creek system. The elevation map shows broader high ground farther east, interrupted by the lower creek valleys. Following Artesian across the map layers gives a clear example of how settlement, drainage, and relief overlap.
Letcher provides a southern comparison. The city map places it about 12 straight-line miles from Woonsocket, while the general map shows the railroad and several roads crossing the Letcher area. Letcher Lake and the southern James River corridor are nearby on the water map, and the elevation layer shows the central lowland meeting somewhat higher ground toward the southwest. Checking Artesian and Letcher alongside Woonsocket makes the county’s east-south differences easier to understand.
The WebP images in the article are optimized for screen viewing. The download archive contains the original JPG files for the general county map, city-connections map, terrain-and-water map, and elevation map. Each JPG is 3638 × 2572 pixels, making the originals more suitable for A3 printing, presentations, classroom materials, and closer inspection of labels.
Frequently Asked Questions
Are the 12 and 17 mile labels from Woonsocket driving distances?
No. The city-connections map identifies them as straight-line distances from Woonsocket to Letcher and Artesian. Actual road mileage can be longer because travel follows the road network rather than a direct line.
Which map best shows James River and the Redstone Creek system?
The terrain-and-water map is the clearest choice. James River runs through the center, Redstone Creek and West Redstone Creek occupy the eastern side, Snake Creek approaches from the northwest, and Jim Creek is labeled in the southeast.
Can the map-legend range of about 369–418 m be used as an exact property elevation?
No. Those values are the county-wide “Actual” range printed on the supplied elevation map, while the colored surface is intended for broad terrain comparison. Use official DEM or survey data when an exact elevation is required at a specific location.
Map File Information
The ZIP contains the original high-resolution JPG files for the Sanborn County general map, city-connections map, terrain and water map, and elevation map.
- Included Files: 4 JPG maps
- Printable Size: 3638 × 2572 px each
Related Maps
Sources and references
- U.S. Census Bureau TIGER/Line Shapefiles – official geographic source for county boundaries and base mapping data.
- USGS National Hydrography – official source for rivers, streams, lakes, and hydrographic data.
- USGS 3D Elevation Program – official source for elevation and DEM products.
- U.S. Census Bureau QuickFacts: Sanborn County, South Dakota – an official county-specific statistics page.
Green Map creates custom-edited map images using open geographic data sources such as geoBoundaries, Natural Earth, OpenStreetMap, and government open data.
These maps are edited visual materials, not raw data files, and are provided for education, documents, presentations, and graphic reference.