McCook County is easiest to understand by starting with Salem near the middle of the county and then looking outward toward Montrose, Spencer, Canistota, and Bridgewater. The maps on this page show the county road pattern, straight-line connections from Salem to nearby towns, the three named Vermillion River branches and other waterways, and a clear rise in elevation toward the east. The same maps are also available as original high-resolution JPG files in one downloadable ZIP archive.
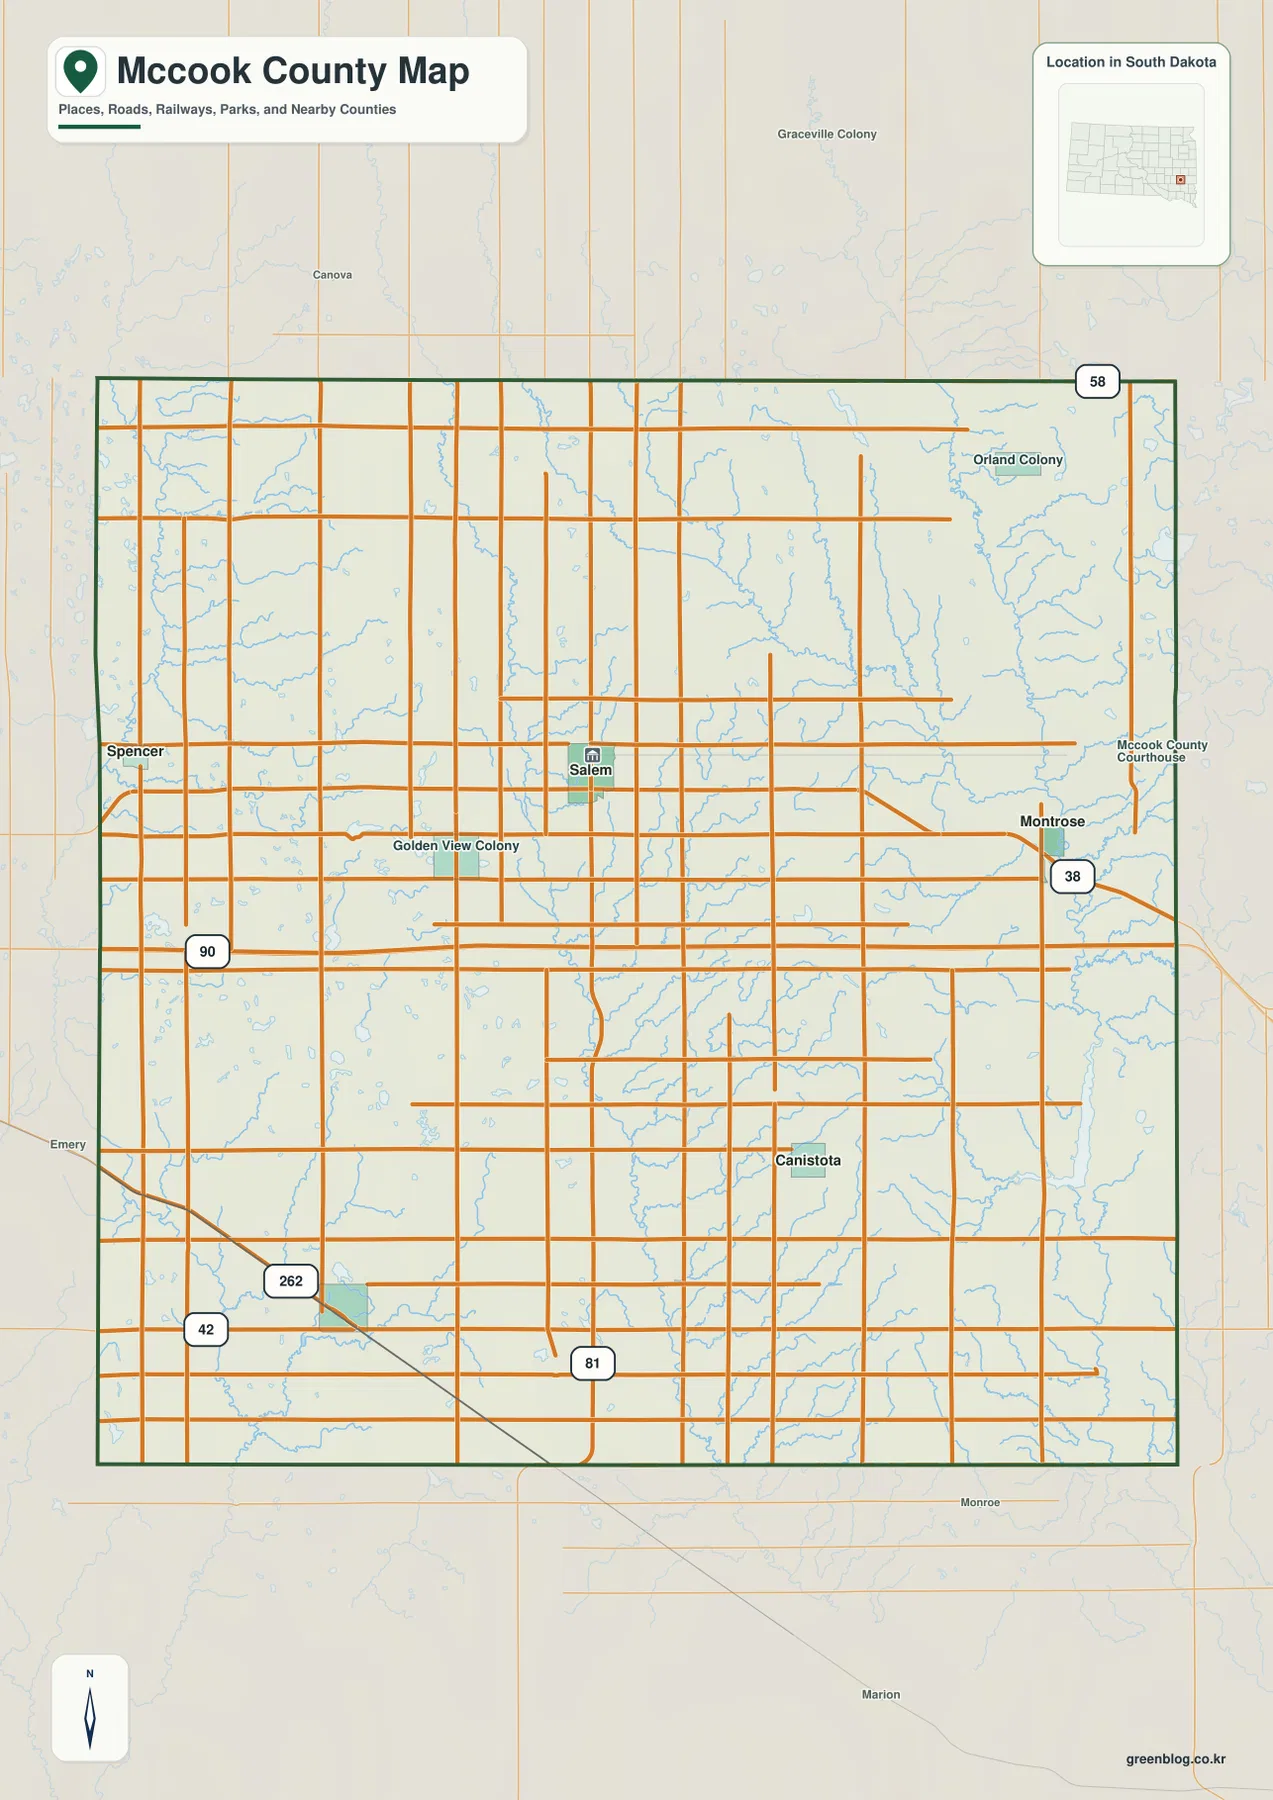
The general county map has a strong grid pattern. Salem sits near the center where north-south and east-west roads meet, Spencer is near the western side, Montrose is on the east, and Canistota lies to the south. Bridgewater appears farther southwest on the city map, while Orland Colony is marked in the northeast on the general map. Because many roads run in long straight segments, the towns can be located quickly once Salem is found.
The water network looks very different from the road grid. The West Fork Vermillion River runs through the central part of the county, the Little Vermillion River bends southeast across the eastern half, and the East Fork Vermillion River follows a long north-south course near the east side. Wolf Creek is labeled along the west, and Battle Creek appears in the southeast. Several lakes and sloughs are concentrated in the western half, including Macke Lake, Gross Lake, Lions Lake, Schimmel Slough, Tuschen Slough, and Lehman Slough.
Elevation helps connect those features. The elevation legend reports an actual range of about 398 to 569 meters with a mean near 458 meters. Much of the west is shown in lower green colors, while the ground rises through the center and becomes distinctly higher along the eastern edge. Narrower low corridors follow the river valleys through that higher terrain, so the county does not simply rise as one smooth slope from west to east.
Table of Contents
Use Salem and the 38–81 road pattern to orient the county
Salem is the most useful anchor on the general map because it is close to the center and sits where several long roads meet. The 38 label appears toward Montrose on the east side, while 81 runs north-south through the central-southern part of the county. Spencer is positioned close to the west boundary, and Golden View Colony appears between Spencer and Salem. Once those locations are established, the rest of the county road grid becomes much easier to follow.
The southern half contains a different set of reference points. Canistota lies south of Salem, and the 42 and 262 labels appear in the southwest. A 90 road label is visible on the western side, while 58 appears near the northeast edge. These labels are useful for map orientation, but they should not be treated as a live traffic layer. Road construction, closures, route conditions, and travel times require current transportation information rather than this static county reference map.
The eastern half also contains a denser pattern of blue stream lines than the west. Around Montrose and farther east, the road grid crosses numerous tributaries. That pattern becomes easier to identify on the terrain-and-water map, where the East Fork Vermillion River and Little Vermillion River are labeled. In the west, smaller creeks, lakes, and sloughs share the map with a road network that visually dominates the flatter low ground.
Salem connects to four nearby towns at similar straight-line distances
The city-connections map uses Salem as the hub and places Montrose to the east, Spencer to the west, Canistota to the south, and Bridgewater to the southwest. This arrangement is useful because it shows that the main named towns are not clustered in one corner. Instead, they form a loose ring around Salem, with three of the four lying at nearly the same direct distance from the hub.
The legend lists Salem to Montrose at about 10 miles, Salem to Spencer at about 10 miles, Salem to Canistota at about 10 miles, and Salem to Bridgewater at about 13 miles. These are straight-line distances, not driving distances measured along roads. A road route can be longer and may change depending on the streets or highways chosen. Use these numbers only as a quick geographic comparison between the hub and the surrounding towns.
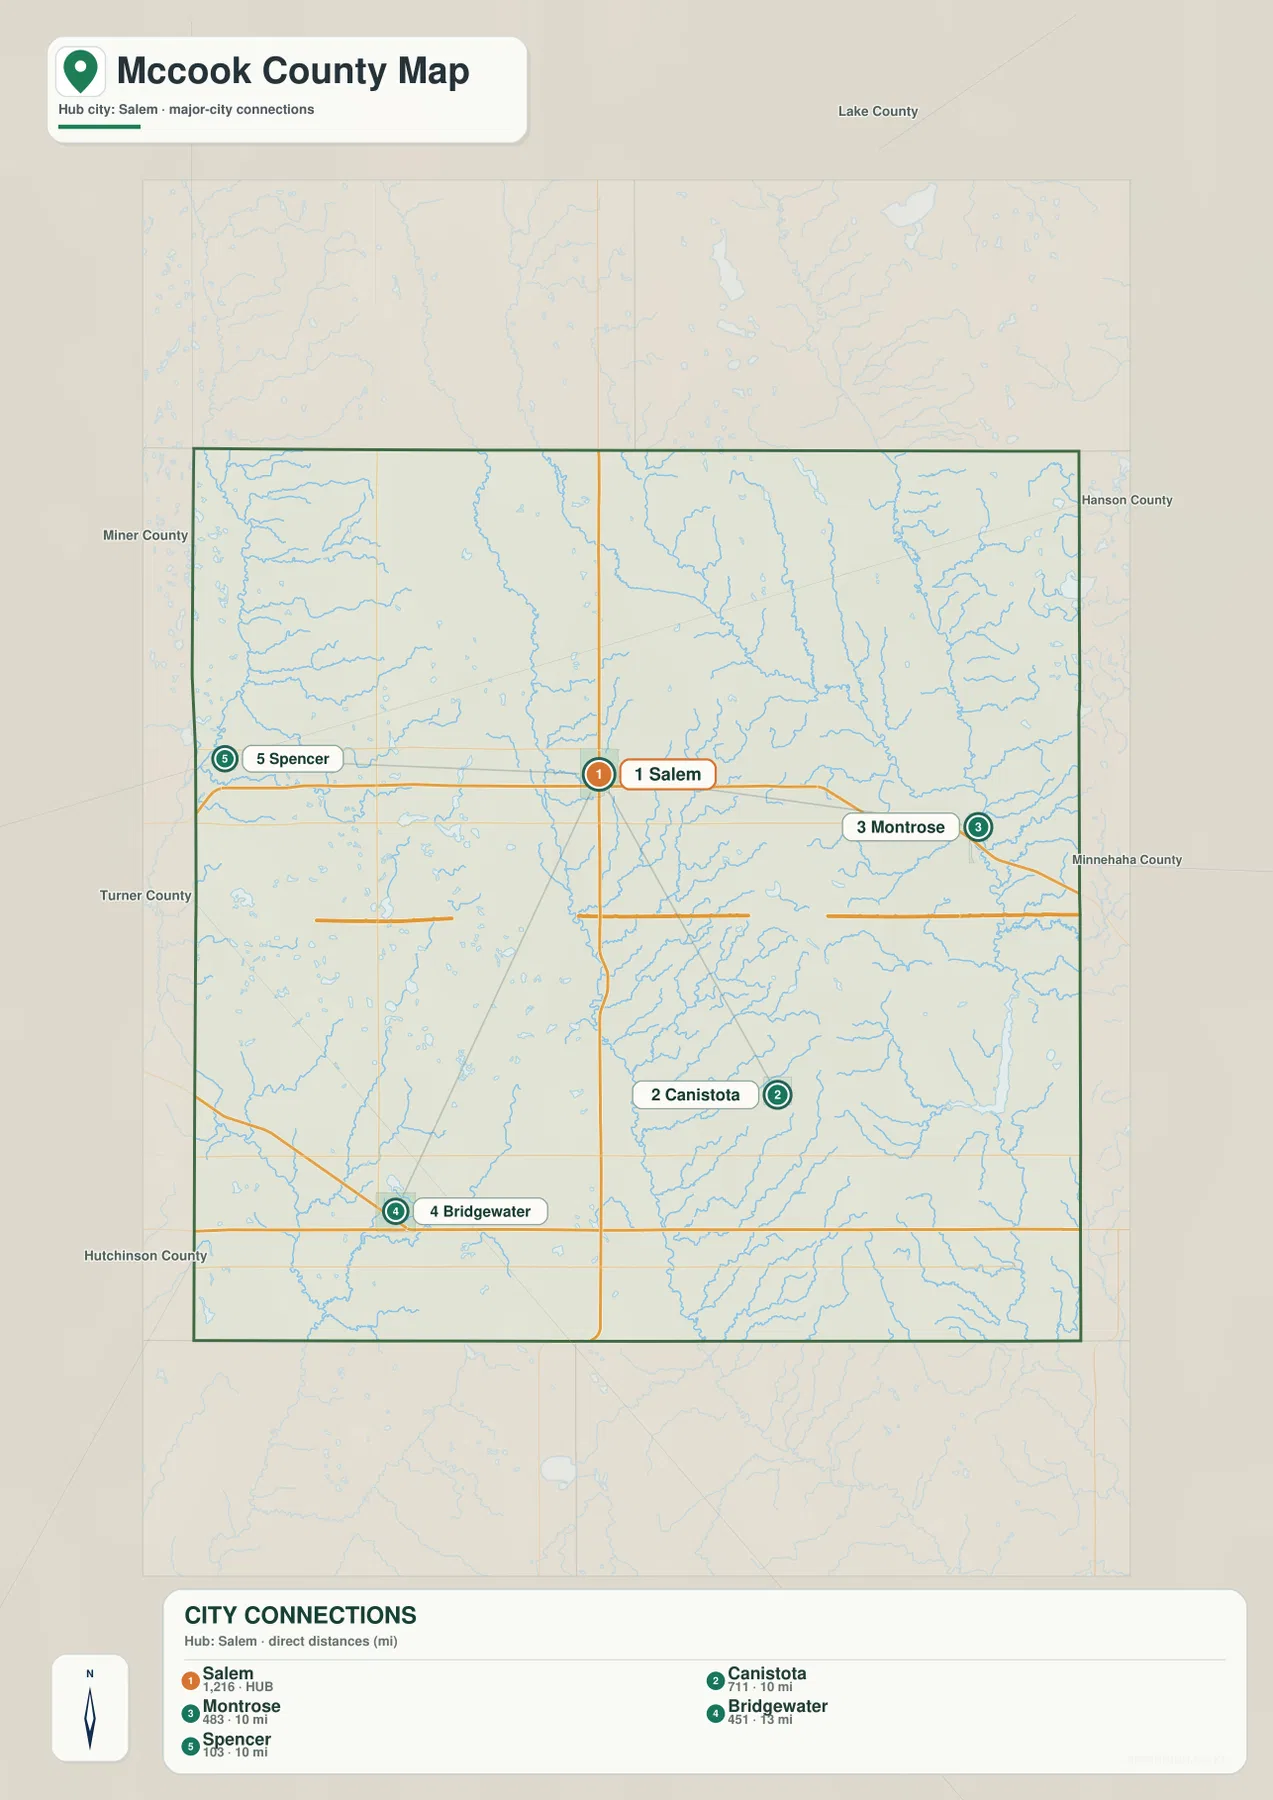
The numbers placed beside the town labels also function as map index markers. They are not mileage values by themselves and should not be interpreted as a ranking of travel importance or local service area. The most useful reading is simply positional: Montrose is east of Salem, Spencer is west, Canistota is south, and Bridgewater is farther southwest. For travel time or road mileage, a current routing source is the appropriate tool.
Three Vermillion River branches shape the central and eastern water network
The terrain-and-water map is dominated by three labels from the Vermillion River system. The West Fork Vermillion River runs south through the central-western interior. The Little Vermillion River enters from the north-central area and bends southeast through the eastern half. Near the east side, the East Fork Vermillion River follows a longer north-south corridor. Together they create several low valleys that divide the central and eastern terrain.
The west side has a different water pattern. Wolf Creek runs close to the western boundary, while Macke Lake, Gross Lake, and Lions Lake sit in the western interior. Schimmel Slough, Tuschen Slough, and Lehman Slough are labeled nearby. In the southeast, Battle Creek joins the network of smaller streams that lead toward the East Fork side. The map therefore combines larger river corridors in the east with a scattered group of smaller lakes and wetland-like water bodies farther west.
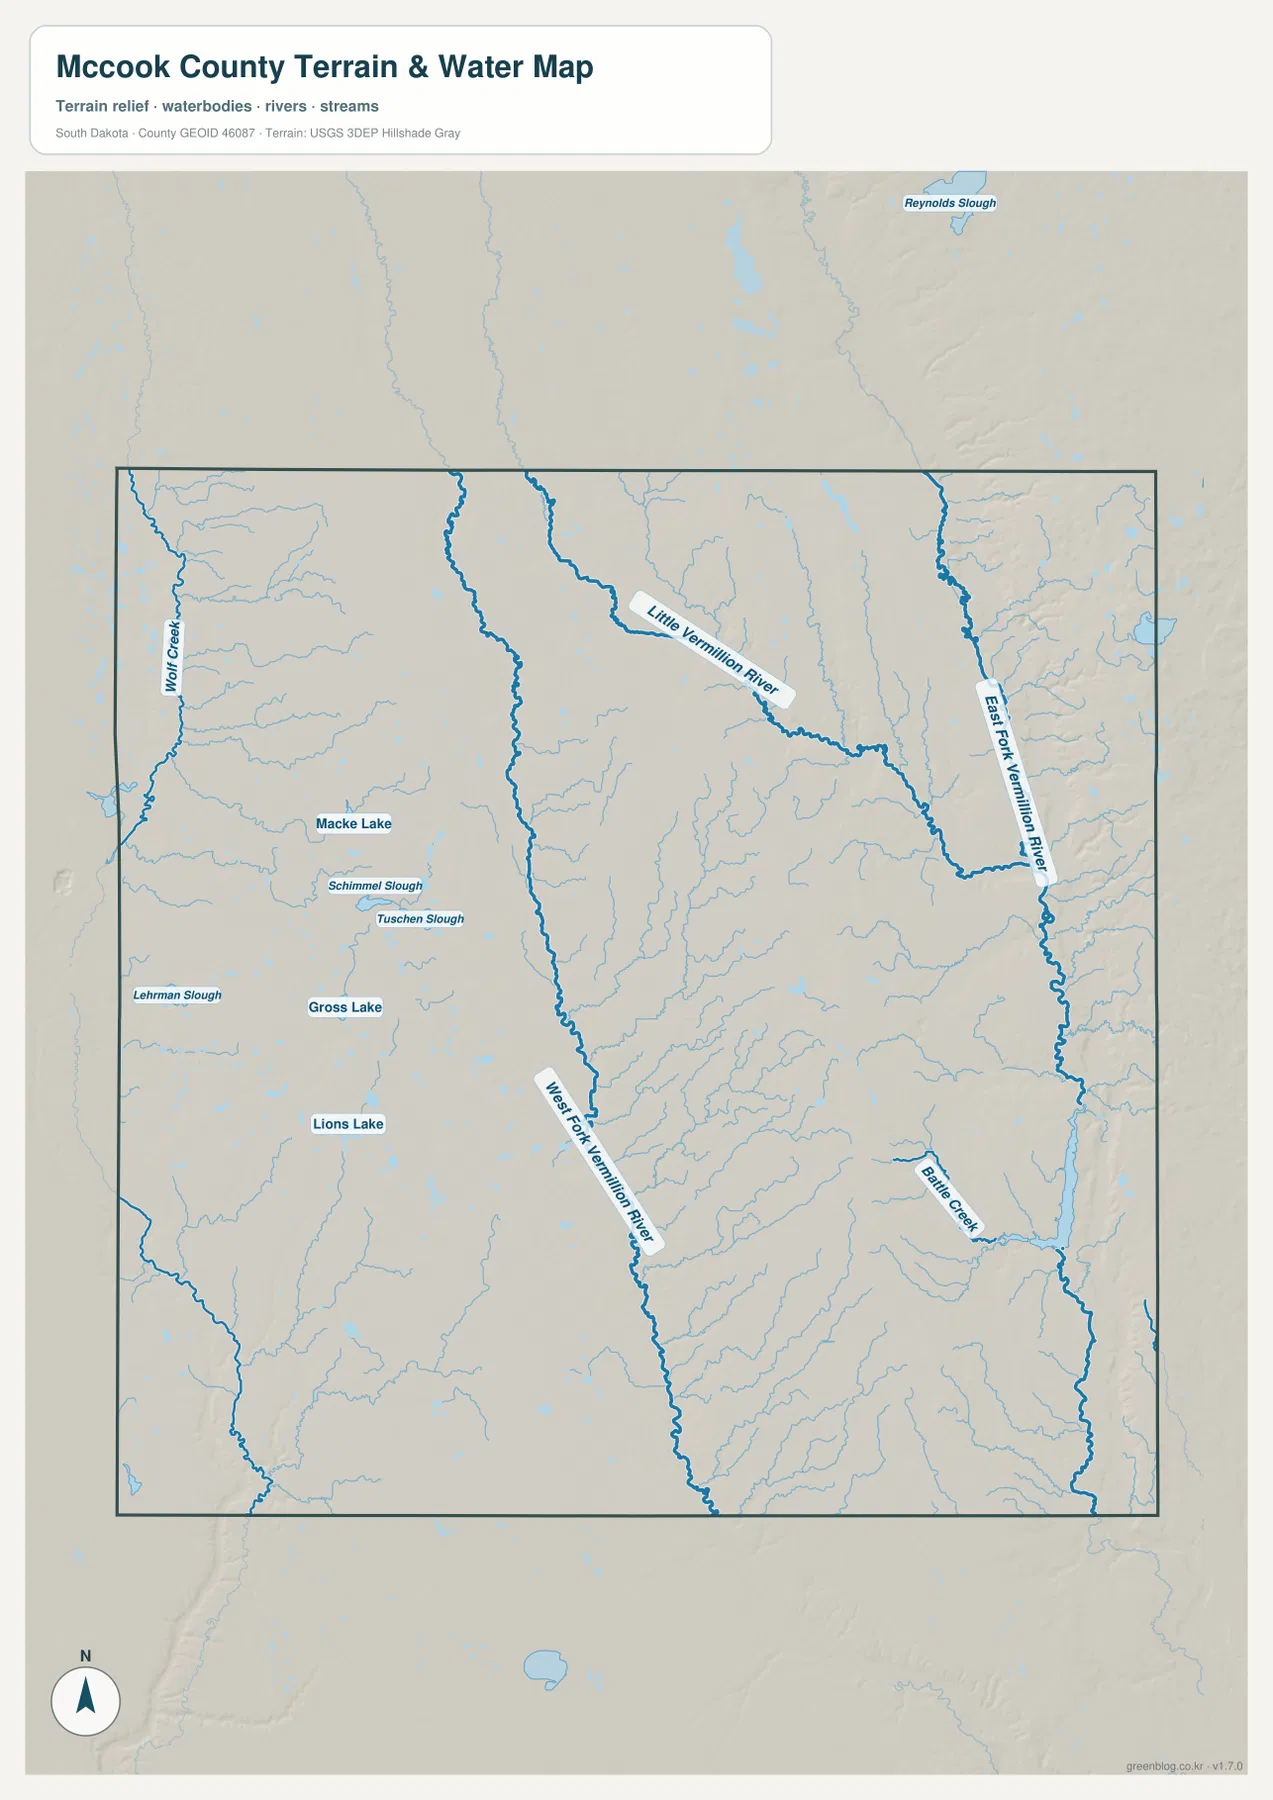
This is a geographic water-reference map. The blue lines and water-body labels do not show flood zones, water depth, water quality, navigability, or real-time streamflow. They also should not be used to establish parcel ownership or a legal riverbank boundary. If current hydrography or detailed source geometry is required, consult an authoritative dataset such as the USGS National Hydrography source listed below.
Elevation rises from roughly 398 meters in the west to high ground along the east
The elevation legend reports about 398 to 569 meters with a county mean near 458 meters. Broad green areas cover much of the west, showing the lower side of the county. Moving east, the colors become lighter and then shift into tan and brown. The highest-looking terrain forms a strong band near the eastern boundary, especially in the northeast and along parts of the southeast. The listed minimum-to-maximum difference is about 171 meters.
River valleys break through that higher ground. The East Fork Vermillion River follows a narrow green corridor on the east, while the Little Vermillion River cuts a lower diagonal path through the center-east. The West Fork Vermillion River also appears as a lower strip through the interior. These valley shapes match the water map and explain why the eastern half contains both high uplands and sharply lower river corridors rather than one continuous high plateau.
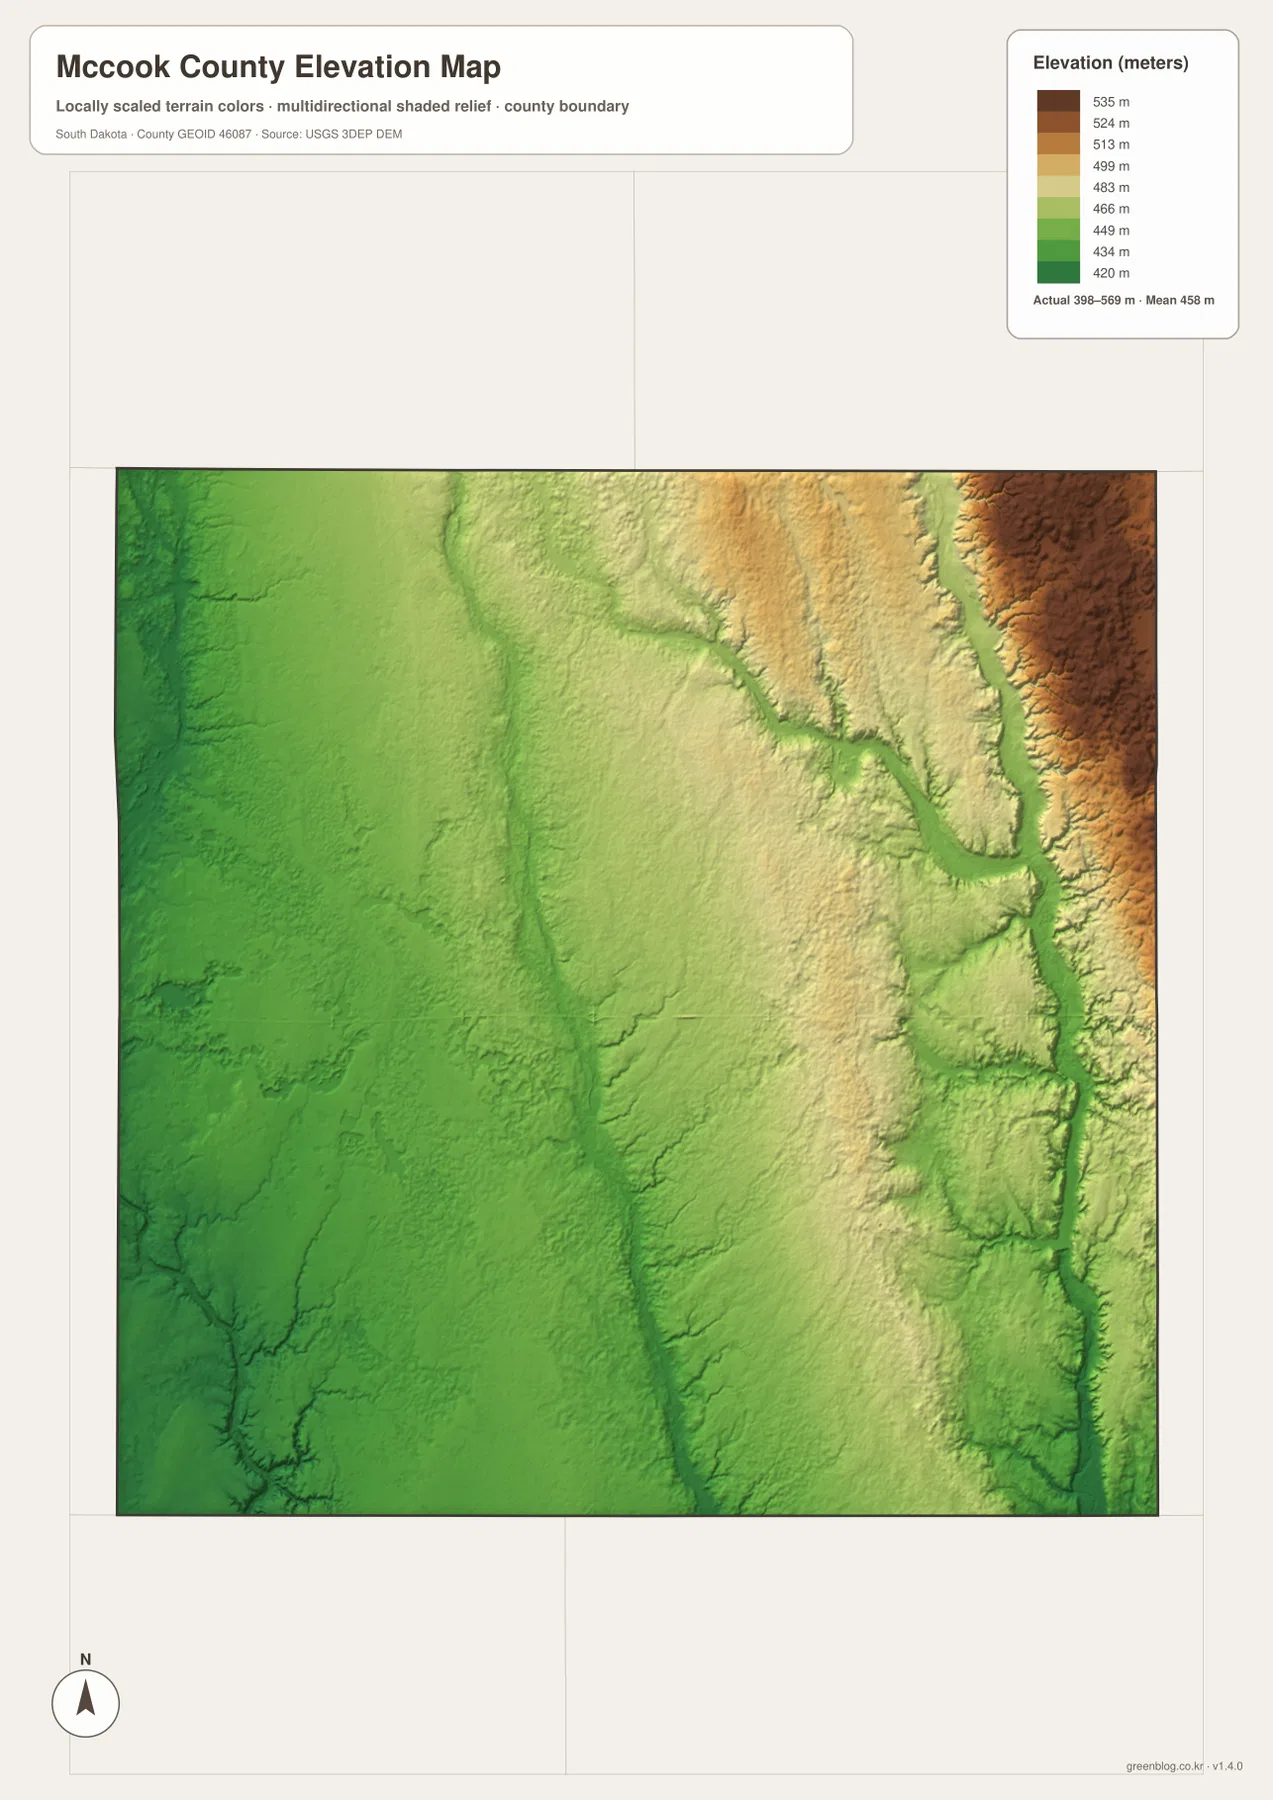
The elevation image is designed for county-scale comparison, not survey work. The color ramp and shaded relief make broad differences visible but do not provide a precise elevation for a house site, road point, field corner, or engineering location. For exact elevation values and source DEM products, use official elevation data such as the USGS 3D Elevation Program.
Compare Montrose and Canistota to match roads, water, and relief
Montrose is a useful reference for the eastern half of the county. On the general map it sits near the 38 road label, while the water map places it in a region crossed by the East Fork Vermillion River system and many tributaries. On the elevation map the same part of the county is substantially higher than the west, although the river corridor itself remains a lower green strip. This makes the Montrose area a good example of how high ground and water-cut valleys sit close together.
Canistota works better for reading the south. It lies south of Salem near the central north-south road pattern. On the water map, the southern interior contains many small tributaries between the West Fork and East Fork Vermillion River corridors. Looking west from Canistota leads toward the lower terrain and the western lakes, while moving east on the elevation map reaches progressively higher ground. Comparing the same location across the four maps makes the county’s road, settlement, water, and relief patterns much easier to connect.
The WebP maps in the article are sized for convenient on-screen viewing. The download archive contains the corresponding original JPG files for the general county map, city-connections map, terrain-and-water map, and elevation map. Each JPG is 2572 × 3638 pixels, making the files more suitable for A3 printing, presentations, and larger personal reference. The water and elevation products remain reference maps, so legal boundaries, flood decisions, navigation, survey measurements, and engineering work require the appropriate current official source data.
Frequently Asked Questions
Are the 10-mile labels from Salem to Montrose, Spencer, and Canistota driving distances?
No. The city-connections map identifies them as direct straight-line distances from Salem. Montrose, Spencer, and Canistota are each shown at about 10 miles, while Bridgewater is about 13 miles away. Actual road distance and travel time can be longer.
Which map is best for finding the West Fork, Little, and East Fork Vermillion River?
The terrain-and-water map is the clearest choice. It labels all three Vermillion River branches and also shows Wolf Creek, Battle Creek, Macke Lake, Gross Lake, Lions Lake, and several sloughs in the western part of the county.
Can I use the elevation colors to determine the exact height of a property?
No. The map gives a county-wide range of about 398–569 meters and a mean near 458 meters, but the relief is generalized for visual comparison. Use official DEM or survey data when you need an exact elevation at a specific location.
Map File Information
The ZIP contains the original high-resolution JPG files for the McCook County general map, city-connections map, terrain and water map, and elevation map.
- Included Files: 4 JPG maps
- Printable Size: 2572 × 3638 px each
Related Maps
Sources and references
- U.S. Census Bureau TIGER/Line Shapefiles – official geographic source for county boundaries and mapping data.
- USGS National Hydrography – official source for rivers, streams, lakes, and hydrographic data.
- USGS 3D Elevation Program – official elevation and DEM source.
- 2020 Census PL County Name API – Census API used by the package to identify McCook County, South Dakota.
Green Map creates custom-edited map images using open geographic data sources such as geoBoundaries, Natural Earth, OpenStreetMap, and government open data.
These maps are edited visual materials, not raw data files, and are provided for education, documents, presentations, and graphic reference.