You can download the four high-resolution JPG maps for Lincoln County, South Dakota, in one ZIP from this page after reviewing the map set below. The county map places Harrisburg and Tea near the north, Canton on the east, Lennox to the west, Worthing near the middle, and Hudson in the southeast. The water map adds the Big Sioux River, Ninemile Creek, Beaver Creek, Saddle Creek, and several named lakes, while the elevation map shows about 358 to 477 meters of relief. Seen together, the maps make it easier to connect the county’s towns and roads with the river lowlands along the east and the higher ground in the northwest and south-central interior.
A useful way to orient yourself is to begin at the northern edge of the county map, where Sioux Falls is labeled above Harrisburg and Tea. Harrisburg lies farther east than Tea, while Canton sits against the eastern side of the county and Lennox marks the west-central side. Worthing falls between those areas, and Hudson is much farther south near the eastern boundary. The road map includes labels for 29, 44, 115, 18, 11, 131, 17, and 116. This page refers only to the numbers and locations actually printed on the supplied map rather than assigning road classes that are not stated in the package.
The water system gives the eastern side of the county a very different visual character from the road map. The Big Sioux River follows much of the irregular eastern edge, and several smaller streams run toward that side. Ninemile Creek crosses the north toward Lake Alvin, Beaver Creek cuts across the middle, and South Fork Beaver Creek and Little Beaver Creek appear farther south. Long Creek runs close to the western side, while Saddle Creek and Prairie Creek stand out in the southern half. Lake Albert, Lake Lakota, and Carlson Lake provide additional reference points away from the main river.
Relief is not a simple west-to-east slope. The elevation legend gives an actual range of about 358 to 477 meters and a mean of about 420 meters. Low green terrain follows much of the Big Sioux River side and appears in other stream valleys, but higher brown terrain occupies a broad area in the northwest and another substantial area in the south-central part of the county. Smaller ridges and valleys break up those higher zones. For that reason, the elevation map is most useful when read next to the water map instead of reducing the county to a single directional trend.
Table of Contents
Start with Harrisburg, Tea, and the roads south of Sioux Falls
On the general county map, Harrisburg and Tea are the easiest northern anchors. Harrisburg appears near the upper center, with Tea to the west, while the Sioux Falls label provides orientation immediately above them. The concentration of roads and developed areas in this part of the map is noticeably denser than in the southern half. Moving east brings you toward Canton, and moving west brings you toward Lennox. Worthing sits between those outer towns and helps connect the central road layout to the rest of the county.
Several numbered roads make the layout easier to follow. The route labeled 29 runs north–south west of Harrisburg, and 115 also runs north–south through the central part of the county. The road marked 44 crosses the middle from the Lennox side through the Worthing area toward Canton. Farther south, 18 forms a clear east–west reference, while 11 and 131 are shown on the eastern side. The map is useful for locating the main numbered corridors, but it is not a live traffic or construction map, so current closures and driving conditions require a separate up-to-date source.
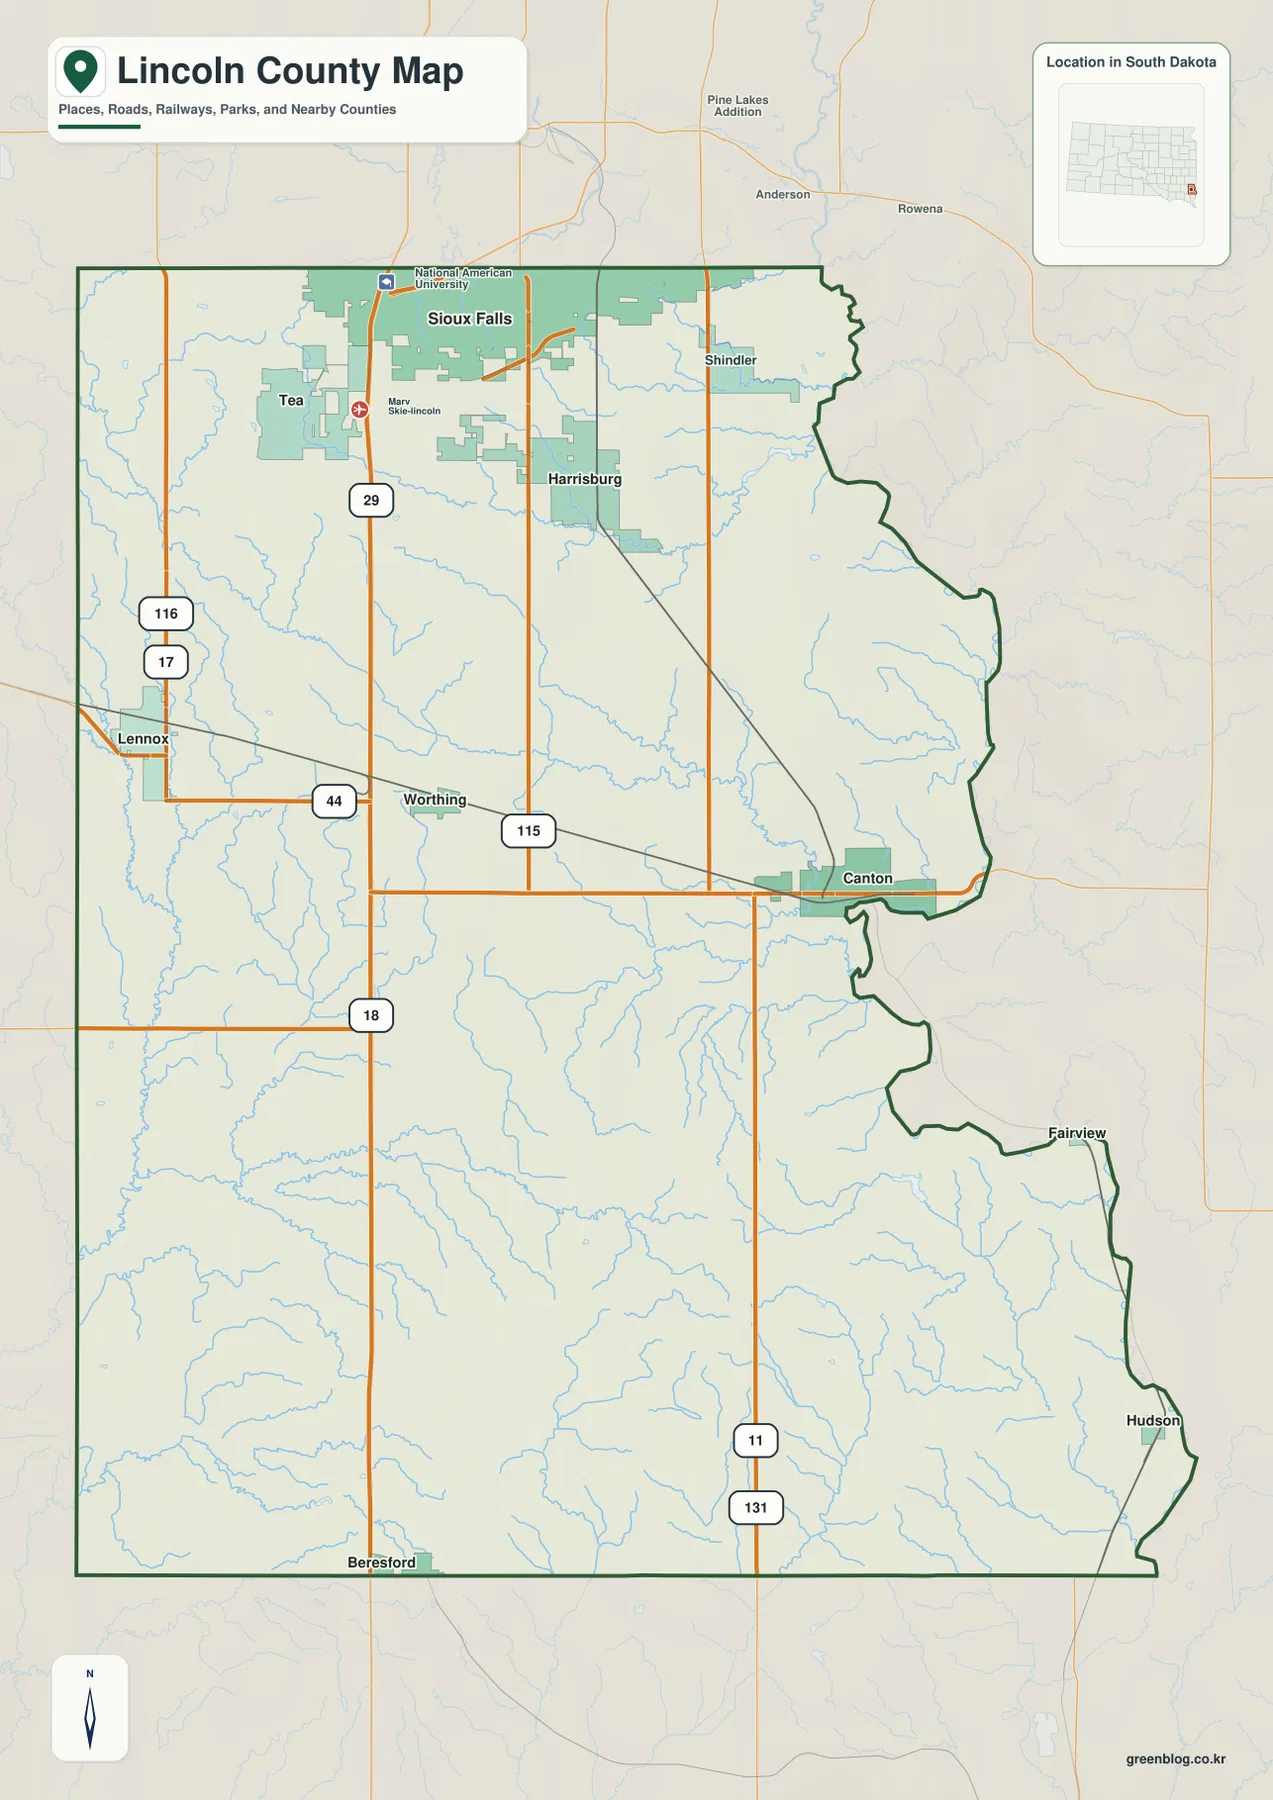
The outline itself is also worth noticing. Much of the west and south sides is comparatively straight, but the east side bends repeatedly. That irregular edge lines up with the Big Sioux River area shown more clearly on the water map. Canton sits close to one of those bends, and the boundary continues south past Fairview toward Hudson. Remembering that shape makes it easier to move between the general map, the water map, and the elevation map without losing your place.
Six ranked cities show how settlement shifts from north to southeast
The city distribution map identifies six places: Harrisburg, Tea, Canton, Lennox, Worthing, and Hudson. Harrisburg is ranked first and Tea second, and both are clustered in the northern portion of the county. Lennox lies on the west side, Worthing is closer to the center, and Canton stands near the eastern boundary. Hudson is separated from the others in the far southeast. That spread is helpful because it shows that Lincoln County is not organized around one central town; the named places are distributed across several different parts of the county.
The CITY INDEX printed at the bottom of the supplied map lists Harrisburg at 8,519, Tea at 6,786, Canton at 3,033, Lennox at 2,468, Worthing at 1,036, and Hudson at 382. Those values are reproduced only because they are part of the map itself. This article does not treat them as a separate current population analysis, and the package does not provide a date or statistical methodology for interpreting the ranking beyond the map label. If you need current demographic figures, consult the relevant Census dataset rather than assuming the index is a live population table.
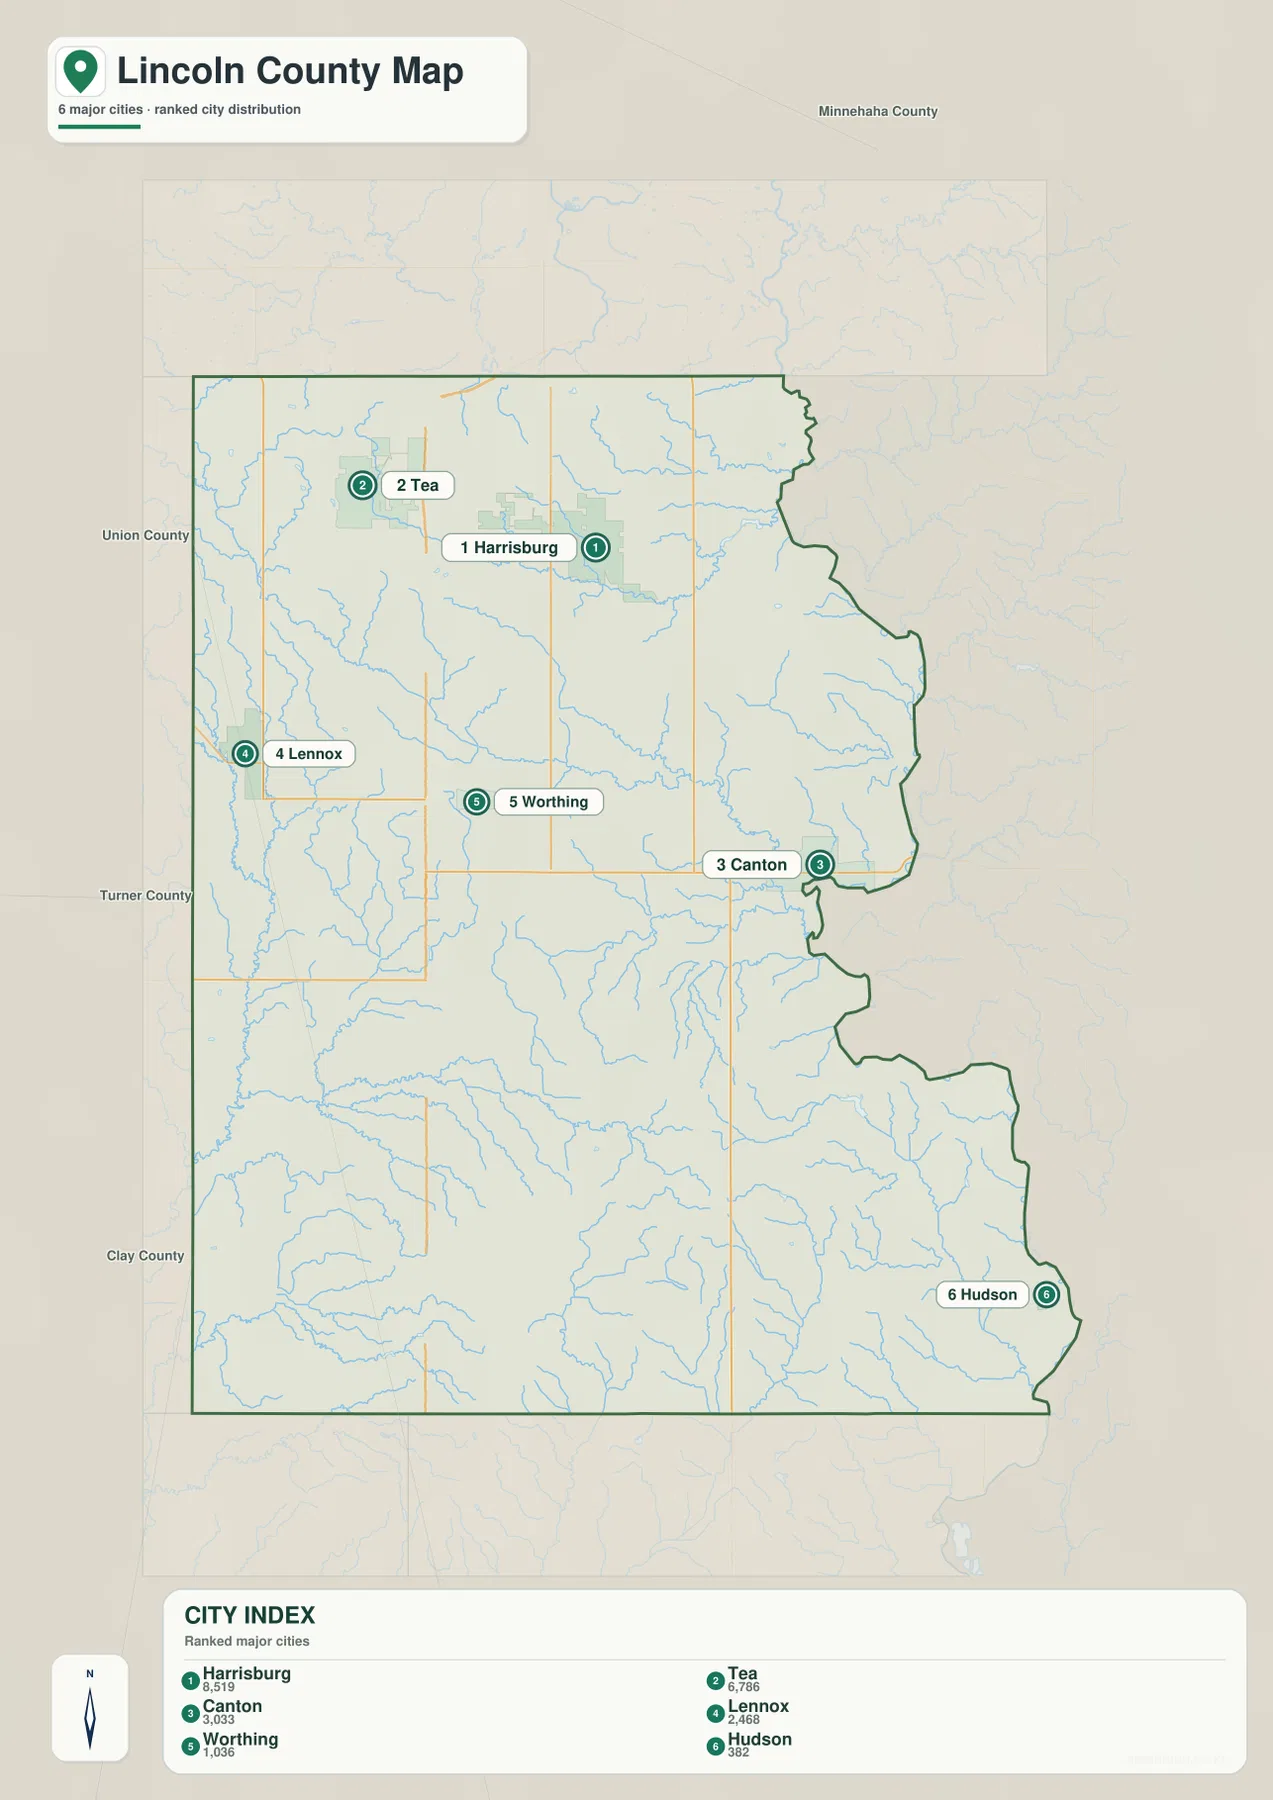
This particular city map does not draw connector lines or print mile values between the six places. The numbers 1 through 6 are index ranks, not distances. It would therefore be misleading to infer a straight-line mileage from Harrisburg to Canton, Tea to Lennox, or any other pair from this image alone. Use the map to compare relative positions, and use a current routing service if you need driving distance or travel time.
The Big Sioux River anchors the eastern water network
The terrain-and-water map makes the Big Sioux River the clearest eastern feature. It runs along much of the county’s irregular east side, with bends that closely resemble the boundary shape seen on the general map. In the north, Ninemile Creek crosses toward Lake Alvin. Across the middle, Beaver Creek runs eastward, and the South Fork Beaver Creek and Little Beaver Creek are labeled farther south. These streams create a set of lower corridors that help explain why the elevation colors along the eastern half are not uniform.
The western and southern parts of the county contain their own named waterways. Long Creek follows the west side for a long distance, Snake Creek appears in the west-central interior, and Saddle Creek crosses the southern half. Prairie Creek is shown in the southeast below Lake Lakota. Lake Albert is labeled in the west-central part of the county, while Carlson Lake and Blind Creek appear near the southwest. The result is a water map with one dominant river on the east but many smaller creeks and lakes spread through the interior.
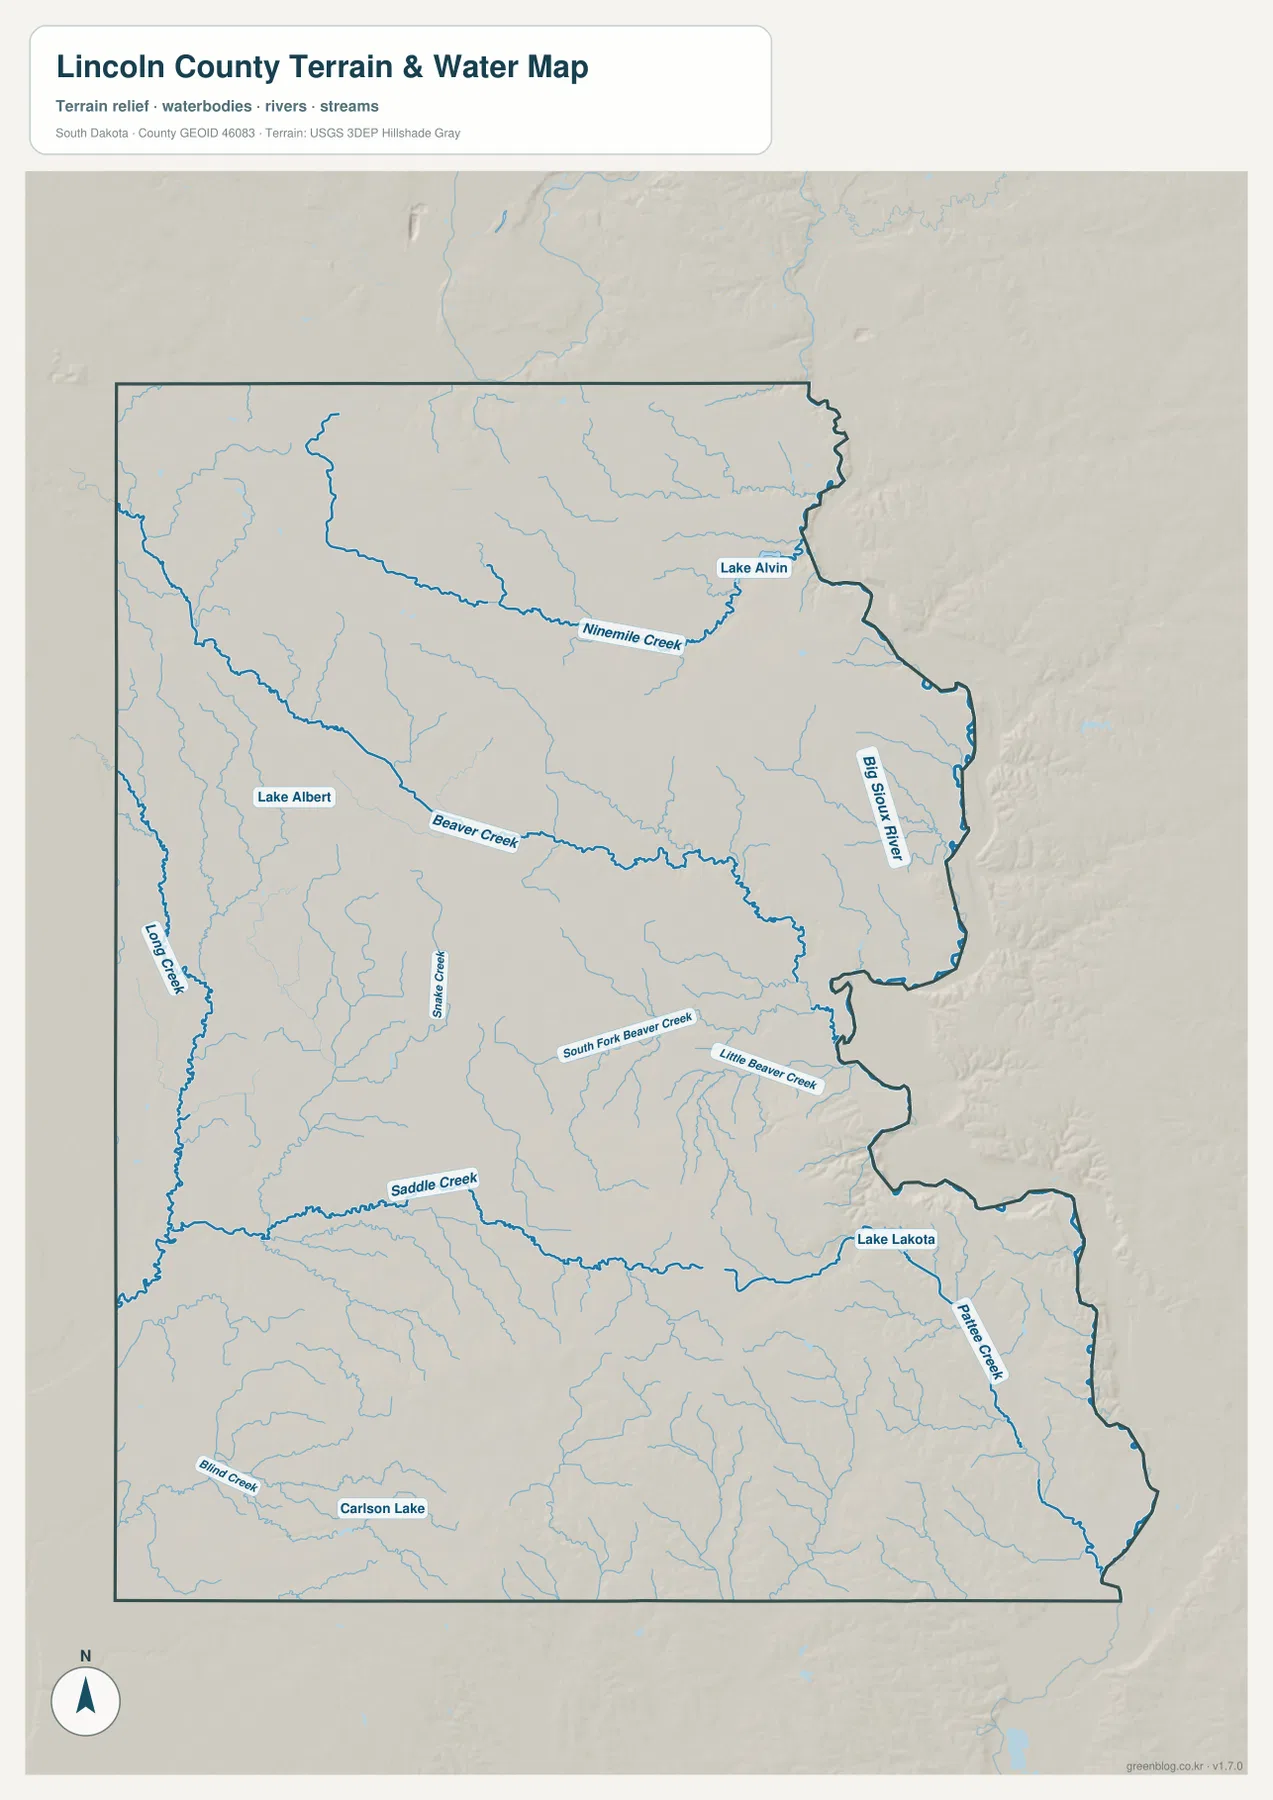
The blue lines on this map are references for named streams and water features. They do not indicate flood zones, water depth, water quality, navigability, or real-time flow. They also should not be used to establish property rights or a legal riverbank boundary. For authoritative hydrography, the USGS National Hydrography source listed below is the better place to check current source data.
Elevation ranges from about 358 to 477 meters across the county
The elevation map gives an actual range of roughly 358 to 477 meters, with a mean near 420 meters. The northwest corner is one of the broadest high areas, shown in brown and tan. Another prominent high zone occupies much of the south-central interior, where the shaded relief is more broken and ridged. In contrast, the Big Sioux River side is largely green, indicating lower ground, and several stream corridors carve lower paths through the higher interior. The difference between the listed minimum and maximum is about 119 meters.
The map also shows why a single statement such as “the county gets higher toward the west” would be too simple. Some west-central ground is low, while the south-central area rises strongly. The northeast contains low green terrain near the river side, but the northwest rises sharply. Those changes make the relief map more useful as a companion to the water map: where creeks and the Big Sioux River pass through the county, lower terrain often appears nearby, while higher ridges stand between the drainage corridors.
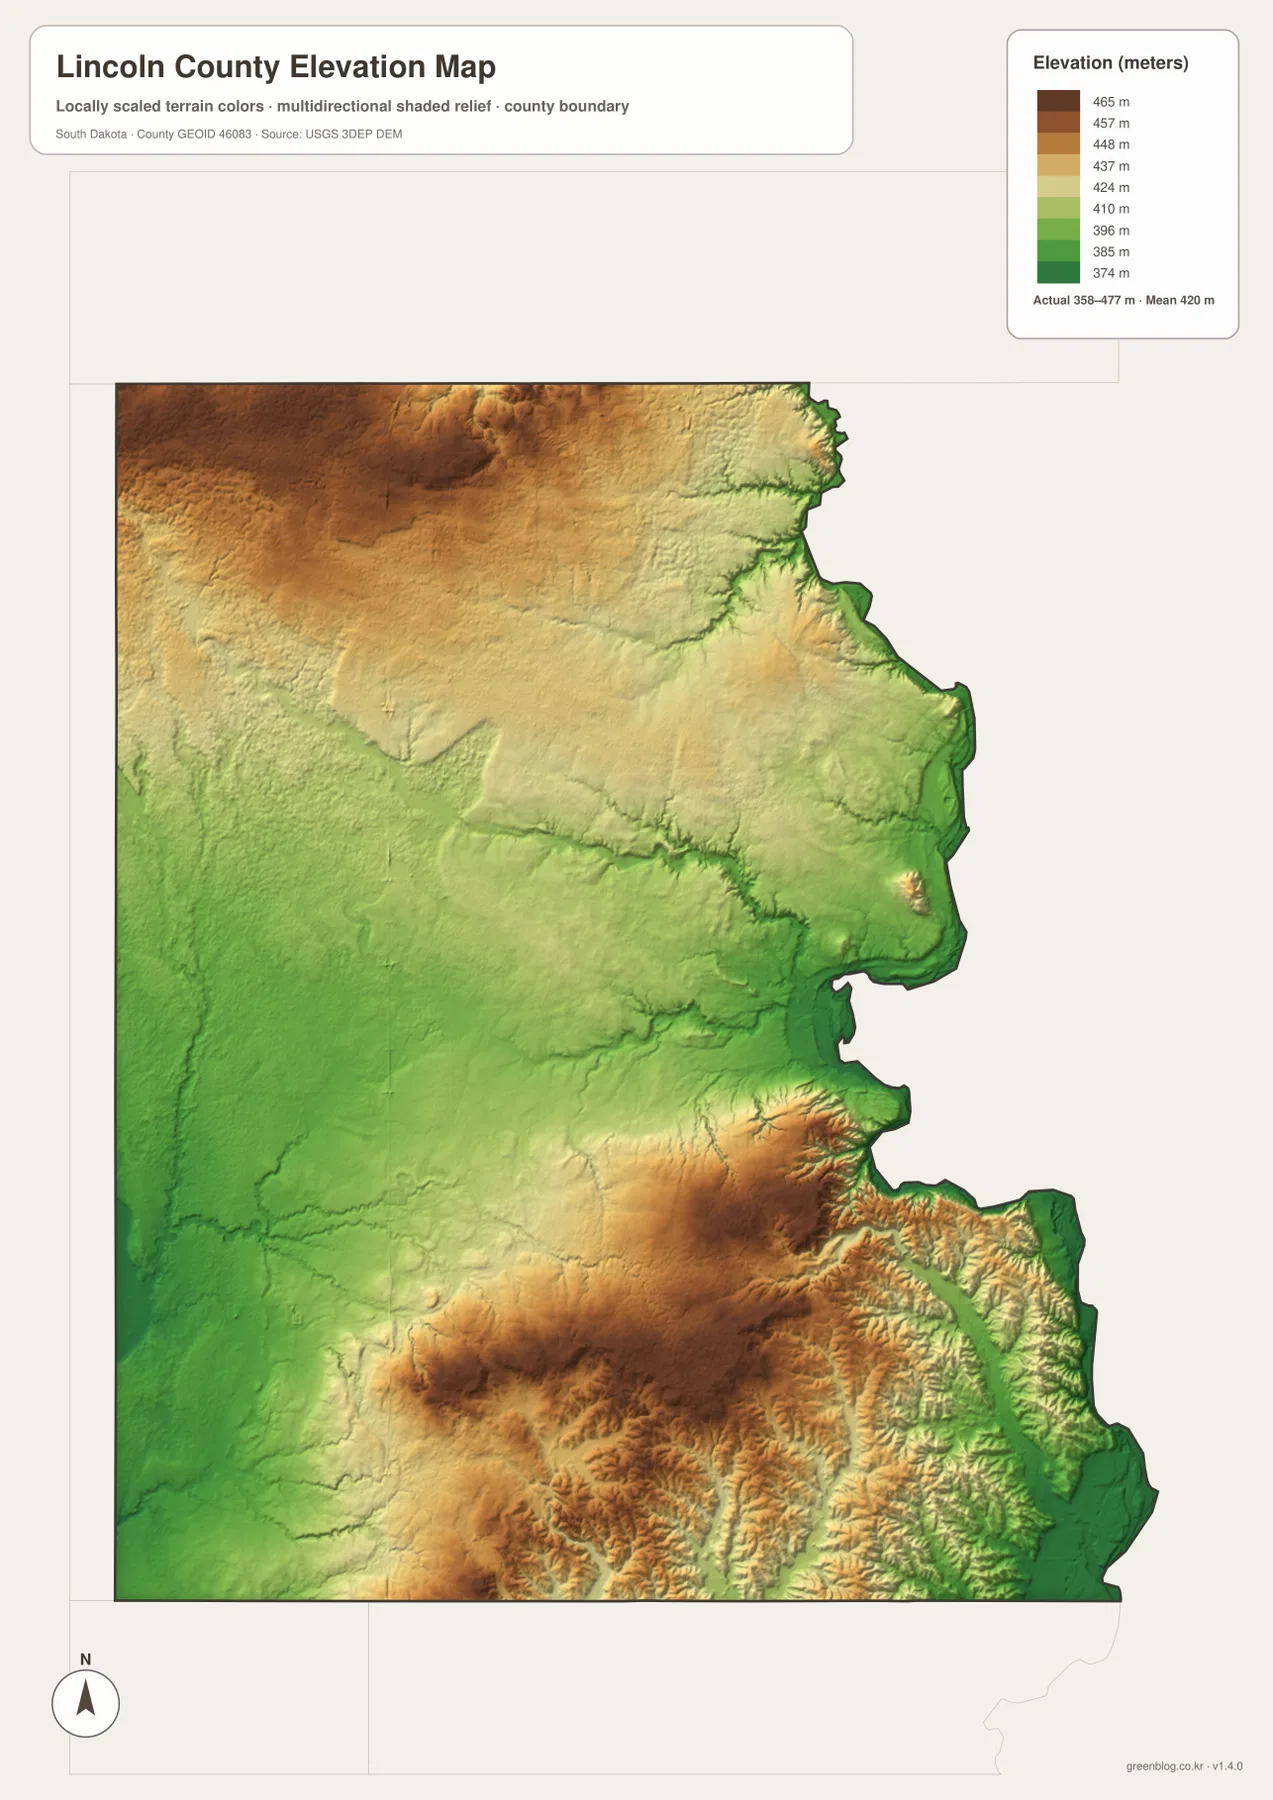
This is a county-scale elevation reference, not a survey product. The colors and shaded relief are designed to make broad differences visible, so they should not be used to determine the precise elevation of a building site, road point, field corner, or engineering location. For exact source elevations and DEM products, use the USGS 3D Elevation Program rather than reading a precise value from the color ramp on this image.
Match the four maps by using different local reference points
Harrisburg works well as a northern reference point. Find it on the general map beside Tea, then compare the city map to see how the two northern places sit relative to Lennox, Worthing, Canton, and Hudson. From there, switch to the elevation map and note the contrast between the higher northwest and the lower northeast river side. The maps use the same county outline, so the change in topic does not require learning a new orientation each time.
Canton is a better anchor for the eastern half. Its position near the irregular boundary makes it easy to locate the Big Sioux River on the water map and the green lowland on the elevation map. Worthing and Lennox are useful for the central-west side, where road 44 crosses the county and several smaller creeks appear. In the south, Hudson and the 18, 11, and 131 road labels help orient you before moving to Saddle Creek, Lake Lakota, Prairie Creek, and the higher south-central relief.
The WebP images in the article are intended for quick on-screen viewing. The download archive contains the corresponding original JPG files for the general county map, city distribution map, terrain-and-water map, and elevation map. Each JPG is 2572 × 3638 pixels, so the files are better suited to larger viewing, A3 printing, presentations, or personal geographic reference. The safest way to use them is to stay within what the maps actually show and consult the official source datasets when you need current legal, engineering, hydrologic, or demographic detail.
Frequently Asked Questions
Does the city map show the distance between Harrisburg and Canton?
No. The city distribution map shows the locations and index ranks of Harrisburg, Tea, Canton, Lennox, Worthing, and Hudson, but it does not include connector lines or mileage labels. The numbers 1 through 6 are city-index positions rather than distance values. Use a current route source for driving mileage or travel time.
Which map is best for finding the Big Sioux River and Beaver Creek?
The terrain-and-water map is the most direct choice. It labels the Big Sioux River along the east, Beaver Creek across the middle, the South Fork and Little Beaver Creek branches farther south, and other features such as Ninemile Creek, Saddle Creek, Lake Alvin, Lake Lakota, and Carlson Lake.
Can the elevation map be used for survey-grade height measurements?
No. The map reports an overall range of about 358–477 meters and a mean near 420 meters, but it is a generalized county-scale relief reference. For a precise elevation at a specific site, use official elevation source data such as the USGS 3D Elevation Program.
Map File Information
The ZIP contains the original high-resolution JPG files for the Lincoln County general map, city distribution map, terrain and water map, and elevation map.
- Included Files: 4 JPG maps
- Printable Size: 2572 × 3638 px each
Related Maps
Sources and references
- U.S. Census Bureau TIGER/Line Shapefiles – official geographic source for county boundary and mapping data.
- USGS National Hydrography – official source for rivers, streams, lakes, and hydrographic data.
- USGS 3D Elevation Program – official elevation and DEM source.
- 2020 Census PL County Name API – Census API used in the package to identify Lincoln County, South Dakota.
Green Map creates custom-edited map images using open geographic data sources such as geoBoundaries, Natural Earth, OpenStreetMap, and government open data.
These maps are edited visual materials, not raw data files, and are provided for education, documents, presentations, and graphic reference.