Download the high-resolution Day County Map JPG files from the ZIP on this page. Webster and US 12 provide the simplest starting point, and the landscape changes noticeably as the route continues toward Waubay. Large lakes become more common in the eastern half of the county, while the western side is defined more by creeks and lower terrain. The map set also shows Bristol, Pierpont, Roslyn, Grenville, the major lake cluster around Waubay, and an elevation range of 395 to 621 meters.
A useful way to read Day County is to follow the central road corridor and then compare what lies on either side. Webster anchors the middle of the county, Waubay leads into the dense lake country, and the elevation surface shows the land rising from the lower west toward the higher east. This place-based approach makes the county easier to understand than treating roads, settlements, water, and relief as four unrelated map layers.
Table of Contents
Webster and US 12 form the clearest central corridor
The general county map places Webster near the east-central part of Day County with US 12 running directly through the same corridor. Andover lies to the west, where US 18 and several local route markers provide additional references. Once Webster is located, the west-to-east road pattern becomes easy to follow toward Waubay.
Pierpont and Grenville sit away from the US 12 corridor and help show how far the county extends north of Webster. Waubay is the strongest eastern settlement reference because it sits beside the area where lakes become increasingly prominent. The map is designed for geographic orientation rather than live navigation, so current closures, road work, traffic, and driving time should be checked with an up-to-date transportation source.
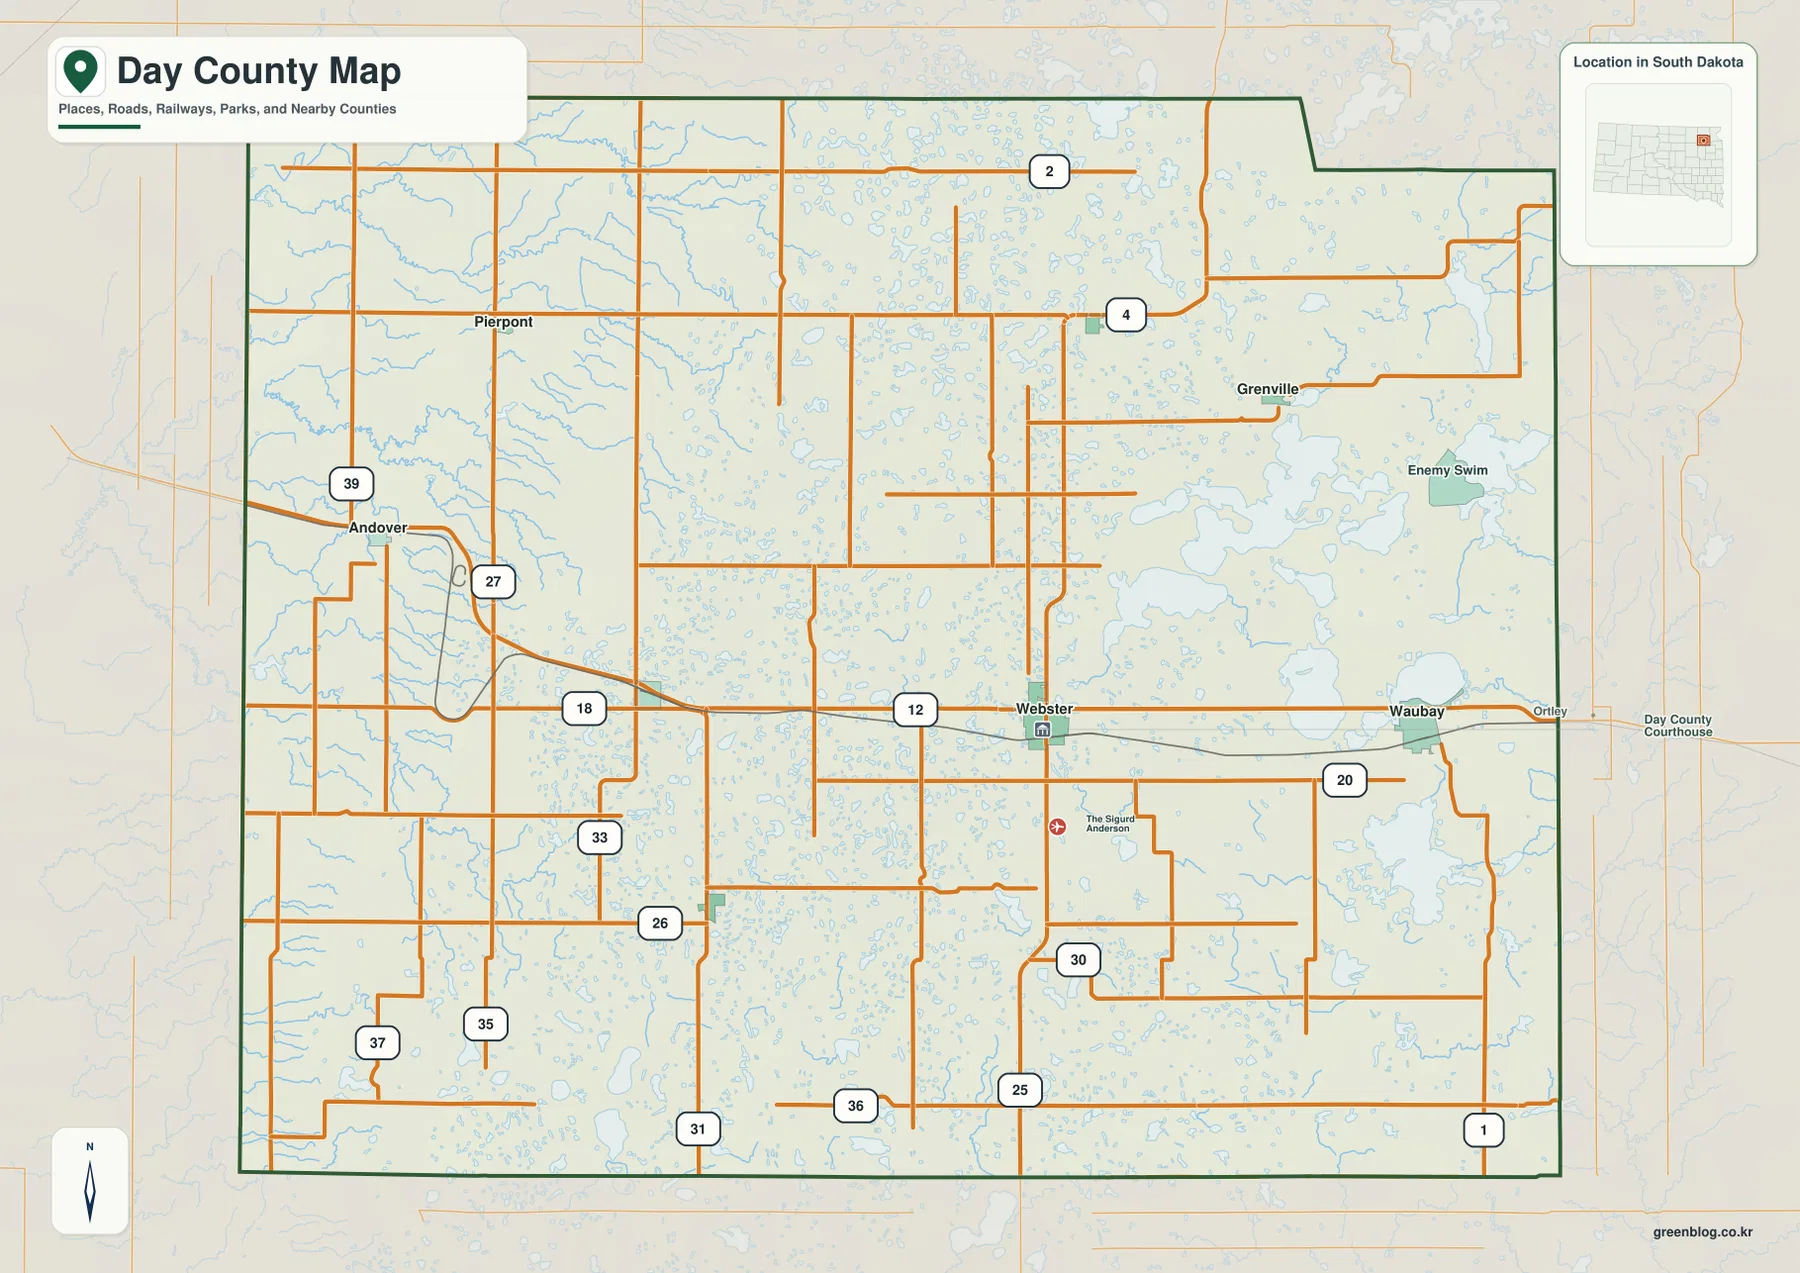
Day County’s official website identifies Webster as the county seat. That role fits the supplied map because Webster sits on the main east-west corridor and is surrounded by a denser road network than much of the county. Keeping Webster as the anchor makes it easier to move into the city, water, and elevation views without losing orientation.
The ranked communities show how widely settlement is distributed
The city-index image includes Webster, Waubay, Bristol, Pierpont, Roslyn, and Grenville. Rather than using the ranking as the main story, it is more useful to compare their positions. Webster sits near the middle-east, Waubay lies farther toward the lake country, Bristol represents the west-central side, and Pierpont, Roslyn, and Grenville help define the northern half of the county.
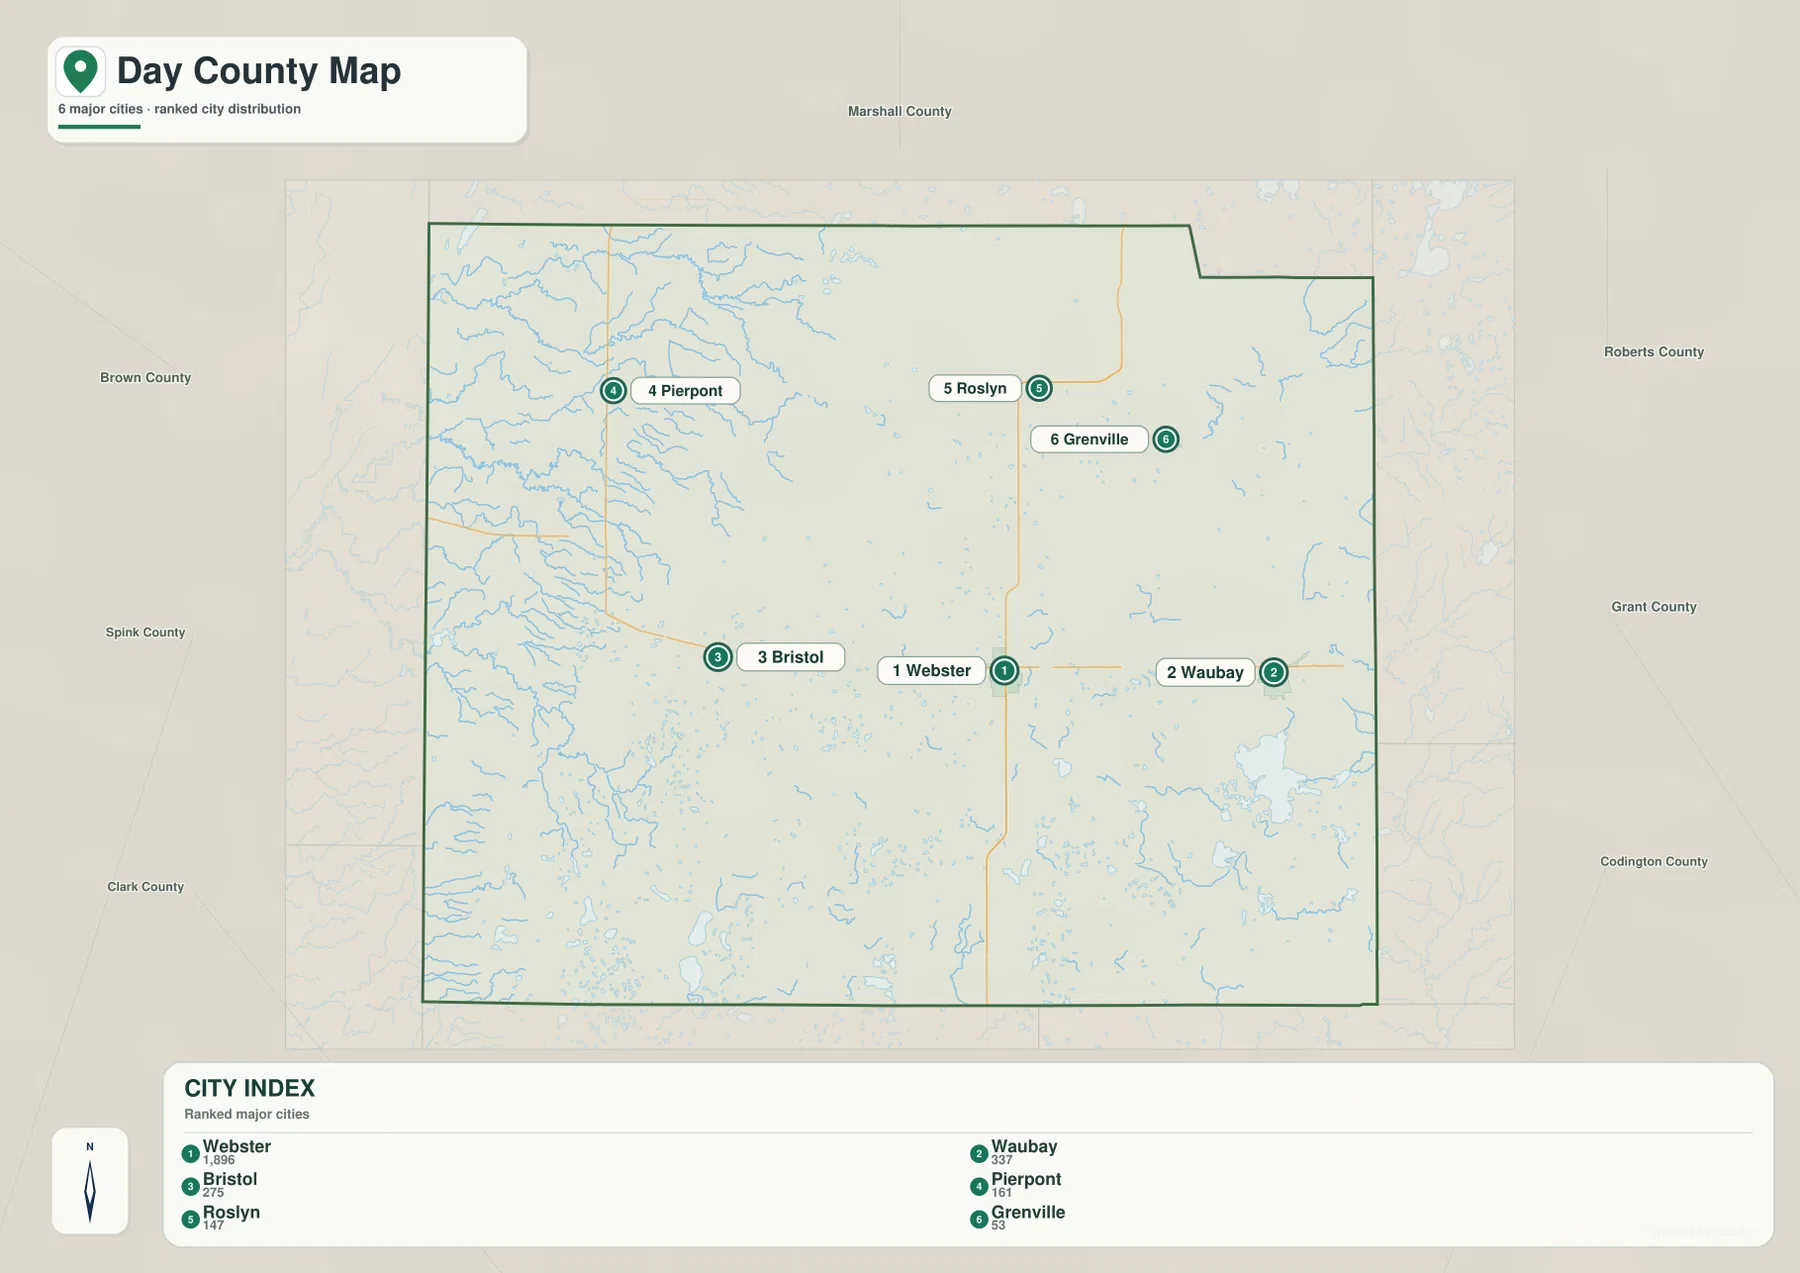
The printed CITY INDEX lists Webster 1,896, Waubay 337, Bristol 275, Pierpont 161, Roslyn 147, and Grenville 53. This article treats those figures only as values printed on the supplied image, not as current population estimates. Present-day population should be checked separately with the U.S. Census Bureau.
The city map is not a hub-and-distance diagram, so the rank markers should not be interpreted as mileage from Webster. For actual routes, use the general county map for context and a current navigation service for driving distance and time.
Waubay opens into the county’s dense eastern lake cluster
The terrain-and-water view changes quickly around Waubay. Waubay Lake is one of the largest named water bodies, with South Waubay Lake immediately to the south. Enemy Swim Lake and Pickerel Lake occupy the northeastern part of the county, while Rush Lake, Blue Dog Lake, and Bitter Lake add more large water features farther south and southeast.
Smaller lakes fill the spaces between the major names. Spring Lake and Minnewasta Lake help define the area east and southeast of Waubay, and Opitz Lake provides another reference farther north. The result is a dense lake landscape rather than one dominant water body.
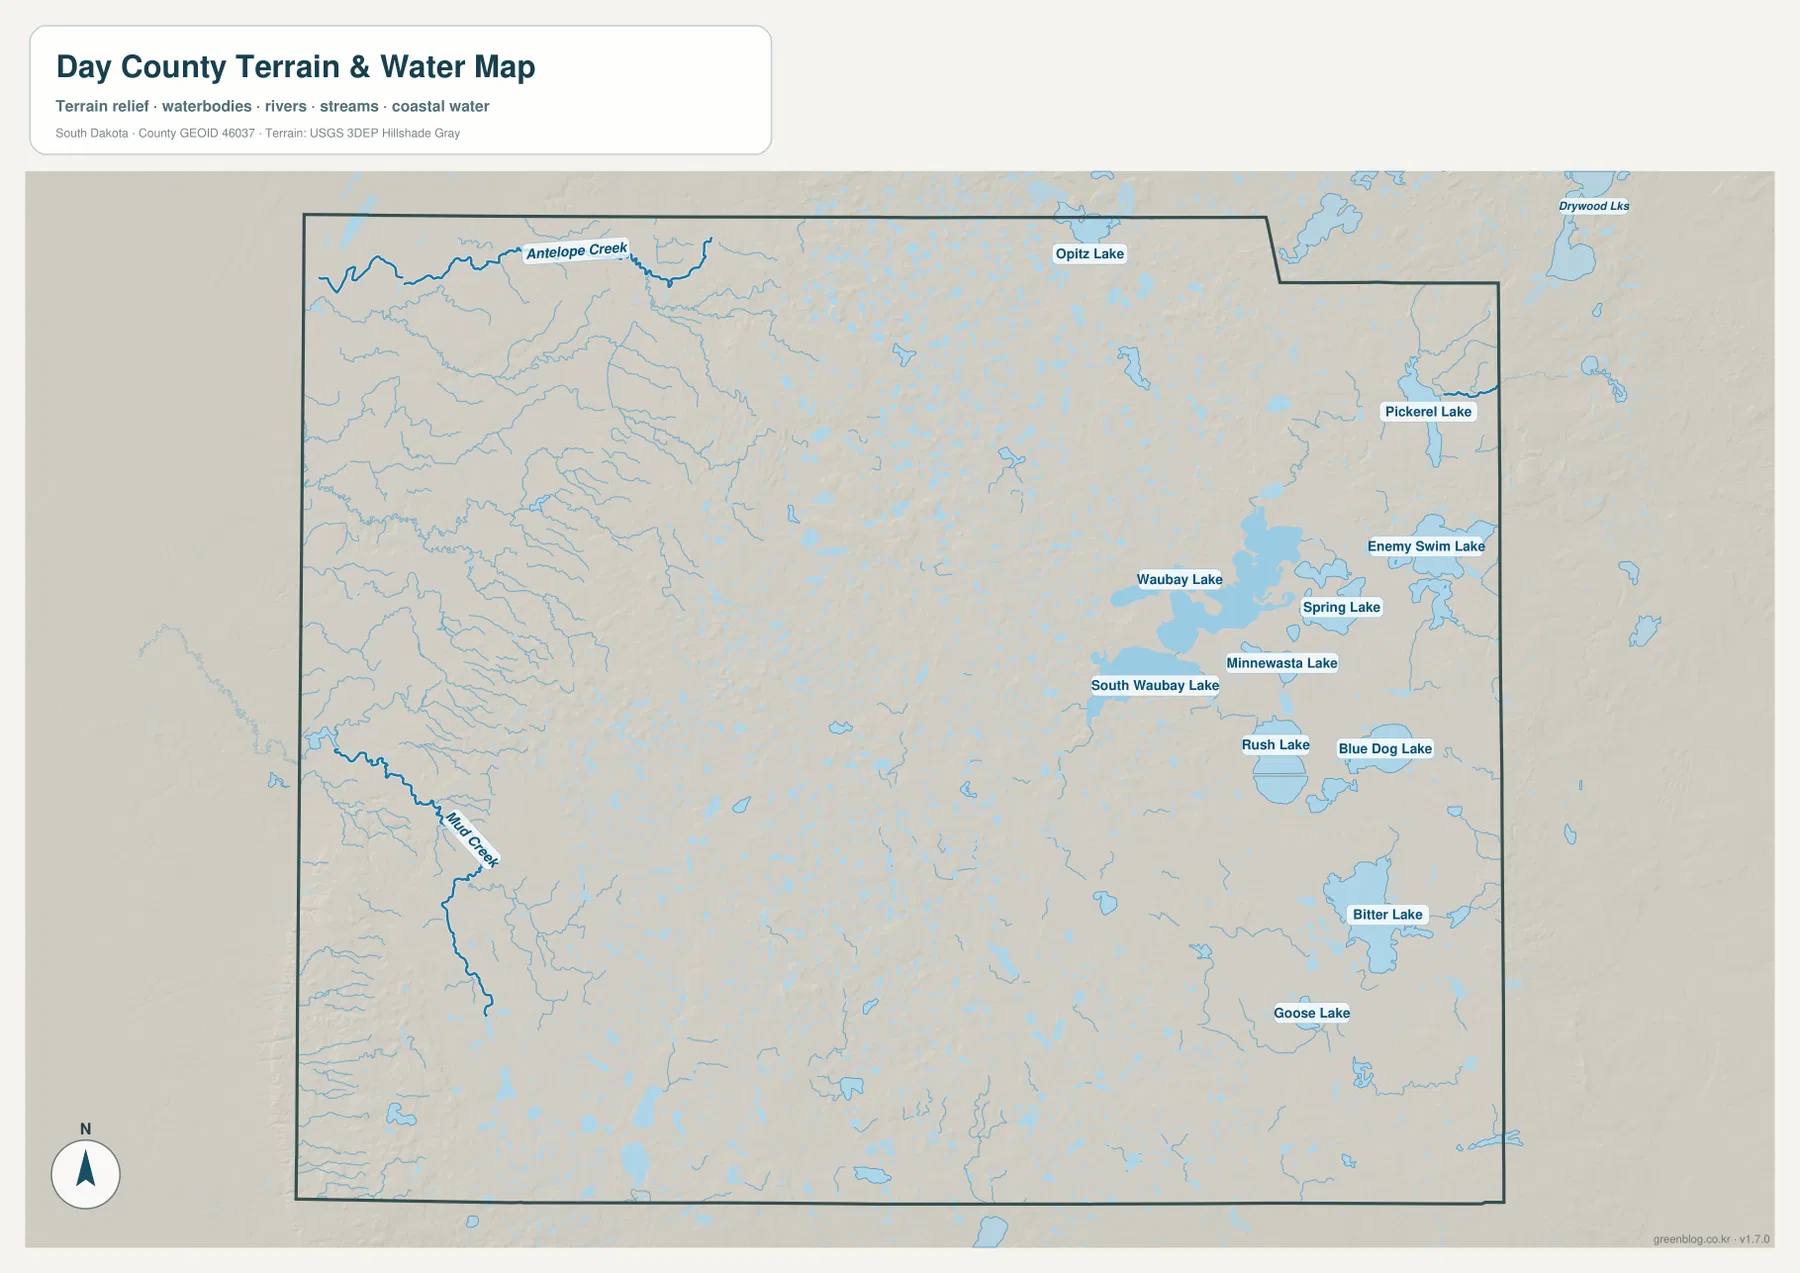
The western side looks different. Antelope Creek and Mud Creek are among the more obvious named channels, and many smaller tributaries cross the lower western terrain. Large named lakes are less frequent there, making the contrast with the Waubay area one of the easiest features to remember.
This water view is a location reference, not a live hydrologic product. It does not report current lake level, flood risk, water quality, fishing conditions, or boating safety. Current field conditions should be checked with USGS or local authorities.
Elevation rises from the western edge toward the eastern lake country
The elevation map reports an actual Day County range of 395 to 621 meters and a mean of 533 meters. Dark green dominates much of the western edge, indicating the lowest broad terrain on the map. Moving toward Webster and then farther east, the surface changes through lighter green and yellow before broad areas of brown appear across the central-eastern and northeastern county.
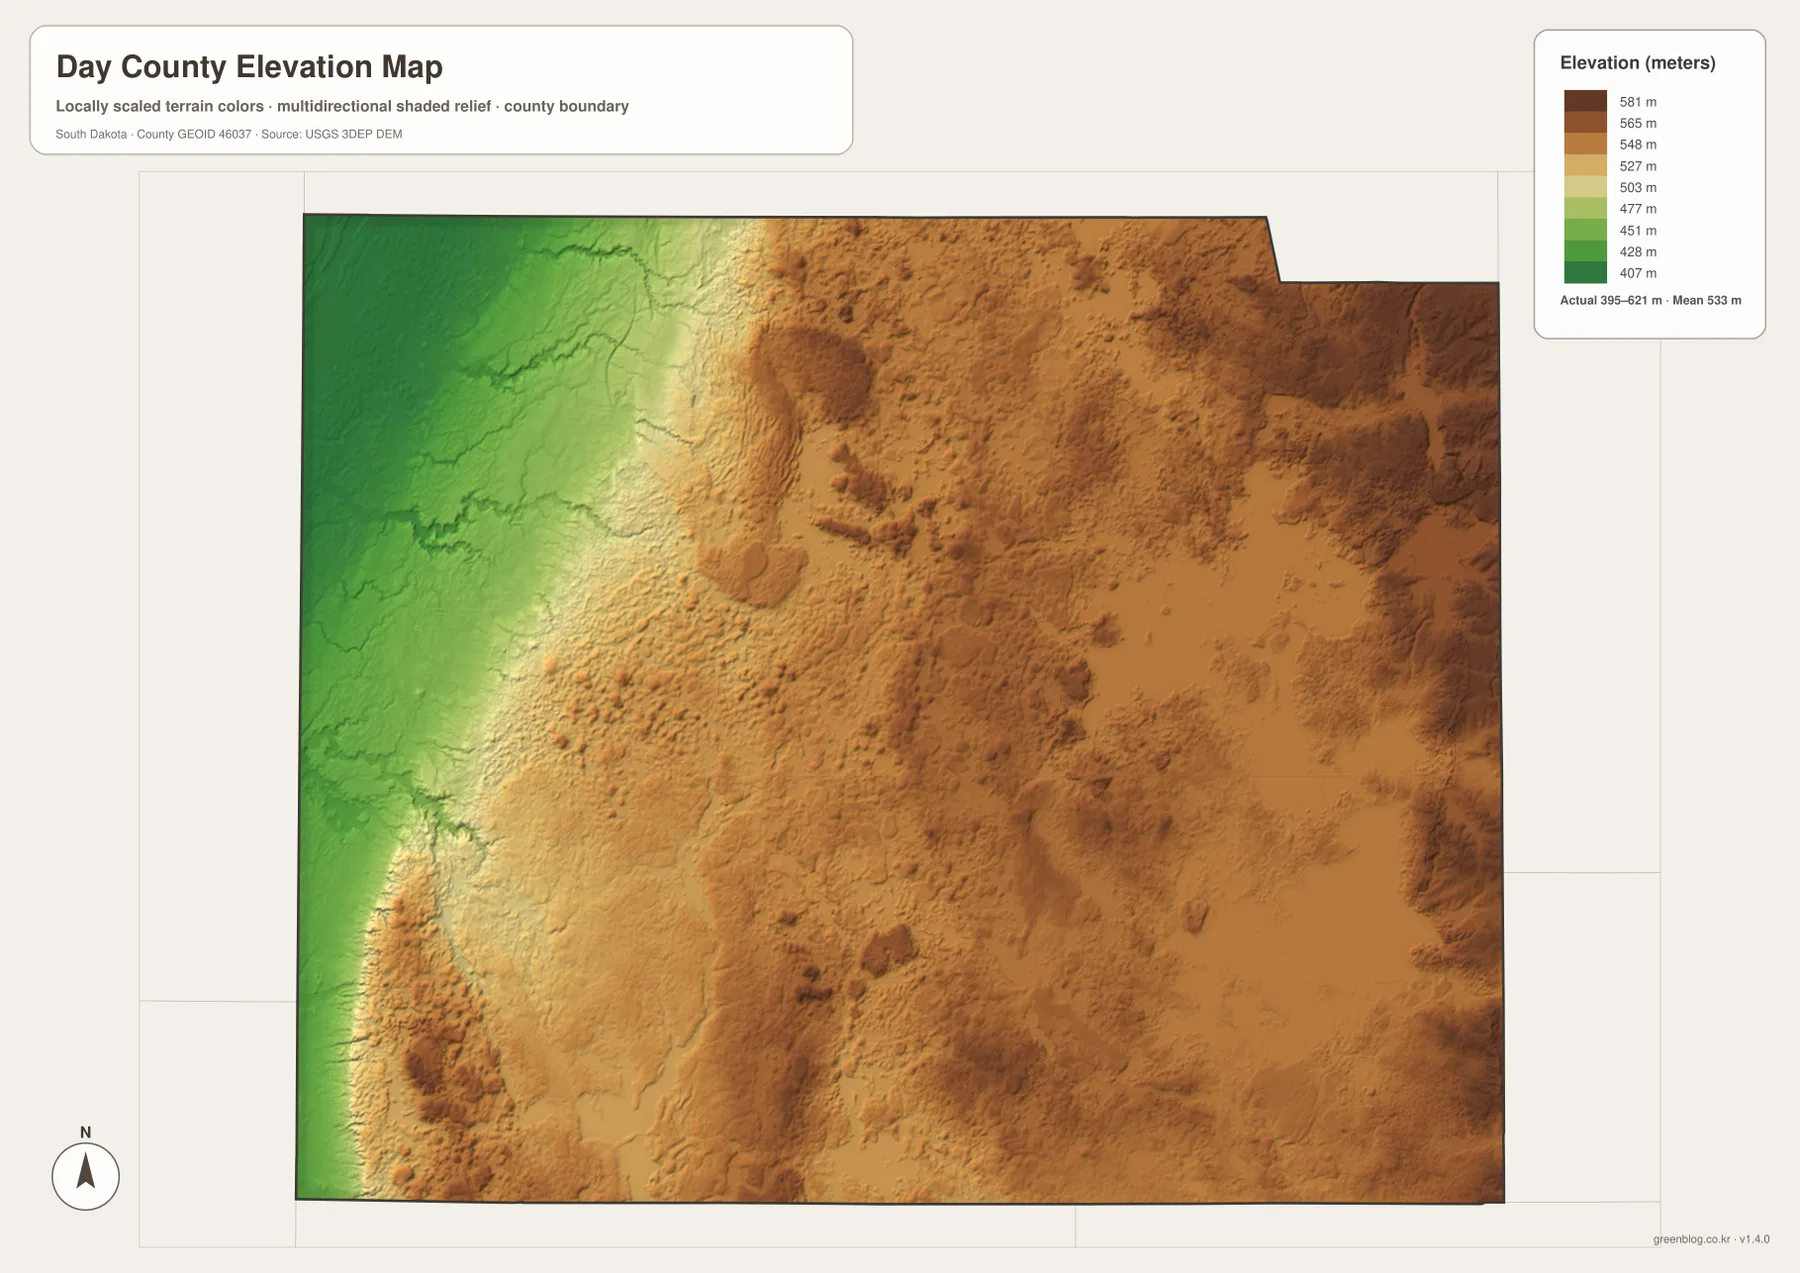
The presence of many eastern lakes does not mean the entire area is low. Waubay Lake, Enemy Swim Lake, and the surrounding water bodies sit within a landscape that is generally higher than the far western edge. Smaller depressions and ridges are mixed throughout the eastern county, so the relief is more varied than a simple west-to-east slope.
The 395–621 meter range is appropriate for county-scale comparison, not parcel, building, or engineering measurement. A location-specific elevation should be checked with detailed USGS 3DEP data or professional survey information.
Following Webster to Waubay connects the road, water, and relief views
Webster is the easiest cross-map anchor. The road map ties it to US 12, the city index places it among the main settlements, and the water map shows a rapid increase in lakes as the view moves toward Waubay. The elevation surface adds the final piece by showing the same eastward direction rising into higher terrain.
The western communities provide a useful comparison. Bristol and Andover connect with the lower western side and creek network, while Pierpont and Roslyn make the northern and northwestern parts of the county easier to place. Using one community at a time is a clearer way to understand Day County than memorizing a long list of separate map features.
The ZIP below contains the general county, city, terrain-and-water, and elevation maps as original high-resolution JPG files. Each image is 3638 × 2572 pixels and is suitable for printing, classroom handouts, presentations, or close viewing. Legal boundaries, live road conditions, current water information, flood decisions, and survey-grade elevation require current authoritative data in addition to these reference maps.
Frequently Asked Questions
Can Waubay Lake and Enemy Swim Lake be seen on the same water map?
Yes. Waubay Lake and South Waubay Lake are shown in the eastern-central area, while Enemy Swim Lake and Pickerel Lake are farther northeast. Rush Lake, Blue Dog Lake, Bitter Lake, and several other water bodies are also labeled.
Is Webster 1,896 in the CITY INDEX a current population estimate?
This article treats Webster 1,896 and the other numbers only as values printed in the supplied CITY INDEX. They should not be assumed to be the latest population estimates. Use current U.S. Census Bureau data when present-day population is important.
Can the 395–621 meter range be used as the exact elevation of a property?
No. The range is useful for broad county-scale comparison. A property-specific or engineering elevation should be checked with detailed USGS 3DEP data or professional survey information.
Map File Information
The Day County general, city, terrain-and-water, and elevation views are packaged as high-resolution JPG files.
- Included Files: Use only the versions confirmed in the article and supplied images
- File Type: Use the confirmed download contents
- Intended Use: Printing, education, presentations, and map-based projects
Related Maps
Sources and References
The article is based first on the names, roads, water features, and elevation values visible in the supplied Day County maps. These official sources provide additional county, boundary, hydrography, and elevation reference information.
- Day County official website
- Day County GIS
- U.S. Census Bureau TIGER/Line Shapefiles
- USGS National Hydrography
- USGS 3D Elevation Program
Green Map creates custom-edited map images using open geographic data sources such as geoBoundaries, Natural Earth, OpenStreetMap, and government open data.
These maps are edited visual materials, not raw data files, and are provided for education, documents, presentations, and graphic reference.