A same-year map of agriculture, forestry and fishing value added shows a strongly uneven monetary landscape in 2024. China and India occupy the only class above $200 billion, while Indonesia and Brazil lead the next band. The World Bank country/economy master set contains 217 rows for this comparison; 186 have a numeric 2024 observation and 31 remain missing. The map measures the current-US-dollar value added produced by the sector, not the sector’s share of GDP and not agricultural land area.
The underlying World Development Indicators series is Agriculture, forestry, and fishing, value added (current US$), code NV.AGR.TOTL.CD. World Bank metadata places agriculture, forestry and fishing in ISIC Rev. 4 divisions 01–03. Value added is the contribution created by production after subtracting intermediate goods and services from output. Because the series is in current prices, it is not adjusted to remove inflation over time.
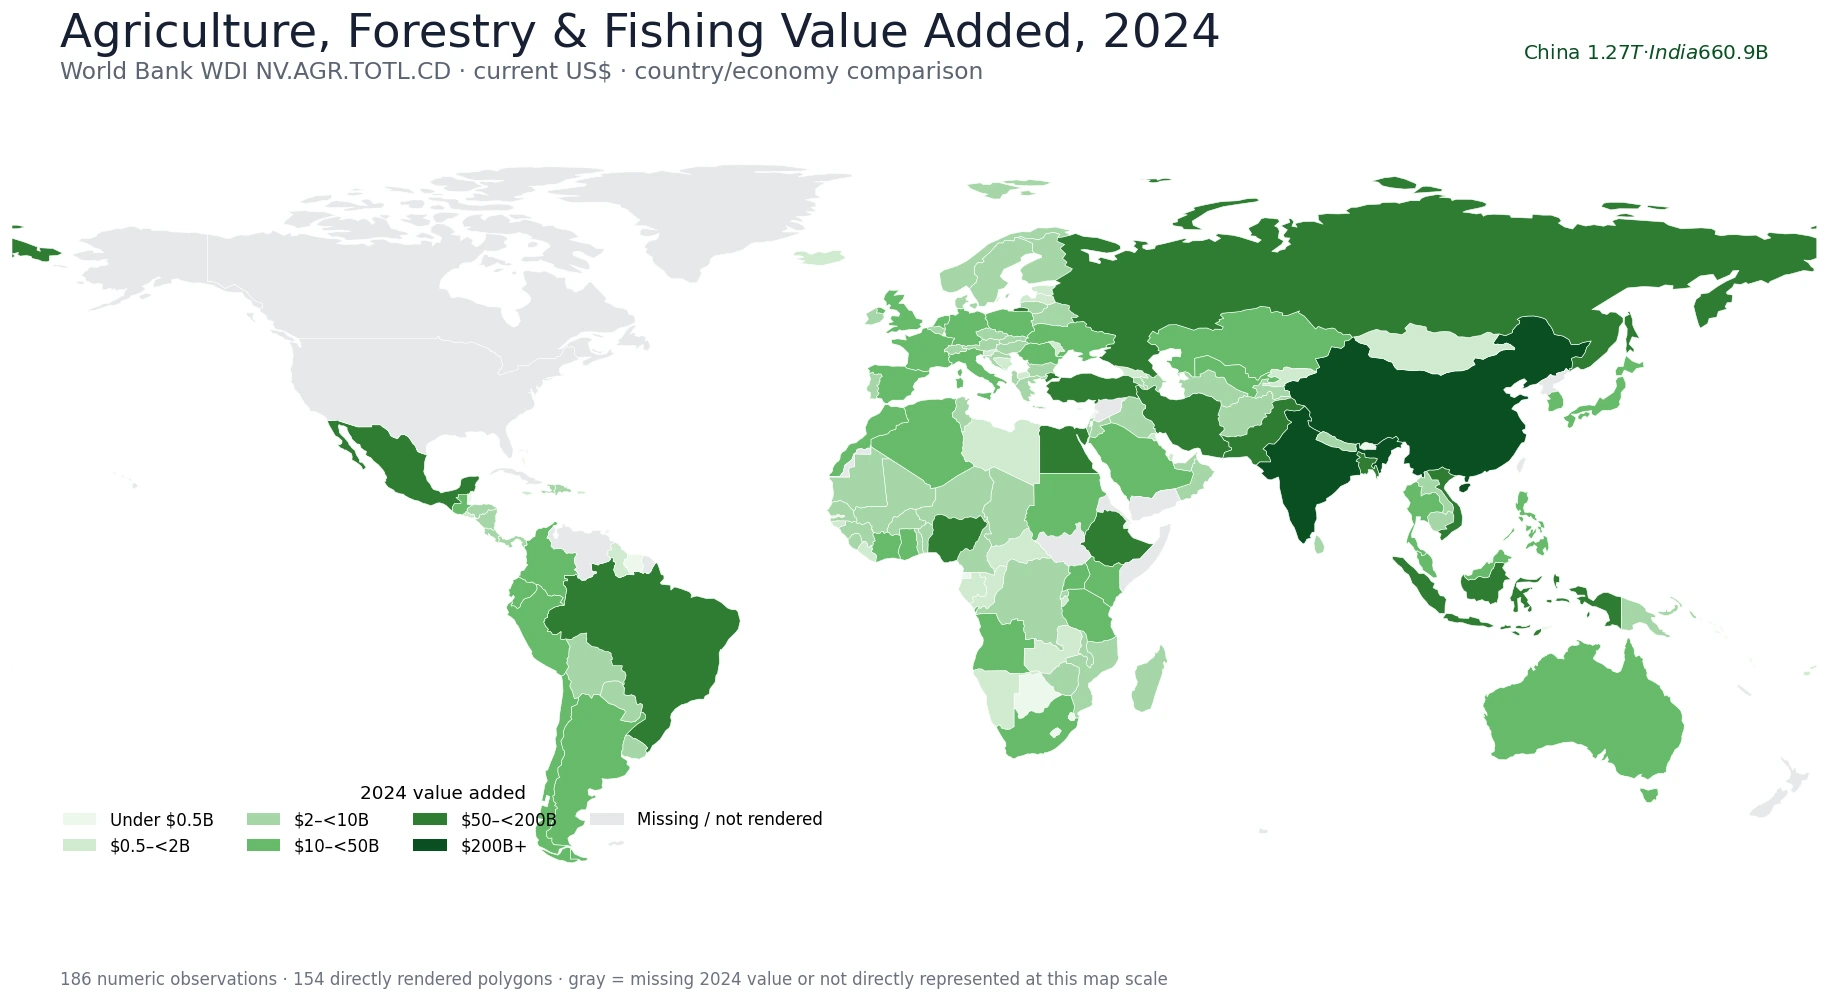
Table of Contents
Only two economies sit above $200 billion
China records about $1.27T and India about $660.9B. Indonesia follows at $176.1B and Brazil at $125.7B. This separation at the top explains why the simple average across the 186 reported economies is $22.2B, while the median is only $3.5B. The mean is pulled upward by a small number of very large economies, so the median is a better description of the middle observation in the country-level distribution.
| Rank | Country or economy | 2024 value added |
|---|---|---|
| 1 | China | $1.27T |
| 2 | India | $660.9B |
| 3 | Indonesia | $176.1B |
| 4 | Brazil | $125.7B |
| 5 | Pakistan | $88.2B |
| 6 | Turkiye | $79.1B |
| 7 | Mexico | $70.8B |
| 8 | Nigeria | $65.3B |
| 9 | Russian Federation | $63.5B |
| 10 | Viet Nam | $57.3B |
South, East and Southeast Asia contain the broadest high-value cluster
The darkest and second-darkest classes are most continuous across Asia. Beyond China and India, Indonesia is $176.1B, Pakistan $88.2B, Viet Nam $57.3B, and Bangladesh $50.3B. Thailand at $47.1B and the Philippines at $42.0B sit just below the $50 billion threshold. The cluster is real as a pattern of absolute value added, but it is not uniform: India is about 7.5 times Pakistan, 13.2 times Bangladesh and roughly 70 times Nepal in the same-year table.
Those contrasts are a reminder that an absolute-dollar map is influenced by the scale of an economy and its sector, not simply by climate or the amount of land used for farming. A country can have a large agricultural land share and a modest current-dollar value added, or a smaller land share and a much larger value added. Separate indicators are needed to answer those questions.
Brazil stands out from its South American neighbors
Brazil records $125.7B in 2024. Neighboring Colombia is $39.9B, Argentina $37.1B, and Peru $21.8B. Brazil is therefore about 3.1 times Colombia, 3.4 times Argentina and 5.8 times Peru on this measure. The map makes these border-to-border changes visible, while the table keeps the differences from being exaggerated by class breaks.
| Selected country | 2024 value added |
|---|---|
| India | $660.9B |
| Pakistan | $88.2B |
| Bangladesh | $50.3B |
| Nepal | $9.4B |
| Brazil | $125.7B |
| Colombia | $39.9B |
| Argentina | $37.1B |
| Peru | $21.8B |
Europe and Africa show several separate high points rather than one continuous block
Across Europe and nearby economies, Türkiye records $79.1B, the Russian Federation $63.5B, Italy $47.9B, Spain $47.5B, Germany $42.8B, and France $41.1B. In Africa, Nigeria reaches $65.3B, Egypt $53.3B, and Ethiopia $52.1B. Kenya is $27.0B and South Africa $11.3B. The continental pattern is therefore dispersed: a few large sector values stand out rather than forming a single uniformly dark region.
Most reported economies are below $10 billion
The class counts show the skew clearly. 45 observations are below $0.5 billion, 31 are from $0.5 billion to under $2 billion, and 61 are from $2 billion to under $10 billion. Another 35 fall between $10 billion and $50 billion, 12 are from $50 billion to under $200 billion, and only 2 exceed $200 billion. The first quartile is about $0.6B and the third quartile $11.0B. These breaks are visualization choices, not official economic thresholds.
Gray areas are not zero-value economies
Thirty-one rows do not have a retained 2024 value in the supplied same-year dataset. The United States and Canada are among those missing rows, so they are intentionally not filled with an older observation. A gray country on this map means “no comparable 2024 value in this table” or, for some small territories, “not directly rendered by the simplified boundary layer.” It does not mean the sector produced zero value added. Keeping the missing observations visible prevents a mixed-year map from looking more precise than the source data support.
Current US dollars answer a scale question, not a share or productivity question
NV.AGR.TOTL.CD is an absolute monetary measure. It does not tell you what percentage of GDP comes from agriculture, forestry and fishing; that requires the percentage-of-GDP series. It also does not measure value added per worker, crop yields, physical production, agricultural land share, or farm income. Those metrics can move differently because they have different denominators and definitions. The value of this map is its direct answer to a narrower question: where was the sector’s current-dollar value added largest or smallest in 2024?
The “current” qualifier also matters for time comparisons. Current-dollar values are not adjusted to remove price changes over time. Comparing countries within one common year is straightforward, but using this series alone to describe long-run real growth would mix changes in output value with changes in prices. Constant-price or growth-rate series are better suited to that separate task.
Source and calculation method
The primary source is the World Bank World Development Indicators NV.AGR.TOTL.CD indicator page. Regional and income-group aggregates were excluded from the country/economy master set. All rankings, class counts, the mean, median and quartiles use the 186 numeric observations for 2024; the 31 source-missing rows were left missing and were not imputed from another year.
Frequently Asked Questions
Does a high value mean agriculture is a large share of GDP?
No. NV.AGR.TOTL.CD is an absolute current-US-dollar value. The share of GDP is a different World Bank indicator with a different denominator.
Why are the United States and Canada gray on the map?
This comparison fixes every observation to 2024. The supplied 2024 table has no retained value for the United States or Canada, so older observations were not substituted. Gray does not mean zero.
Are current US-dollar values adjusted for inflation?
No. Current-price values are not adjusted to remove price changes over time. Constant-price or growth-rate series are better for long-run real-growth analysis.
Which economies have the highest 2024 values?
China is highest at about $1.27T, followed by India at about $660.9B. Indonesia and Brazil are next in the supplied same-year table.
Related Articles
Global Agricultural Land Share Map – 2023 Country Comparison
Global Arable Land Share Map – 2023 Country Comparison
Global Forest Area Share Map – 2023 Country Comparison
Green Map creates custom-edited map images using open geographic data sources such as geoBoundaries, Natural Earth, OpenStreetMap, and government open data.
These maps are edited visual materials, not raw data files, and are provided for education, documents, presentations, and graphic reference.