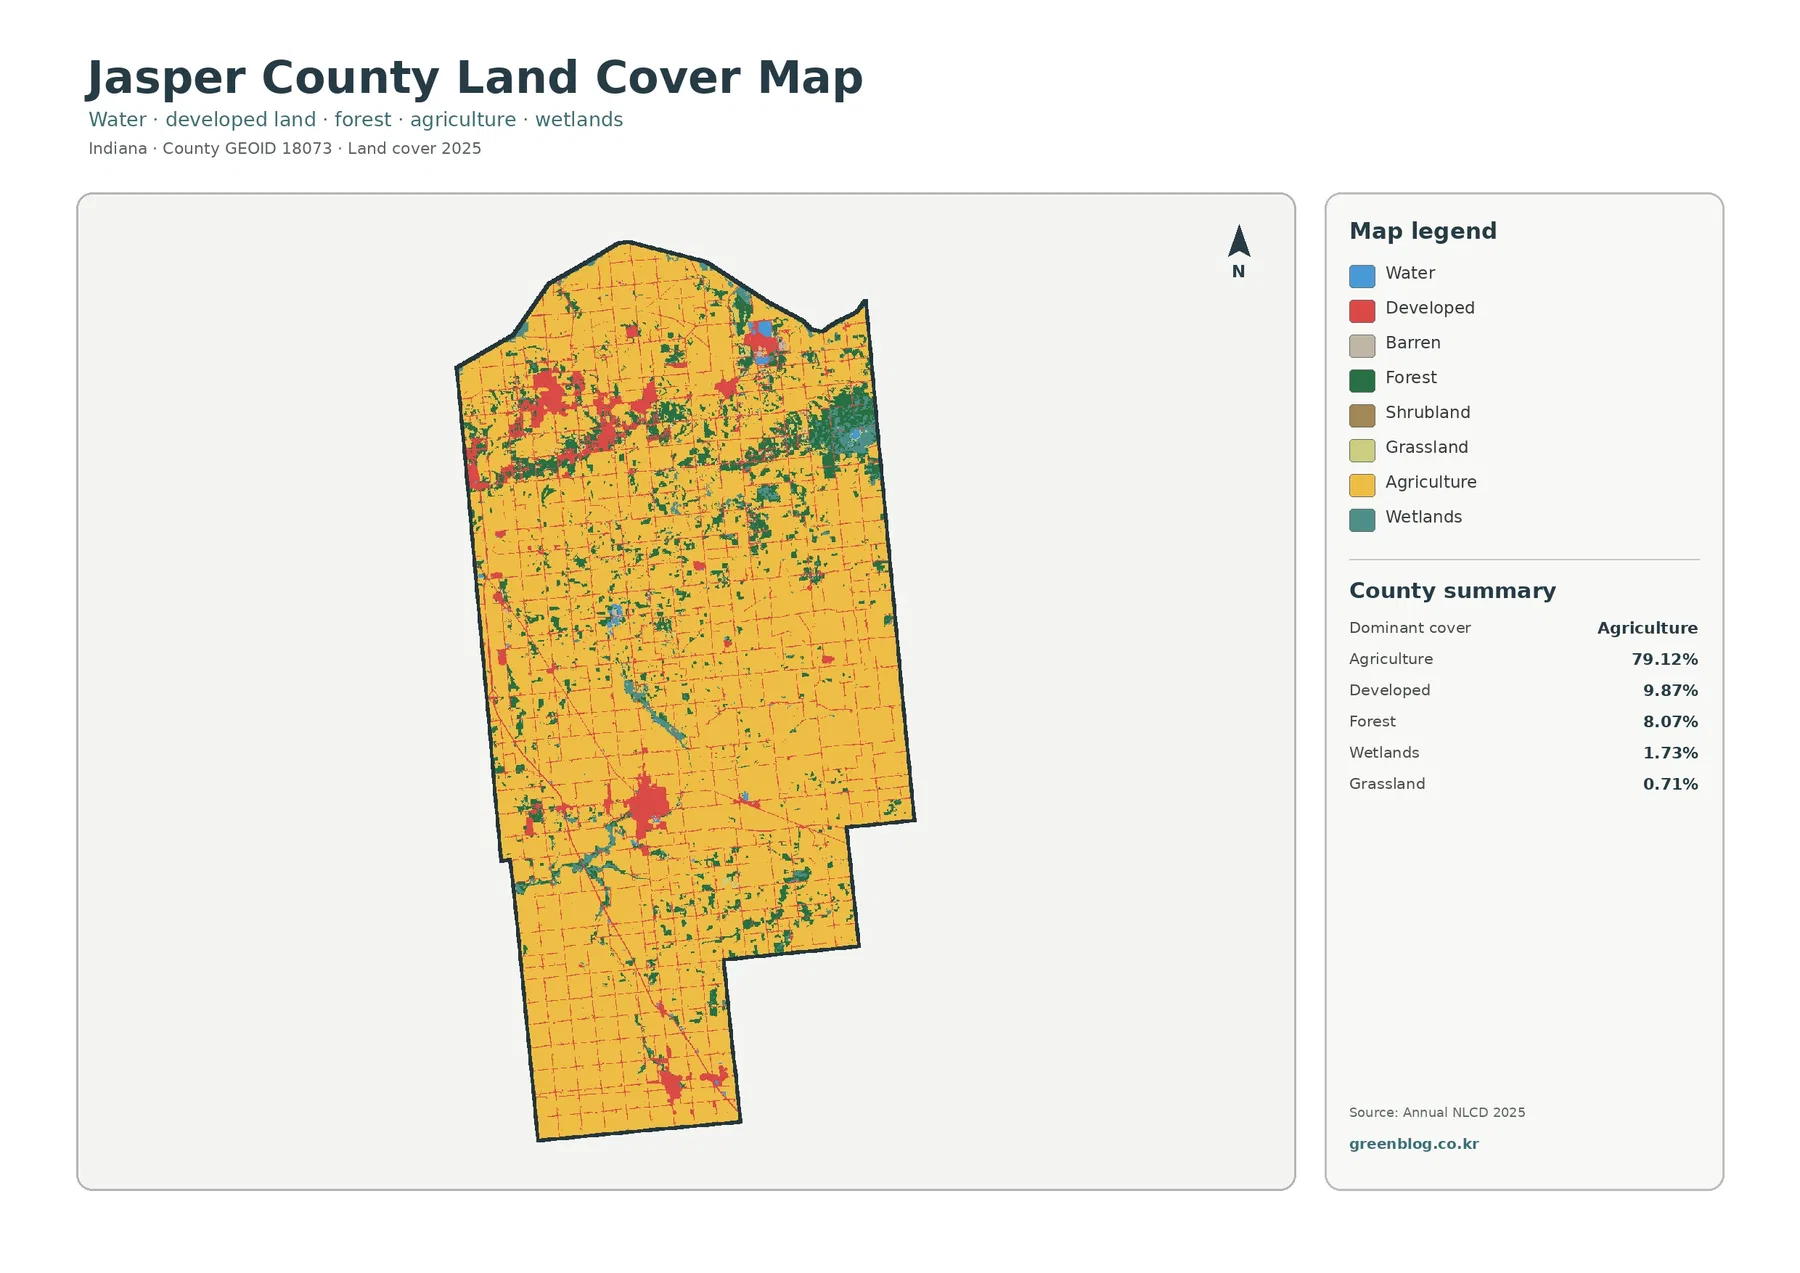
The Jasper County Indiana Land Cover Map set shows a county dominated by agriculture but not by a single uniform landscape. Agriculture accounts for 79.12% of the 2025 summary, while developed cover gathers around Rensselaer, DeMotte, and smaller towns. A much larger block of woods and wetlands stands out in the northeast, and narrow natural strips interrupt the farm grid along waterways and drainage corridors.
This page includes four complementary views: general land cover, forest and farmland, impervious surface and developed land, and mapped class differences between 1985 and 2025. After reviewing the WebP maps on the page, you can download the four original-size JPG maps together in one ZIP for printing, classroom work, presentations, or county-level reference.
Table of Contents
A broad farm matrix surrounds a few clear built centers and a wooded northeast
The 2025 county summary reports 79.12% agriculture, 9.87% developed cover, 8.07% forest, 1.73% wetlands, 0.71% grassland, 0.36% water, and 0.07% shrubland. Those percentages immediately establish farming as the dominant cover, but the map adds an important second layer of information. Developed areas are concentrated rather than evenly spread, forest becomes more substantial toward the northeast, and wetlands appear both near that natural block and in narrower corridors through agricultural land.
Jasper County’s 2022 Comprehensive Plan identifies one city, Rensselaer, and three towns: DeMotte, Remington, and Wheatfield. Their positions help anchor the land-cover pattern. DeMotte lies in the northwestern part of the county, Wheatfield in the northeast, Remington in the south, and Rensselaer is the county seat farther south of center. These settlements correspond to recognizable developed clusters on the map, although the red areas should not be treated as incorporated boundaries.
The largest yellow agricultural areas extend across the center, west, and south, broken by road lines, small settlements, wooded patches, wetlands, and water. In the northeast, green and teal become much more prominent and form a larger continuous-looking natural area than elsewhere in the county. That contrast is one of the most useful features of the map because it shows why a countywide agricultural percentage alone cannot describe every part of Jasper County.
Land cover is not the same thing as zoning, ownership, or legal land use. Annual NLCD classifies what is physically covering the ground in raster cells, such as crops, trees, developed surfaces, wetlands, or water. A yellow agricultural cell is not a parcel boundary, and a red developed cell does not tell you whether the property is residential, commercial, or industrial. Parcel status and development rules require current county GIS and planning records.
Rensselaer and DeMotte are the strongest built-cover reference points
Rensselaer is especially useful as a reference because the county comprehensive plan describes it as the county seat and notes that the community was established along the Iroquois River. On the land-cover map, the developed cluster in the south-central portion is distinct from the surrounding agricultural cover. The red area is wide enough to stand out at county scale, yet it quickly gives way to yellow fields beyond the urbanized center.
DeMotte creates another strong developed concentration in the northwest. Wheatfield, positioned in the northeast, and Remington in the southern part of the county appear as smaller settlement-scale clusters. This arrangement makes Jasper County a useful example of how a heavily agricultural county can still contain several different developed footprints rather than one single urban core.
Roads are visible indirectly because impervious and developed pixels trace thin lines through the agricultural matrix. Where roads intersect towns or clusters of buildings, those lines broaden into denser developed areas. The map shows that the features occupy the same corridors, but it does not establish why development occurred there. Transportation history, annexation, utilities, and planning decisions would require separate sources.
The contrast also matters when comparing county averages. Developed cover is 9.87%, which is far smaller than agriculture, but most of that developed cover is not spread uniformly across every township. A person standing in central Rensselaer or DeMotte would see a very different local surface pattern from someone viewing open farmland several miles away. County percentages are most useful when paired with the spatial distribution shown on the map.
The forest-and-farmland view separates the northeast natural block from the farm interior
The forest and farmland map removes much of the visual competition from developed and other classes, making the 79.12% agricultural share especially clear. Yellow cropland dominates the county interior, while green forest appears in smaller fragments along streams and field edges. The northeastern portion is different: forest occupies a larger connected-looking area, with wetlands and water mixed through it.
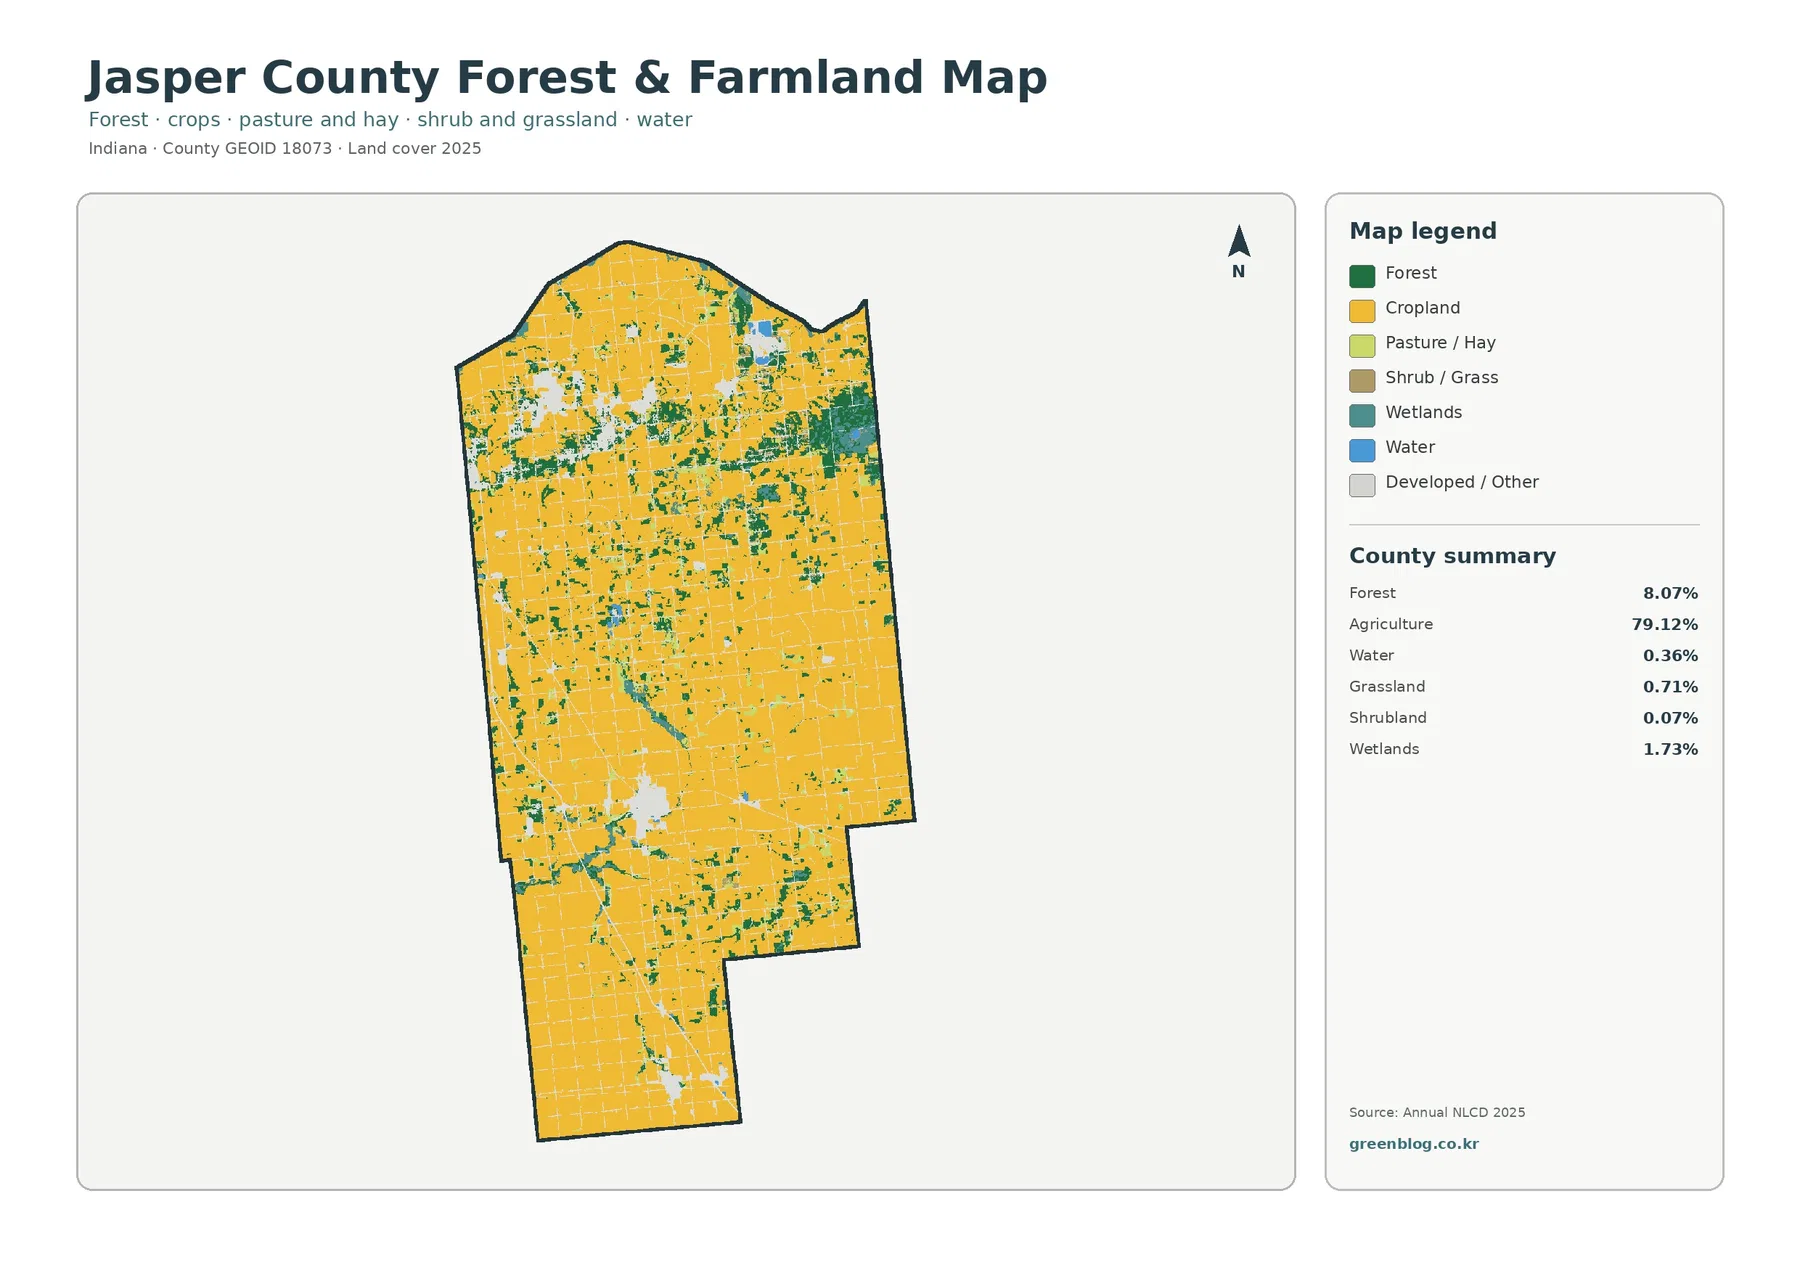
Indiana DNR’s description of Jasper-Pulaski Fish & Wildlife Area provides useful context for that northeastern pattern. The property maintains 8,179 acres of wetland, upland, and woodland game habitat. DNR also states that it borders the Kankakee River and includes river bottoms and oak savanna uplands. The land-cover map does not draw the legal boundary of the wildlife area, so the visible green and teal should not be equated directly with the managed property. Still, the official description helps explain why this corner of the county has a stronger natural-cover presence than the farm interior.
Forest makes up 8.07% of the county, but that percentage combines different settings. Large managed habitat, private woods, riparian trees, shelterbelts, and smaller wooded patches can all fall into the same broad forest category. The map is therefore appropriate for locating and comparing wooded cover, but it cannot identify public access, timber ownership, forest type, or management status.
Agriculture is similarly generalized. The map does not identify corn, soybeans, hay, or other individual crops. It shows agricultural land cover as a broad surface class. A field, farmstead, drainage ditch, tree line, and narrow road can also fall within neighboring raster cells, so the map should be read as a county-scale pattern rather than a field-by-field inventory.
Wetlands occupy more area than open water and matter most near river and habitat corridors
Water accounts for only 0.36% of the 2025 summary, while wetlands account for 1.73%. This difference is important because the blue water class alone understates the amount of land associated with wet conditions. Teal wetland pixels occur in the northeastern natural area and also appear in narrow or irregular patches that extend through the agricultural landscape.
The county comprehensive plan places Rensselaer along the Iroquois River, while DNR describes Jasper-Pulaski FWA as bordering the Kankakee River. These official references provide geographic context for interpreting water-related cover. They do not mean that every mapped wetland cell belongs to either river corridor, but they help connect the county’s visible wetland and forest patterns with real hydrologic settings.
Mapped wetlands should not be treated as regulatory wetland boundaries. Remote land-cover classification describes surface conditions, whereas jurisdictional status may require field work, soil and vegetation evidence, and agency review. The map is most useful for identifying where wetland cover is concentrated and how it sits next to farms, woods, and settlements.
This distinction is especially valuable in a county where agriculture is so dominant. A small wetland percentage can appear minor in a table, yet the map shows that those pixels can form meaningful local corridors or clusters. When teaching or presenting the county, it is often more informative to show where the wetlands occur than to quote the countywide percentage alone.
Impervious cover is low countywide but sharply concentrated inside settlements
Impervious surface means pavement, rooftops, parking areas, and other hard surfaces that do not readily absorb water. Jasper County’s 2025 mean impervious value is 2.76%, and 1.24% of the county is mapped above 50% impervious. Developed land cover is higher at 9.87% because developed classes can include lawns, trees, and other permeable spaces mixed with buildings and pavement.
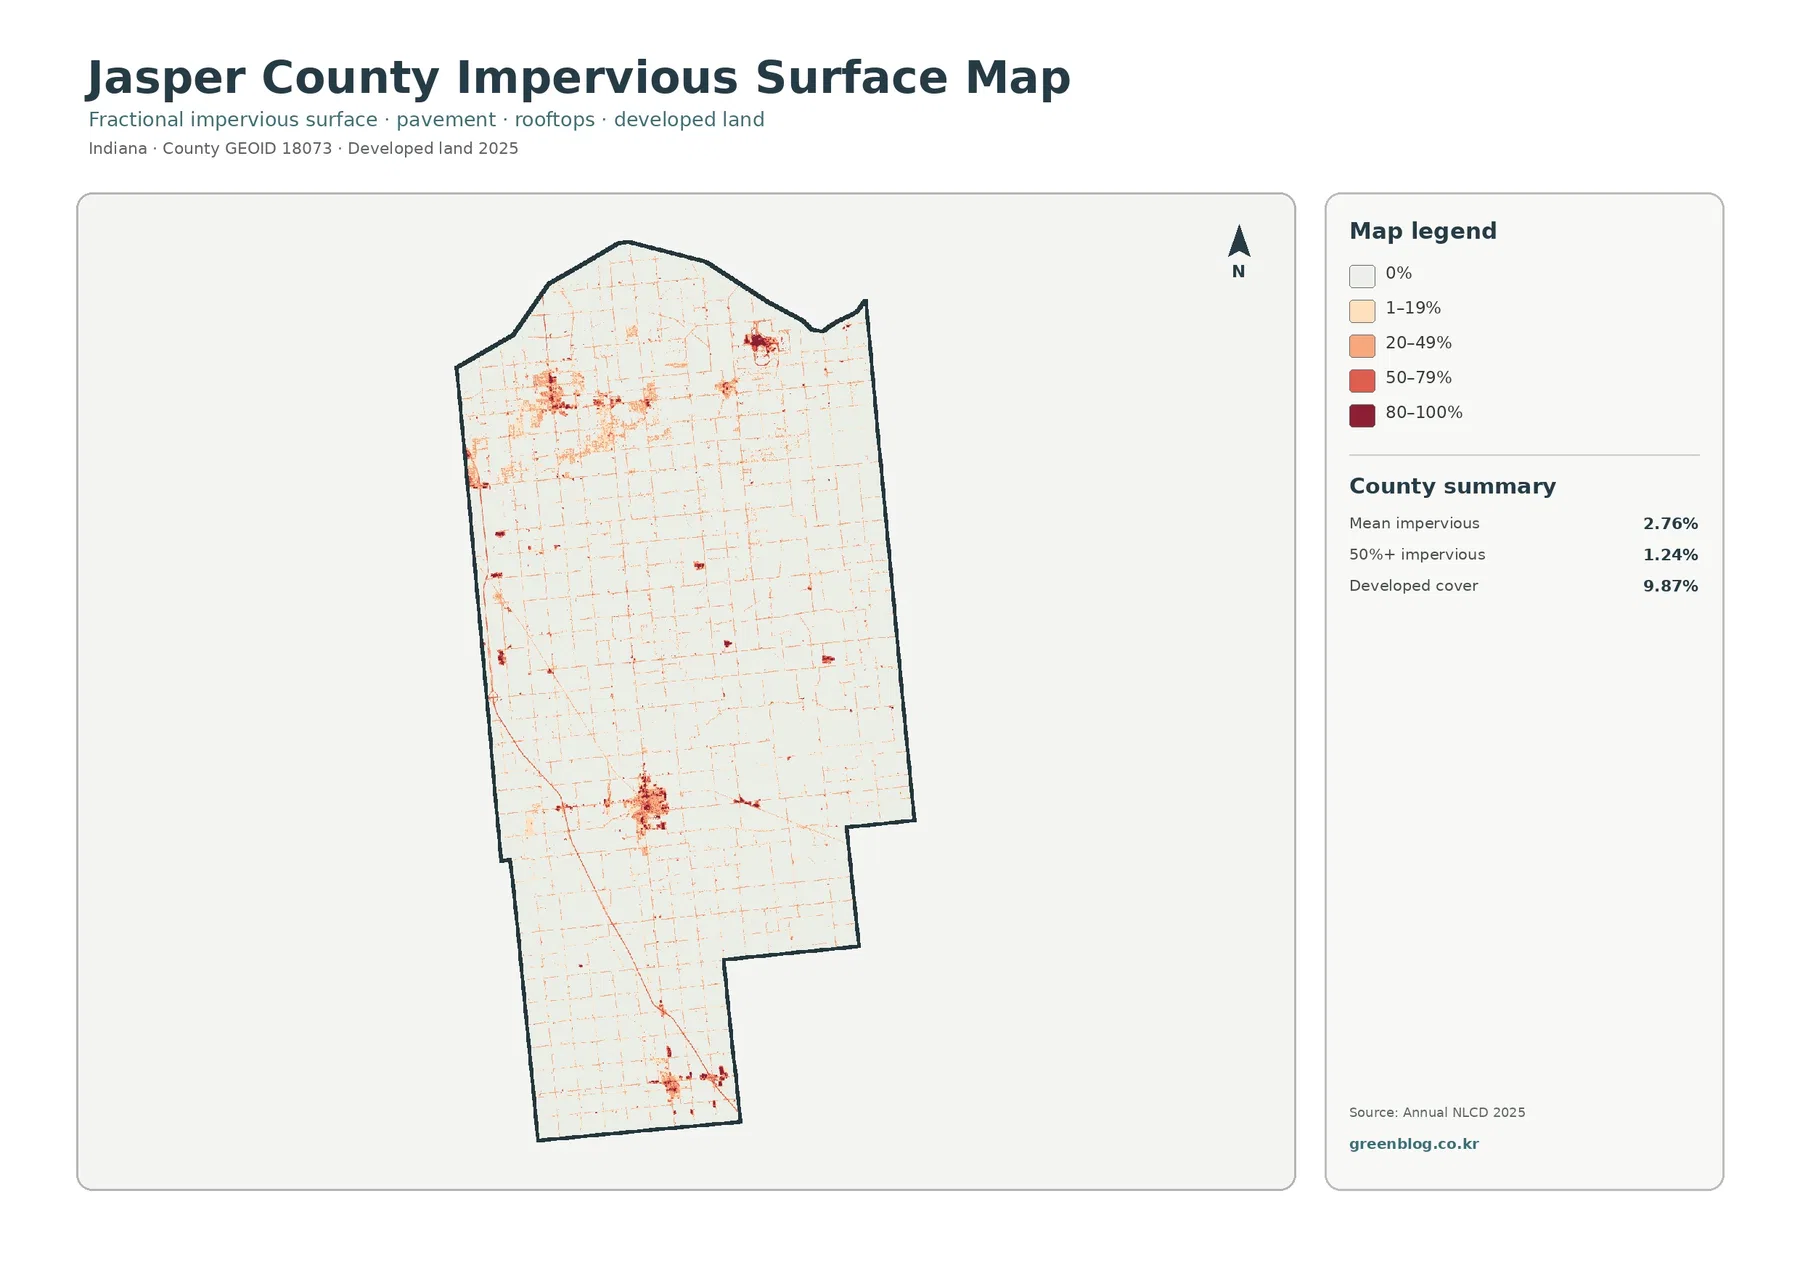
The impervious map makes settlement structure much easier to see than the general land-cover map. Darker values are concentrated in the two larger built clusters associated with Rensselaer and DeMotte. Smaller concentrations appear around other communities, while thin linear traces follow parts of the rural road network. Most agricultural areas remain very light because cropland itself contributes little impervious surface.
A countywide mean of 2.76% should not be interpreted as the typical value inside a town. Agriculture covers such a large portion of Jasper County that the rural area pulls the average downward. Local blocks in Rensselaer or DeMotte can contain much higher impervious fractions even though the county mean remains low. Looking at the map and summary together prevents that averaging effect from hiding local concentrations.
The impervious layer is useful for comparing hard-surface concentration, but it is not a flood-risk or stormwater-capacity map. Flooding depends on elevation, soils, drainage infrastructure, rainfall, river conditions, and other factors. Anyone evaluating drainage or flood exposure should combine this layer with appropriate hydrologic and engineering data rather than drawing conclusions from impervious cover alone.
Most cells keep the same broad class between 1985 and 2025, while 7.39% differ
The change map compares broad land-cover classifications for 1985 and 2025. The county summary reports a 7.39% class difference. Within that total, 2.01% is mapped as changed to developed, 0.32% as forest loss, 0.98% as agricultural loss, and 3.95% as other class difference. Wetland difference is also represented as a separate legend category. These values describe classification differences, not annual rates of change.
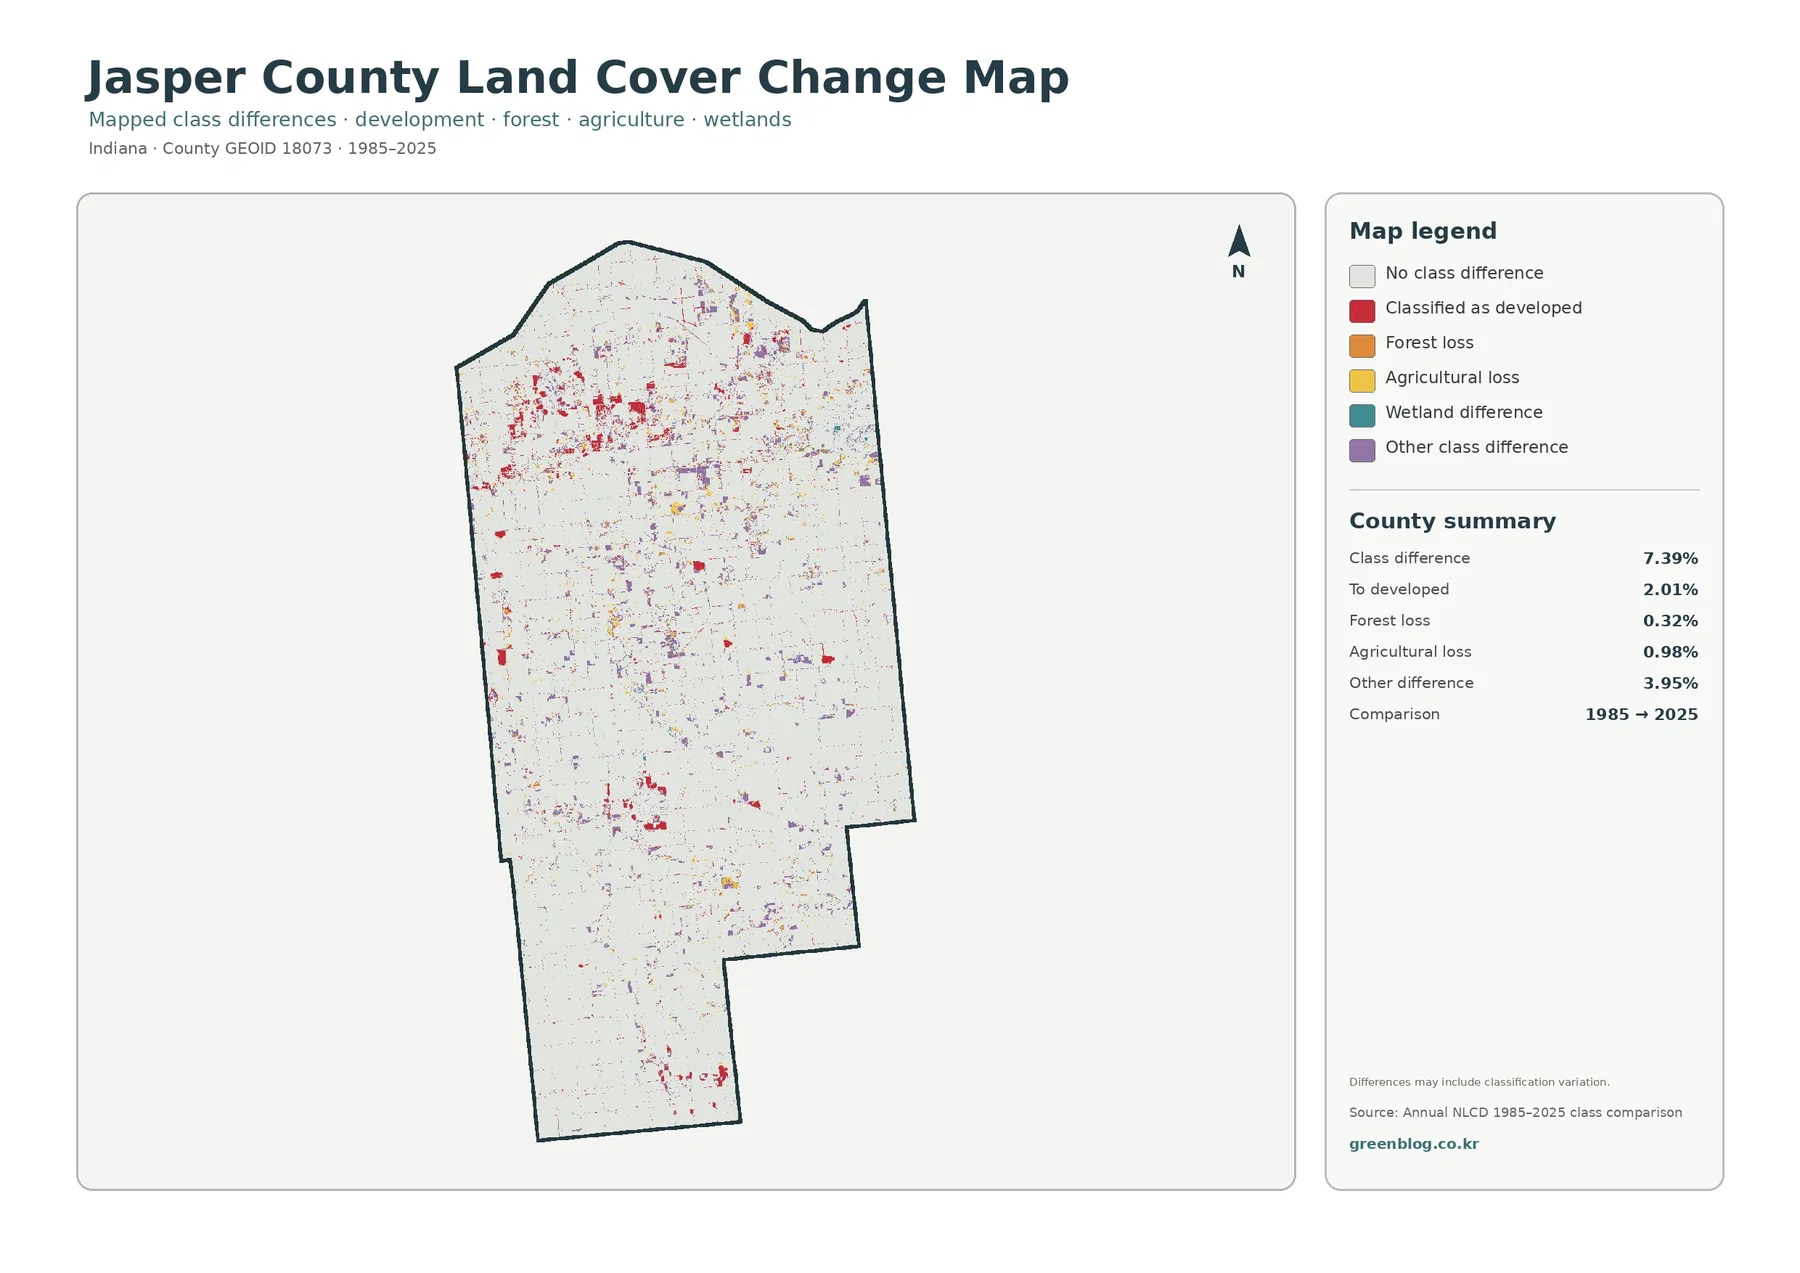
Red changed-to-developed pixels are most noticeable around the larger settlement areas and appear in smaller clusters elsewhere. Purple other-difference pixels are more widely scattered, and the agricultural- and forest-loss categories occur in smaller patches. The pale no-difference background still covers most of the map, so the visual message is not that the entire county transformed. Instead, broad agricultural dominance persisted while selected locations changed class.
A class difference does not reveal the exact year or cause of the change. If a cell is agricultural in one comparison year and another class in the second, the map does not tell you whether the shift happened in 1990, 2010, or shortly before 2025. It also cannot explain whether a mapped difference reflects construction, vegetation succession, drainage conditions, field rotation near class boundaries, or classification variation.
Current developed cover should also be kept separate from changed-to-developed cover. A town center that was already developed in 1985 can remain developed in 2025 and therefore appear as no class difference. Conversely, a small difference in a rural location should not automatically be described as urban expansion. The general map and change map answer different questions and are most useful when viewed side by side.
Use the four maps to move from countywide pattern to local surface detail
A practical reading sequence starts with the general land-cover map. Identify the broad farm matrix, the larger settlement clusters, and the northeastern natural block before switching layers. Once those anchor points are familiar, the forest-and-farmland map clarifies where woody cover interrupts agriculture, and the impervious map separates heavily paved or built surfaces from lower-intensity developed land.
The change map works best after the current pattern is understood. It answers where the 1985 and 2025 broad classes differ, not what the county looks like today. For example, a red settlement on the current map may contain only limited changed-to-developed color because part of that town was already developed in the earlier comparison year.
For a classroom or presentation, choose one location and follow it across all four maps. Rensselaer provides an urban example: general developed cover, dark impervious surfaces, and selected change pixels can be compared without treating them as the same measurement. The northeastern forest-wetland area provides a natural example where forest, wetlands, and change classes can be contrasted against the surrounding agricultural matrix.
These comparisons are also useful for county profiles. A single statement that Jasper County is 79.12% agricultural is correct but incomplete. Adding the spatial story—developed clusters in the northwest and around Rensselaer, a larger natural block in the northeast, and waterways cutting through the farm landscape—creates a much more accurate picture of the county.
Raster classification simplifies field edges, small water features, and mixed developed areas
Annual NLCD uses raster cells, meaning the landscape is divided into a regular grid and each cell receives a representative class or value. Very narrow roads, small ponds, shelterbelts, streambanks, and mixed farmstead surfaces can be simplified at this scale. A cell that contains both grass and a building, for example, may not display every individual surface visible on the ground.
That limitation matters near boundaries between crops, woods, wetlands, and developed land. A slight shift in classification between 1985 and 2025 can appear on the change map even when the physical boundary is complex or gradual. The map is designed for broad spatial comparison, not for surveying property lines or measuring exact field acreage.
The dates matter as well. The general, forest-and-farmland, and impervious maps represent 2025 conditions, while the change map compares 1985 with 2025. Construction, drainage work, clearing, restoration, or agricultural changes after 2025 are outside the mapped period. Current planning decisions should therefore use the latest county records and imagery in addition to these maps.
Named places such as Jasper-Pulaski Fish & Wildlife Area and the Iroquois River provide geographic context, but the land-cover graphics do not draw their precise legal or management boundaries. Use DNR property maps, county GIS, and official water or parcel layers when boundary accuracy is important.
The JPG set is designed for side-by-side reference, printing, and presentation
Each downloadable JPG is 2480 × 1754 pixels. The WebP versions embedded in the article are convenient for browser viewing, while the JPG files are easier to save, print, or place into a slide or document. Keeping the four maps together is especially useful because the legend and summary change from one view to the next.
For printing, preserve enough page size for the legend and small settlement patterns to remain readable. If a map is reduced too aggressively, narrow wetland corridors, rural road traces, and smaller change patches can disappear visually. A good presentation can show the full county first and then enlarge a specific area such as Rensselaer or the northeastern forest-wetland block.
When the maps are used in research or planning notes, include the data year and source. The current land-cover and impervious views use Annual NLCD 2025, and the change map is a 1985-to-2025 class comparison. These maps are reference products and should be supplemented with specialized datasets for zoning, parcels, flood hazards, wetlands regulation, or engineering analysis.
Frequently Asked Questions
Does 79.12% agriculture mean the county looks the same from north to south?
No. Agriculture dominates the county total, but developed cover is concentrated around Rensselaer, DeMotte, and smaller towns, while the northeast contains a larger concentration of forest and wetlands. The percentage is a countywide average, so the map is needed to see where local landscapes differ.
Is the large northeast forest-and-wetland area exactly the Jasper-Pulaski FWA boundary?
No. Indiana DNR describes Jasper-Pulaski FWA as an 8,179-acre property with wetland, upland, and woodland habitat bordering the Kankakee River, which provides useful context for the northeast pattern. The land-cover map does not draw the property’s legal boundary, so use the official DNR property map for boundary questions.
Can the 7.39% 1985–2025 class difference be called Jasper County’s development rate?
No. The 7.39% total includes 2.01% changed to developed, 0.32% forest loss, 0.98% agricultural loss, 3.95% other class difference, plus mapped wetland differences. It is a summary of several classification changes between two years, not a single development-growth rate.
Map File Information
The ZIP contains four original JPG maps for Jasper County: 2025 land cover, forest and farmland, impervious surface and developed land, and mapped land-cover class differences from 1985 to 2025.
- Printable Size: 2480 × 1754 px each
- File Type: ZIP containing 4 JPG files
- Intended Use: printing, classes, presentations, county profiles, and land-cover comparison
Related Maps
- Adams County Indiana Land Cover Map
- Allen County Indiana Land Cover Map
- Bartholomew County Indiana Land Cover Map
Sources and References
- MRLC Annual NLCD Data – official source for the 2025 land-cover data used in the map set
- USGS Annual NLCD Land Cover Classification – explanation of the Annual NLCD classification system
- U.S. Census Bureau TIGER/Line Shapefiles – official geographic boundary reference for Jasper County
- Jasper County Comprehensive Plan – 2022 Update – municipal locations and local context for Rensselaer, DeMotte, Remington, and Wheatfield
- Indiana DNR – Jasper-Pulaski Fish & Wildlife Area – wetland, upland, woodland, and Kankakee River context in the county’s northeast
- Jasper County Government – current county GIS, Planning & Development, and administrative resources
Green Map creates custom-edited map images using open geographic data sources such as geoBoundaries, Natural Earth, OpenStreetMap, and government open data.
These maps are edited visual materials, not raw data files, and are provided for education, documents, presentations, and graphic reference.