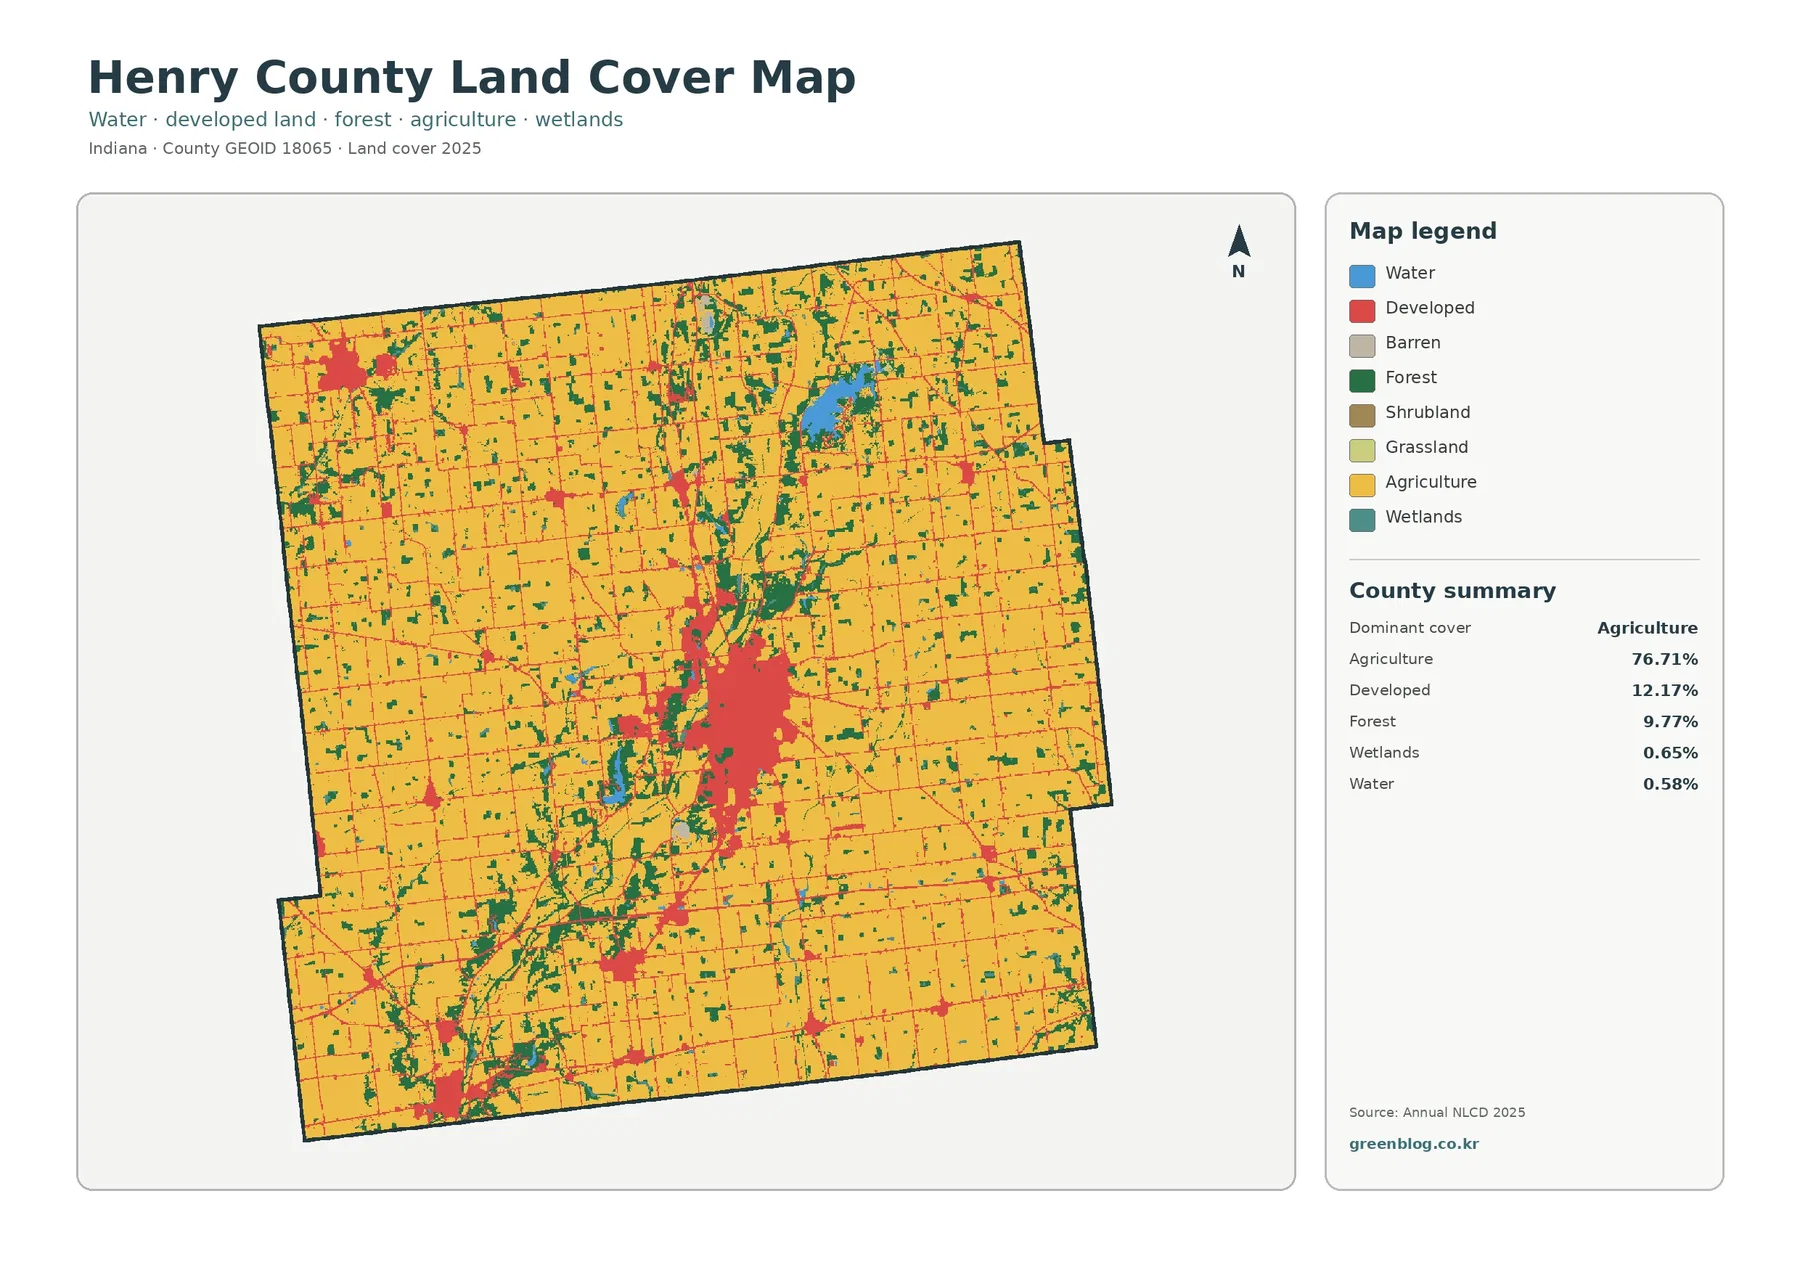
The Henry County Indiana Land Cover Map set covers the county in east-central Indiana with four views of the same landscape: 2025 land cover, forest and farmland, impervious surface, and land-cover class change from 1985 to 2025. Agriculture dominates 76.71% of the county, yet New Castle forms a conspicuous developed center while Summit Lake adds a large water feature amid farm fields and wooded cover.
All four maps can be viewed on the page, and the four original JPG files are available together in one ZIP download. The set is useful when you need to compare the countywide farm pattern with built areas, natural cover around water and river valleys, hard surfaces around towns, or places where the mapped class differs between the two comparison years.
Table of Contents
New Castle stands out inside a county that is more than three-quarters agricultural
Agriculture accounts for 76.71% of Henry County in the 2025 summary. Developed land covers 12.17%, forest 9.77%, wetlands 0.65%, and water 0.58%. Those figures establish a strongly agricultural county, but the spatial arrangement matters just as much as the totals. The broad farm background is interrupted by a large developed area near the middle of the county, smaller built-up places toward the northwest and southwest, and irregular wooded corridors that cut through or border fields.
Henry County’s adopted comprehensive plan identifies New Castle as the county seat and its largest municipality, with Middletown, Knightstown, Spiceland, and other communities forming much smaller centers. That context matches the most obvious pattern in the land-cover image: New Castle is the largest red developed cluster, while smaller red patches appear elsewhere. The red edge should not be treated as a municipal boundary, however. It represents developed land cover rather than legal city limits, zoning districts, or parcels.
Across the rural portions of the county, agricultural cover forms large yellow blocks crossed by thin developed lines and scattered small developed patches. Forest does not occupy a single corner. Instead, green areas appear in irregular pieces, often where the field pattern becomes less continuous. This makes Henry County a useful example of why a countywide percentage alone can be misleading: a visitor looking only at 76.71% agriculture would miss the strong contrast between the New Castle area and the surrounding farm landscape.
Summit Lake creates a distinct water-and-woodland feature northeast of New Castle
One of the easiest natural features to recognize is the substantial blue water body northeast of the central developed area. Indiana DNR places Summit Lake State Park near New Castle and describes a property of more than 2,680 acres centered on a large lake. The agency also notes low-lying wet meadows and prairies as well as Zeigler Woods, Henry County’s first nature preserve. That official description provides useful context for the mixture of water, forest, and wetland colors visible around the lake in the land-cover map.
Water occupies only 0.58% of the county, so the numerical share is small even though Summit Lake is visually prominent. Wetlands are similarly limited at 0.65%, but small wetland patches appear near water and in other low or stream-associated settings. Their value on this map is geographic rather than simply statistical: they identify places where the otherwise extensive agricultural pattern is interrupted by different surface cover.
Another county-specific natural reference lies north of New Castle at Wilbur Wright Fish & Wildlife Area. Indiana DNR describes the 1,070-acre property as river valleys and adjacent uplands in Henry County, with the Big Blue River forming its western boundary and the Little Blue River valley also crossing the property. Mature woods, fallow cropland, prairie vegetation, and a small wetland are part of that site. These documented habitat types help explain why the county’s northern landscape should not be read as uninterrupted cropland, even though agriculture is the dominant class overall.
The forest-and-farmland view strips away urban color to reveal the rural pattern
The simplified forest-and-farmland map emphasizes forest at 9.77% and agriculture at 76.71%, while also retaining water at 0.58%, wetlands at 0.65%, grassland at 0.03%, and shrubland at 0.02%. Developed and other classes are muted, so New Castle becomes a pale opening rather than the strongest visual element. The change in emphasis makes it easier to trace wooded pieces through farm country and to compare natural cover around Summit Lake with the much broader cropland matrix.
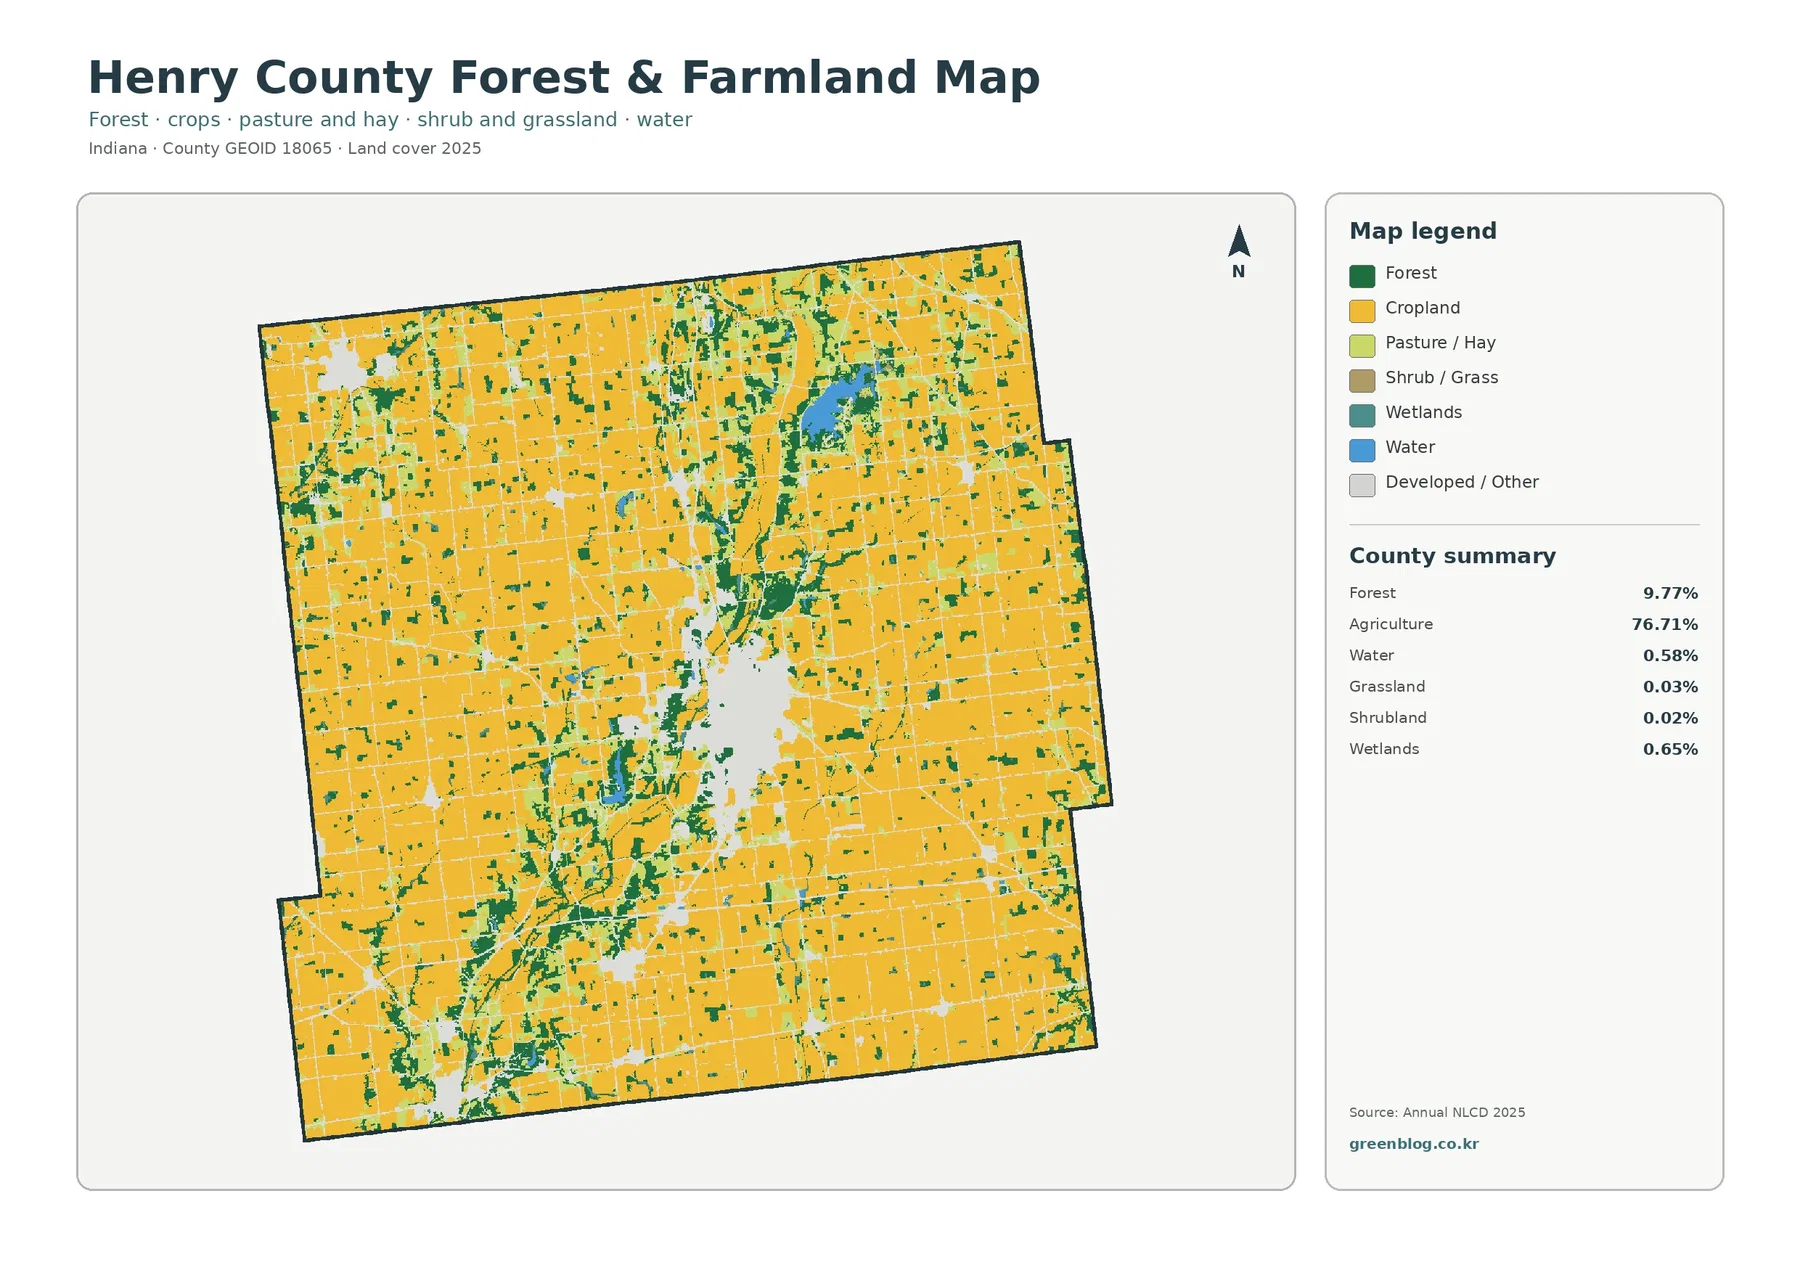
Wooded cover appears as a network of irregular green patches rather than a broad continuous forest. Some pieces are isolated within fields; others extend in longer shapes through the central and northern parts of the county. The Wilbur Wright FWA description confirms that river-valley woods and other habitats occur near New Castle, but the green pixels on this county map should not be assumed to match that property’s legal boundary. The same caution applies around Summit Lake State Park.
Cropland color also needs a careful reading. It identifies land-cover classes derived from satellite data, not individual farm ownership, crop type, agricultural zoning, or a surveyed field boundary. A single raster cell can represent the dominant surface even when a road edge, tree row, drainage feature, or building is present within or beside it. For county-scale comparison, that generalization is helpful; for parcel decisions, it is not precise enough.
Mean impervious cover is 3.40%, with the strongest footprint around New Castle
Impervious surface refers to roofs, pavement, parking areas, and other hard surfaces that resist infiltration. Henry County’s mean impervious value is 3.40%, and 1.63% of the county is mapped at 50% impervious or greater. The developed-land share is much higher at 12.17% because developed classes can include lawns, trees, and other pervious surfaces within built environments. Looking at both measures prevents the common mistake of treating all developed land as fully paved.
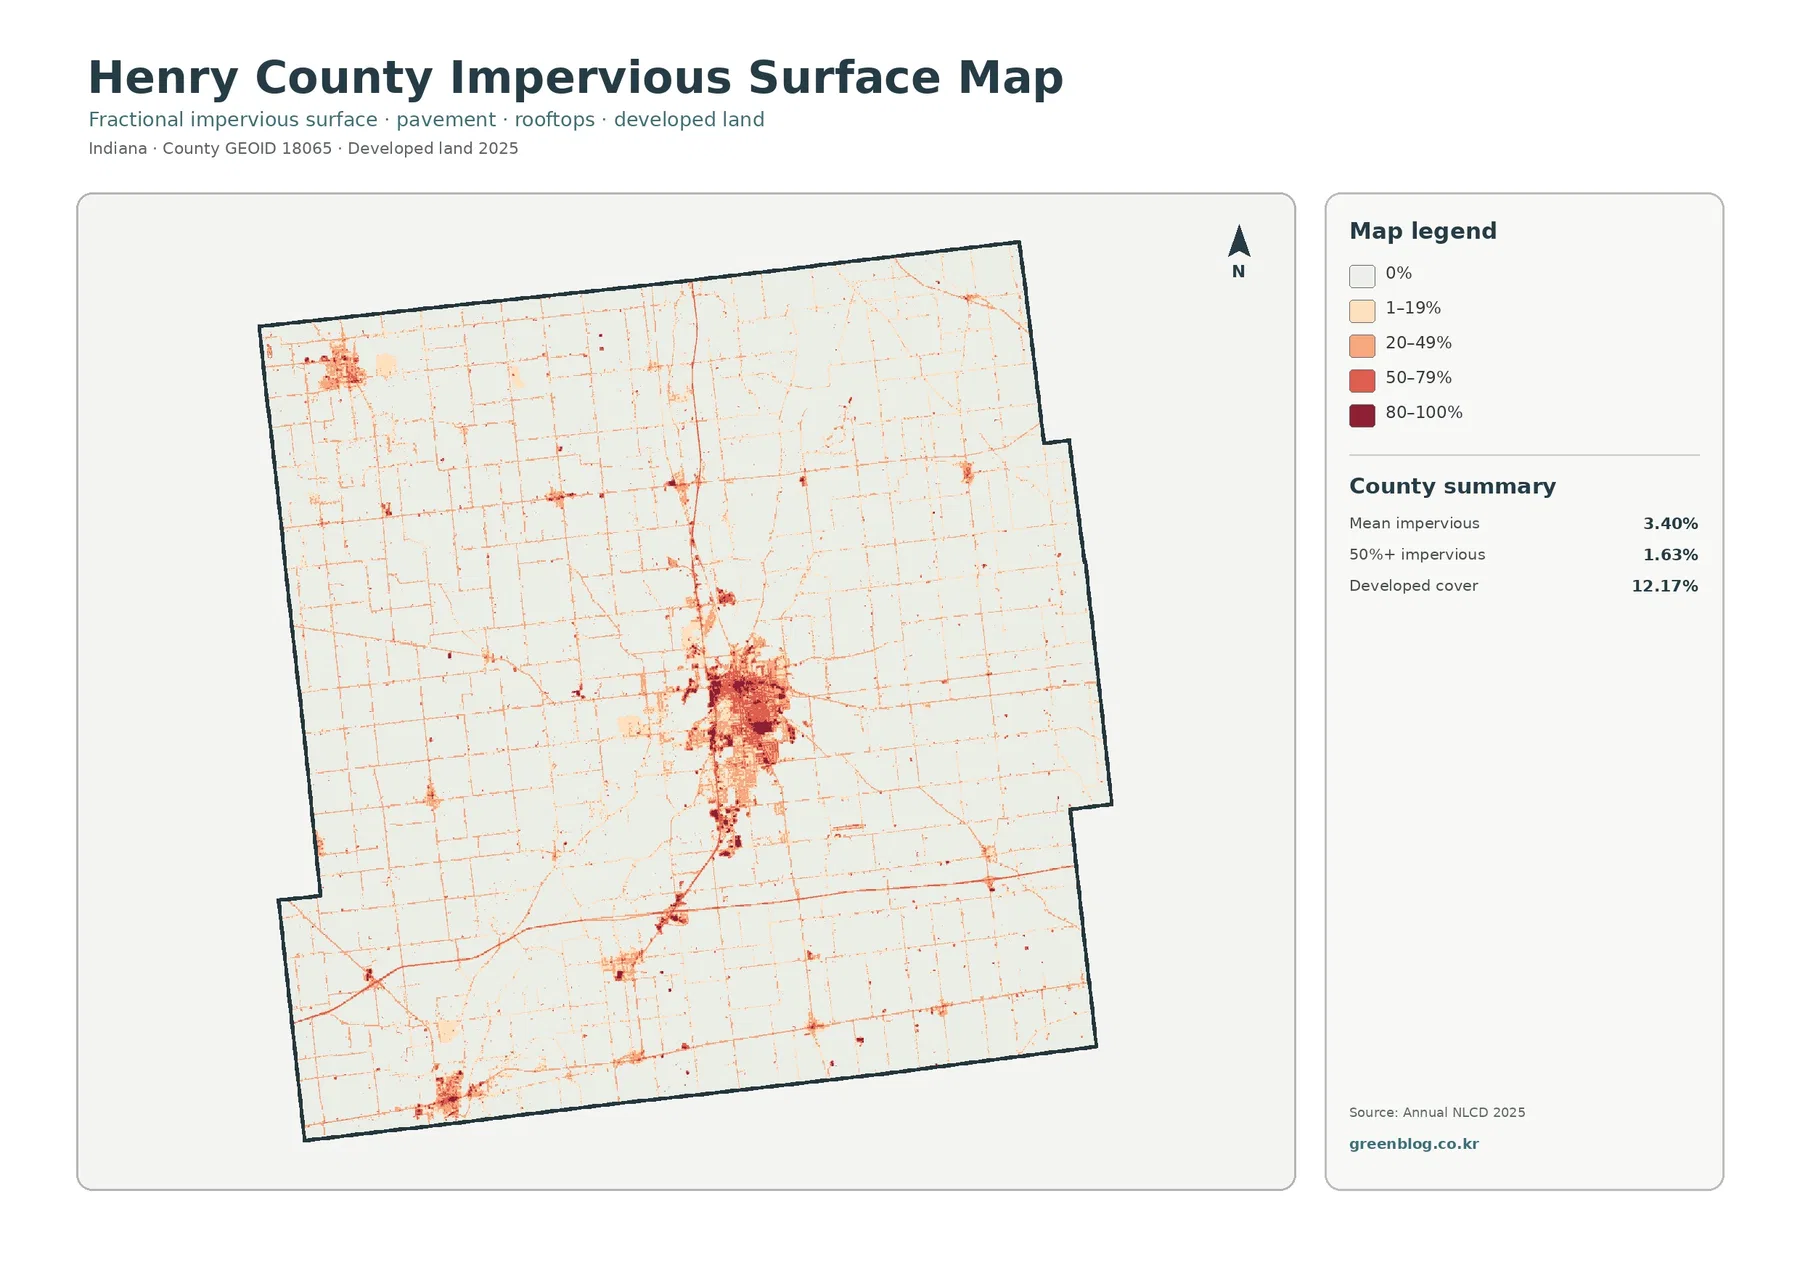
New Castle is unmistakable in this layer. Darker tones cluster around the central city, while roads extend outward as thin linear marks and smaller settlements appear as compact spots elsewhere. Most agricultural land remains very light, so the contrast between the county’s built center and its rural surroundings is even clearer than in the general land-cover map. The northwest and southwest developed centers can also be found, but neither approaches the size or intensity of the New Castle footprint.
Hard-surface mapping can support a discussion of runoff, but it cannot determine flood risk by itself. Flooding depends on rainfall, topography, soils, drainage systems, streams, and water levels in addition to pavement and roofs. For work near the Big Blue River, Little Blue River, or Summit Lake, the impervious map should therefore be paired with hydrology, elevation, and official hazard information rather than used as a substitute for those sources.
The 9.46% class difference from 1985 to 2025 is a mixture of several change categories
The comparison layer reports a total class difference of 9.46% between 1985 and 2025. Within the summary, 1.69% is classified as changed to developed, 0.30% as forest loss, 1.00% as agricultural loss, and 6.43% as other class difference. Wetland difference is also represented in the legend. The total should not be described as a 9.46% development rate, because most of it belongs to categories other than changed-to-developed.
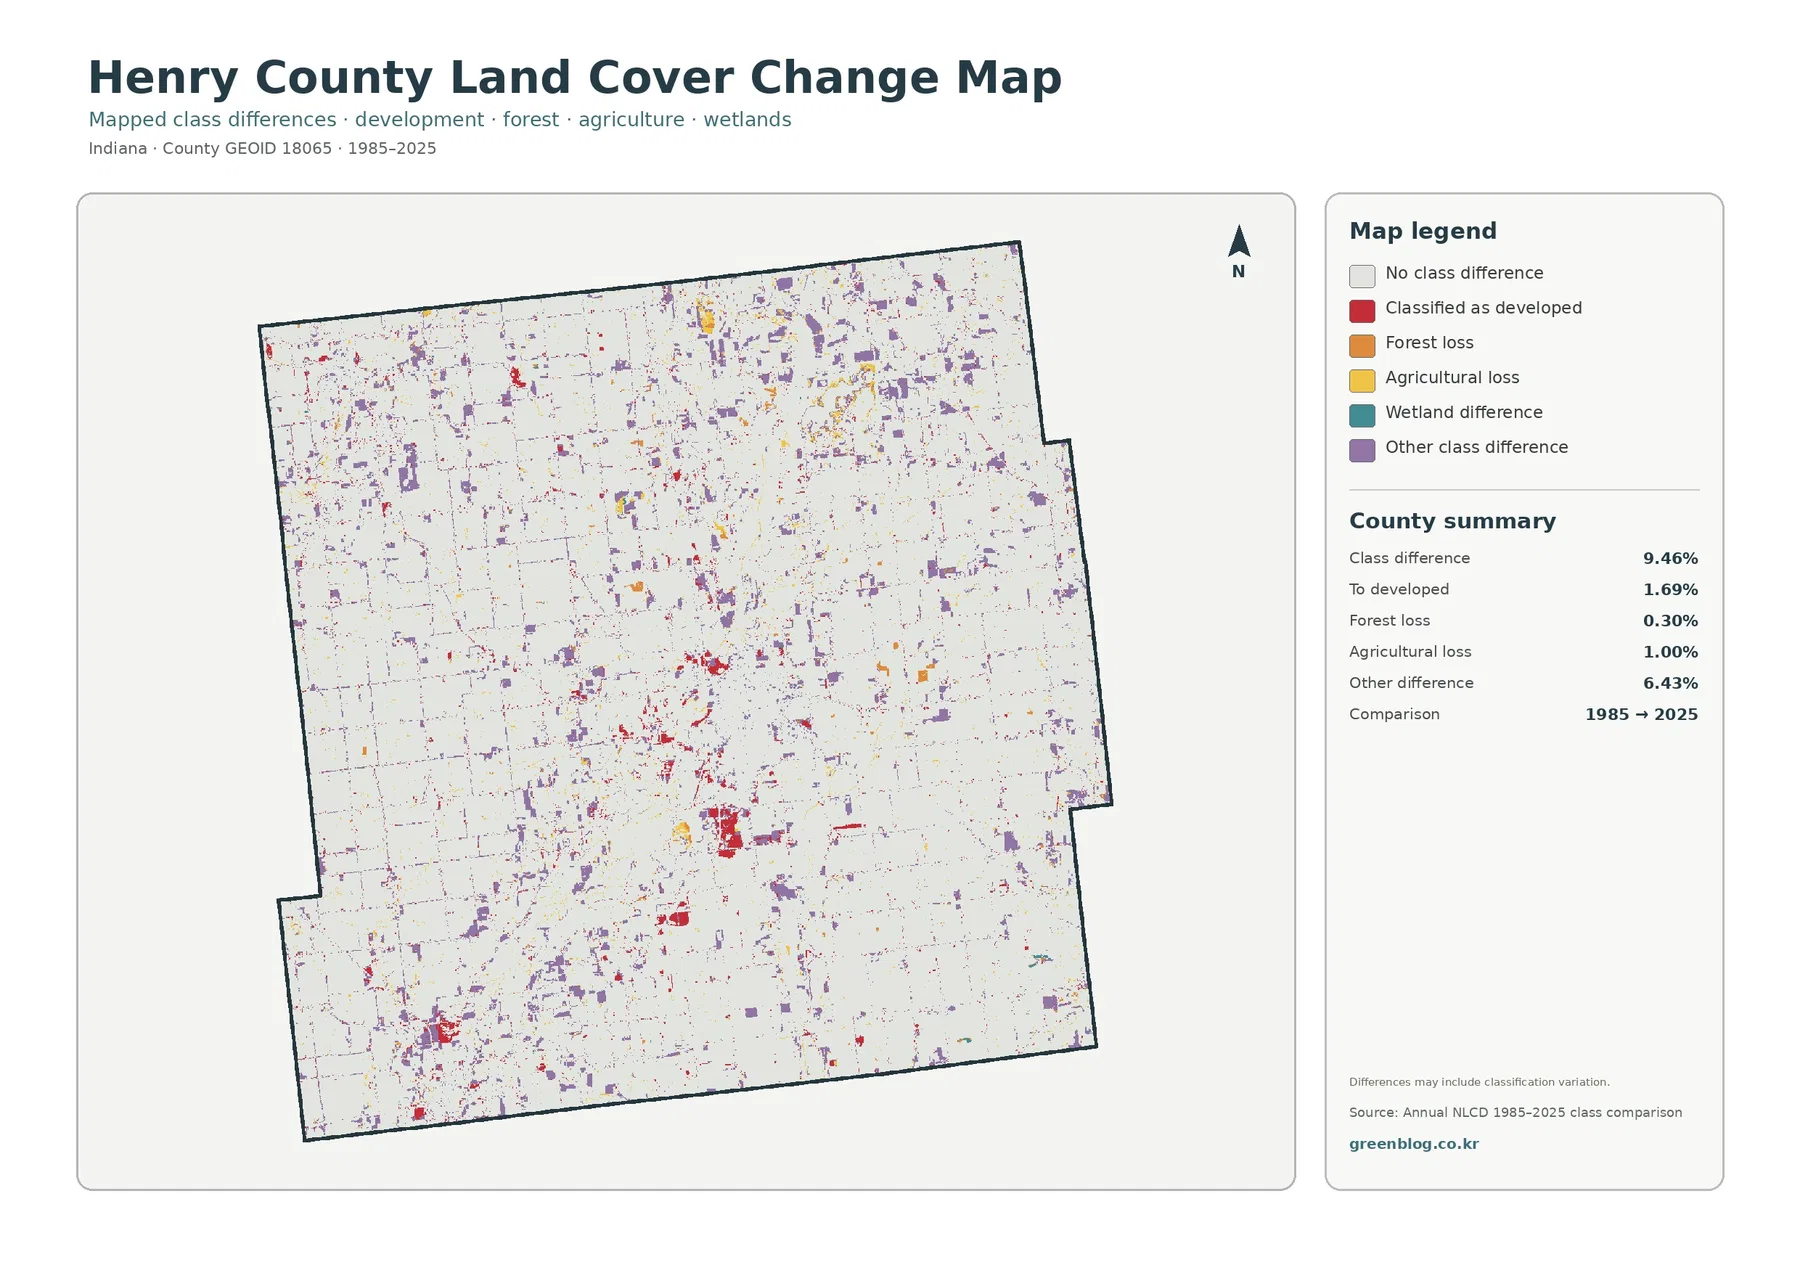
Red changed-to-developed areas are most noticeable around New Castle and in smaller pockets around other built places. Purple other-class differences are scattered more broadly across farm country, while forest-loss and agricultural-loss colors occur in smaller patches. Large pale areas indicate no class difference in this two-date comparison. The pattern therefore suggests concentrated rather than uniform change, but it does not provide a year-by-year history of what happened between the endpoints.
Classification change should be interpreted with the limits of raster data in mind. Annual NLCD assigns a class to grid cells, and cells near narrow roads, field edges, small woods, or mixed surfaces can be sensitive to differences in classification or imagery. Some mapped differences can reflect real land conversion, while others may involve class interpretation at the cell level. Confirming when a particular parcel changed requires aerial imagery, county records, or other time-specific evidence.
Choose the layer by the question you need to answer
For a quick county overview, start with the 2025 land-cover map. It gives the clearest combined picture of the agricultural majority, New Castle’s central developed area, Summit Lake, and the scattered forest and wetland cover. Once those landmarks are located, the other layers become easier to read because the same county outline and general positions can be compared from one image to the next.
Use the forest-and-farmland version when the purpose is rural landscape, habitat context, watershed education, or a simple classroom comparison between tree cover and agriculture. Switch to the impervious layer when roofs and pavement matter more than the broad developed class. For long-term comparison, the change map is the relevant choice, but its class-difference categories should remain separate rather than being collapsed into one development statistic.
Printing the set side by side can be useful because each layer answers a different question without changing the county extent. A presentation might use the general map to establish context, the forest-and-farmland map to discuss natural cover, the impervious map to locate the built footprint, and the change layer to introduce the 1985–2025 comparison. Keeping the maps in that sequence also reduces the temptation to interpret a single color as a complete description of the county.
County-scale maps are useful for pattern, not parcel-level decisions
The four images are designed for county-scale reference. Small ponds, narrow tree rows, individual buildings, and road shoulders can be generalized or represented by the dominant class of a raster cell. A color boundary should not be used as a surveyed property line. Land cover also differs from land use: a wooded parcel can be privately owned, publicly managed, protected, or developable under local rules, and the green class alone does not answer any of those legal questions.
The data year matters as well. The current-cover and impervious maps summarize 2025, while the change layer compares 1985 with 2025. Construction, vegetation change, restoration, or agricultural conversion after the observation period will not be represented. Anyone using the maps for present-day planning should check recent county GIS, aerial photography, and official local records in addition to the map set.
Within those limits, Henry County is especially easy to understand through contrast. A large agricultural matrix surrounds a distinct central city; Summit Lake and nearby natural cover interrupt the farm pattern to the northeast; river-valley habitat adds wooded and wetland complexity north of New Castle; and the impervious map confirms that the strongest concentration of hard surface is not spread evenly across the county. Those are county-specific observations that remain visible across the four layers.
Frequently Asked Questions
Why does New Castle look so prominent if agriculture covers 76.71% of Henry County?
The 76.71% figure is calculated across the entire county. Large agricultural areas surround New Castle and occupy most of the county, while developed cover is concentrated more strongly in a few places. New Castle is the largest of those centers, so it dominates visually even though agriculture remains the countywide majority.
What is the large water feature northeast of the central developed area?
Indiana DNR identifies Summit Lake State Park near New Castle, centered on a large lake and including wet meadows, prairies, and Zeigler Woods. The prominent blue feature in that part of the county is consistent with Summit Lake’s location. The land-cover colors around it describe surface cover, not the exact legal park or preserve boundary.
Does the 9.46% class difference mean 9.46% of Henry County became developed?
No. The 9.46% total combines several categories. The map summary lists 1.69% changed to developed, 0.30% forest loss, 1.00% agricultural loss, 6.43% other class difference, and a separate wetland-difference category in the legend. It is a two-date class comparison rather than a single development-rate measure.
Map File Information
The ZIP contains four original JPG maps for Henry County: 2025 land cover, forest and farmland, impervious surface/developed land, and the 1985–2025 land-cover class comparison.
- Printable Size: 2480 × 1754 px each
- File Type: ZIP containing 4 JPG files
- Intended Use: printing, reports, classroom work, presentations, and county land-cover reference
Related Maps
- Adams County Indiana Land Cover Map
- Allen County Indiana Land Cover Map
- Bartholomew County Indiana Land Cover Map
Sources and references
- MRLC Annual NLCD Data – official source for Annual NLCD data
- USGS Annual NLCD Land Cover Classification – land-cover class definitions and dataset guidance
- U.S. Census Bureau TIGER/Line Shapefiles – official county boundary source
- Henry County Comprehensive Plan – county context for New Castle and other municipalities
- Indiana DNR – Summit Lake State Park – official information on Summit Lake, wet meadows, and Zeigler Woods
- Indiana DNR – Wilbur Wright Fish & Wildlife Area – official information on the Big Blue River, Little Blue River valley, woods, and wetlands
Green Map creates custom-edited map images using open geographic data sources such as geoBoundaries, Natural Earth, OpenStreetMap, and government open data.
These maps are edited visual materials, not raw data files, and are provided for education, documents, presentations, and graphic reference.