Grant County is overwhelmingly agricultural in the 2025 land-cover summary, with agriculture covering 75.19% of the county. The map is not visually uniform, however. Marion forms a large developed cluster near the center, while forest and wetland patches follow the Mississinewa River corridor and its tributaries across the farm landscape. The four maps on this page separate those patterns into current land cover, forest and farmland, impervious surface, and mapped class differences between 1985 and 2025.
The WebP images are designed for quick comparison on the page. The four original JPG maps are also available together in one ZIP download, so a reader can use the full land-cover view for general reference, the forest-and-farmland view for rural landscape comparisons, the impervious map for built surfaces, or the change map for a two-date comparison. Each file answers a different question, and reading them as a set helps prevent a developed-land class from being confused with pavement or with historical change.
Table of Contents
A farm-dominated county with one large central developed core
The 2025 county summary places agriculture first at 75.19%. Developed land is the second-largest class at 14.45%, followed by forest at 8.56%, wetlands at 1.10%, and water at 0.43%. Grassland and shrubland are both listed at only 0.03%. Those percentages explain why yellow agricultural cover fills most of the map, but the distribution matters as much as the totals. Developed land does not spread evenly through the county; it forms a strong central concentration and several much smaller settlements within the surrounding field pattern.
Marion accounts for the most obvious red developed area in the middle of the county. Grant County’s official website identifies Marion along with Gas City, Jonesboro, Upland, Fairmount, Van Buren, Matthews, Converse, Sweetser, and Swayzee as communities within the county. The land-cover map does not print those place names or municipal limits, so its red shapes should not be treated as exact city boundaries. Still, the broad pattern is clear: one large urban cluster is surrounded by a county where agriculture remains the dominant surface.
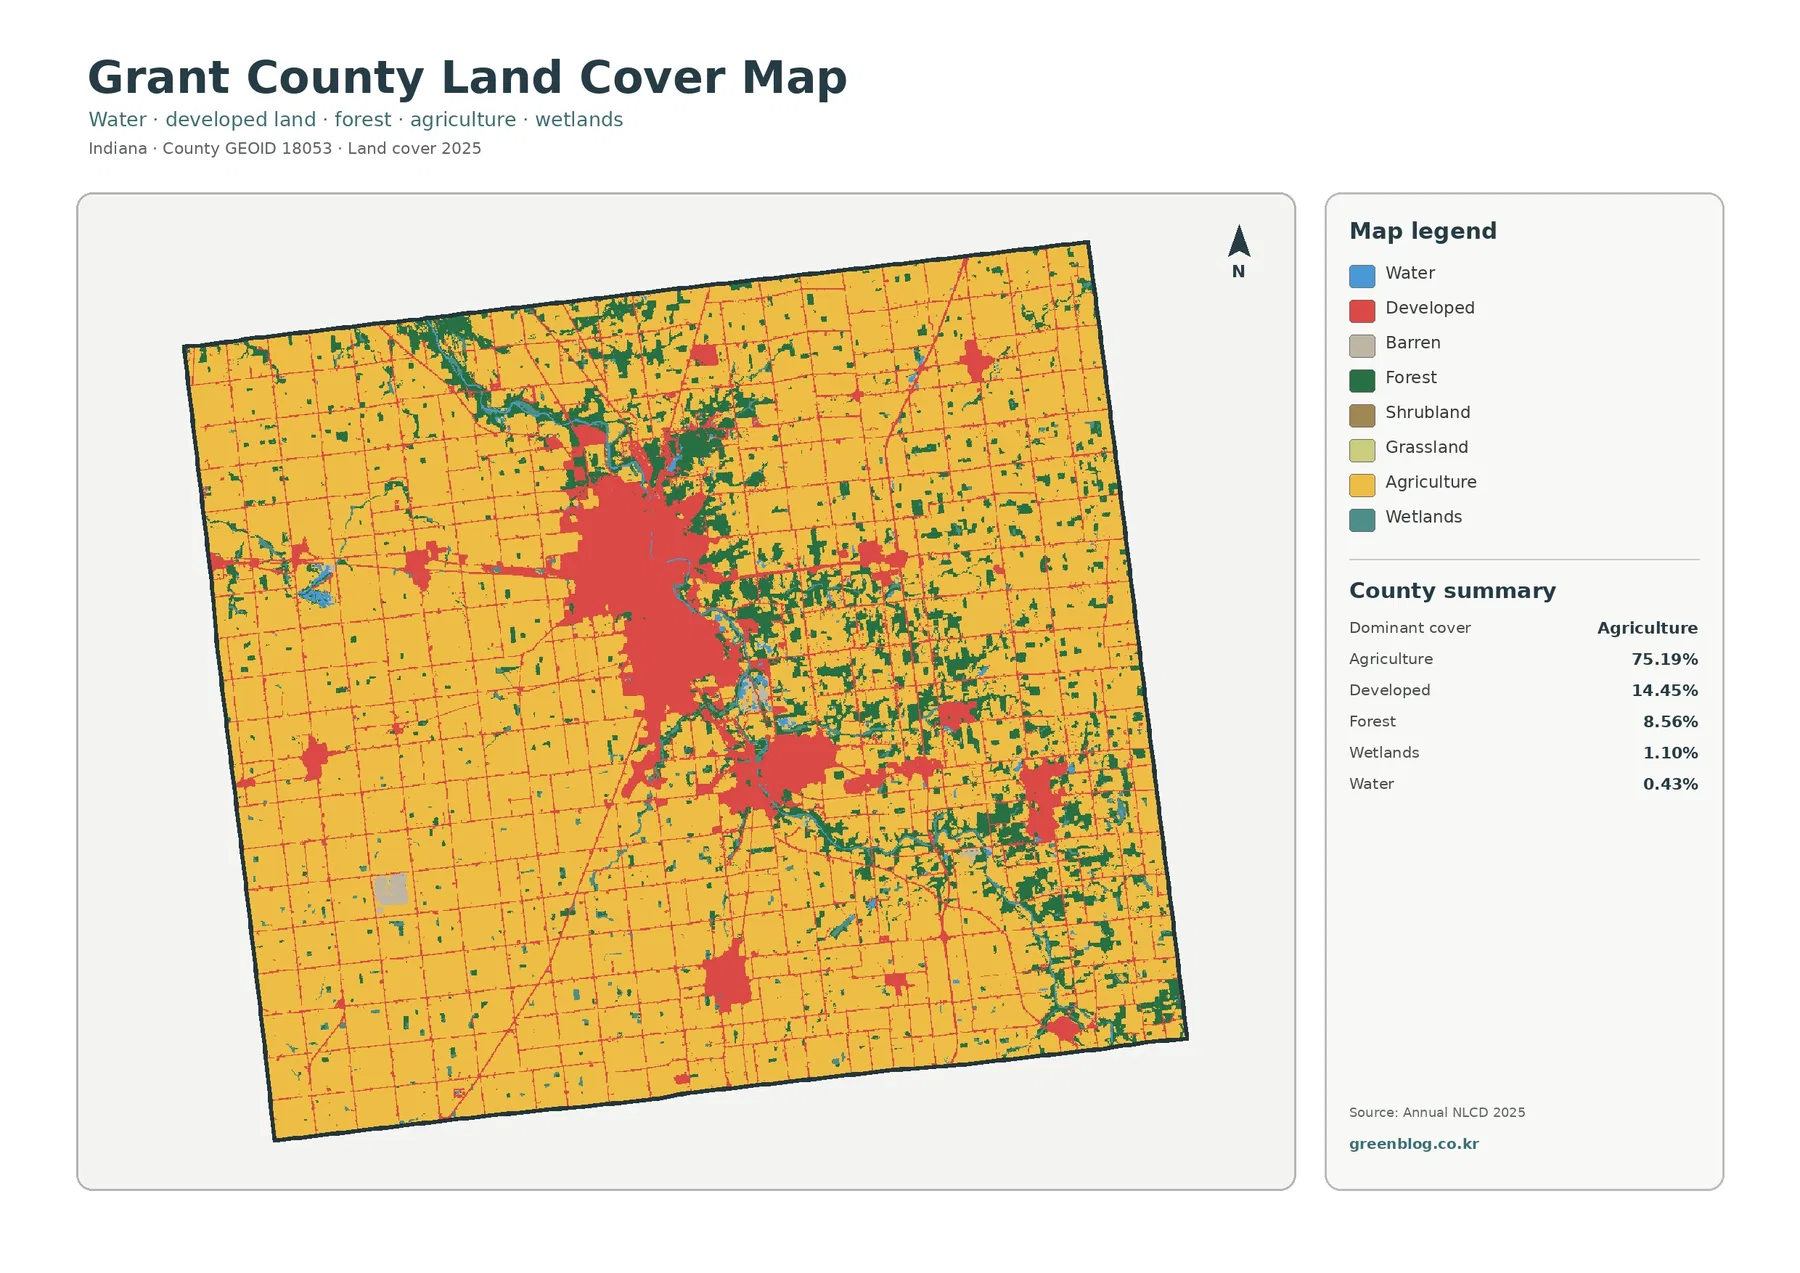
Outside Marion, developed cover appears as smaller red patches and narrow road-linked lines. A cluster southeast of the main city corresponds broadly with the Gas City and Jonesboro area, while other small concentrations appear toward the south, northeast, and western parts of the county. Because the map contains no road labels, it is more useful for comparing the relative size and spacing of developed areas than for identifying a specific street or jurisdiction. The rural grid remains visible between these settlements as narrow developed lines crossing much larger agricultural blocks.
Following the Mississinewa River through forest, wetlands, farms, and towns
Grant County’s 2025 Comprehensive Plan describes the Mississinewa River as flowing generally from the southeast toward the northwest, passing alongside or through Matthews, Upland, Jonesboro, Gas City, and Marion. That local description is useful when reading the land-cover map. A winding belt of forest, wetlands, and small water features follows a similar direction through the otherwise rectilinear farm pattern. The contrast is especially easy to see where green and teal classes bend through yellow fields rather than following the straight edges common in agricultural parcels.
Water itself represents only 0.43% of the county and wetlands 1.10%, so neither category occupies a large share of Grant County. Their locations are still important because they often sit beside forest and close to developed communities. Around Marion and along the southeast-to-northwest river corridor, patches of natural cover come into direct contact with urban and agricultural areas. Farther east and southeast, the green pattern becomes more broken and complex, while large sections of the west and southwest remain visually simpler because cropland dominates.
The river corridor should not be mistaken for a flood-risk map. The county comprehensive plan discusses floodplains along the Mississinewa, but the land-cover image only classifies what covers the ground. Forest, wetlands, water, and development can help a reader understand the setting around a river, yet they do not provide a flood probability, base-flood elevation, drainage capacity, or regulatory boundary. Those questions require FEMA data and local planning or engineering sources. Here, the river is best used as a geographic reference for explaining where natural cover interrupts the agricultural grid.
When development is muted, the forest-and-farmland pattern becomes easier to read
The forest-and-farmland map reduces the visual weight of developed areas and makes the county’s rural pattern easier to compare. Cropland occupies broad blocks across the west, southwest, north, and much of the interior. Forest, which accounts for 8.56% of the county, is more fragmented. It appears in winding strips and irregular patches, with a noticeable concentration along the Mississinewa system and more numerous pieces toward the eastern and southeastern side of the county.
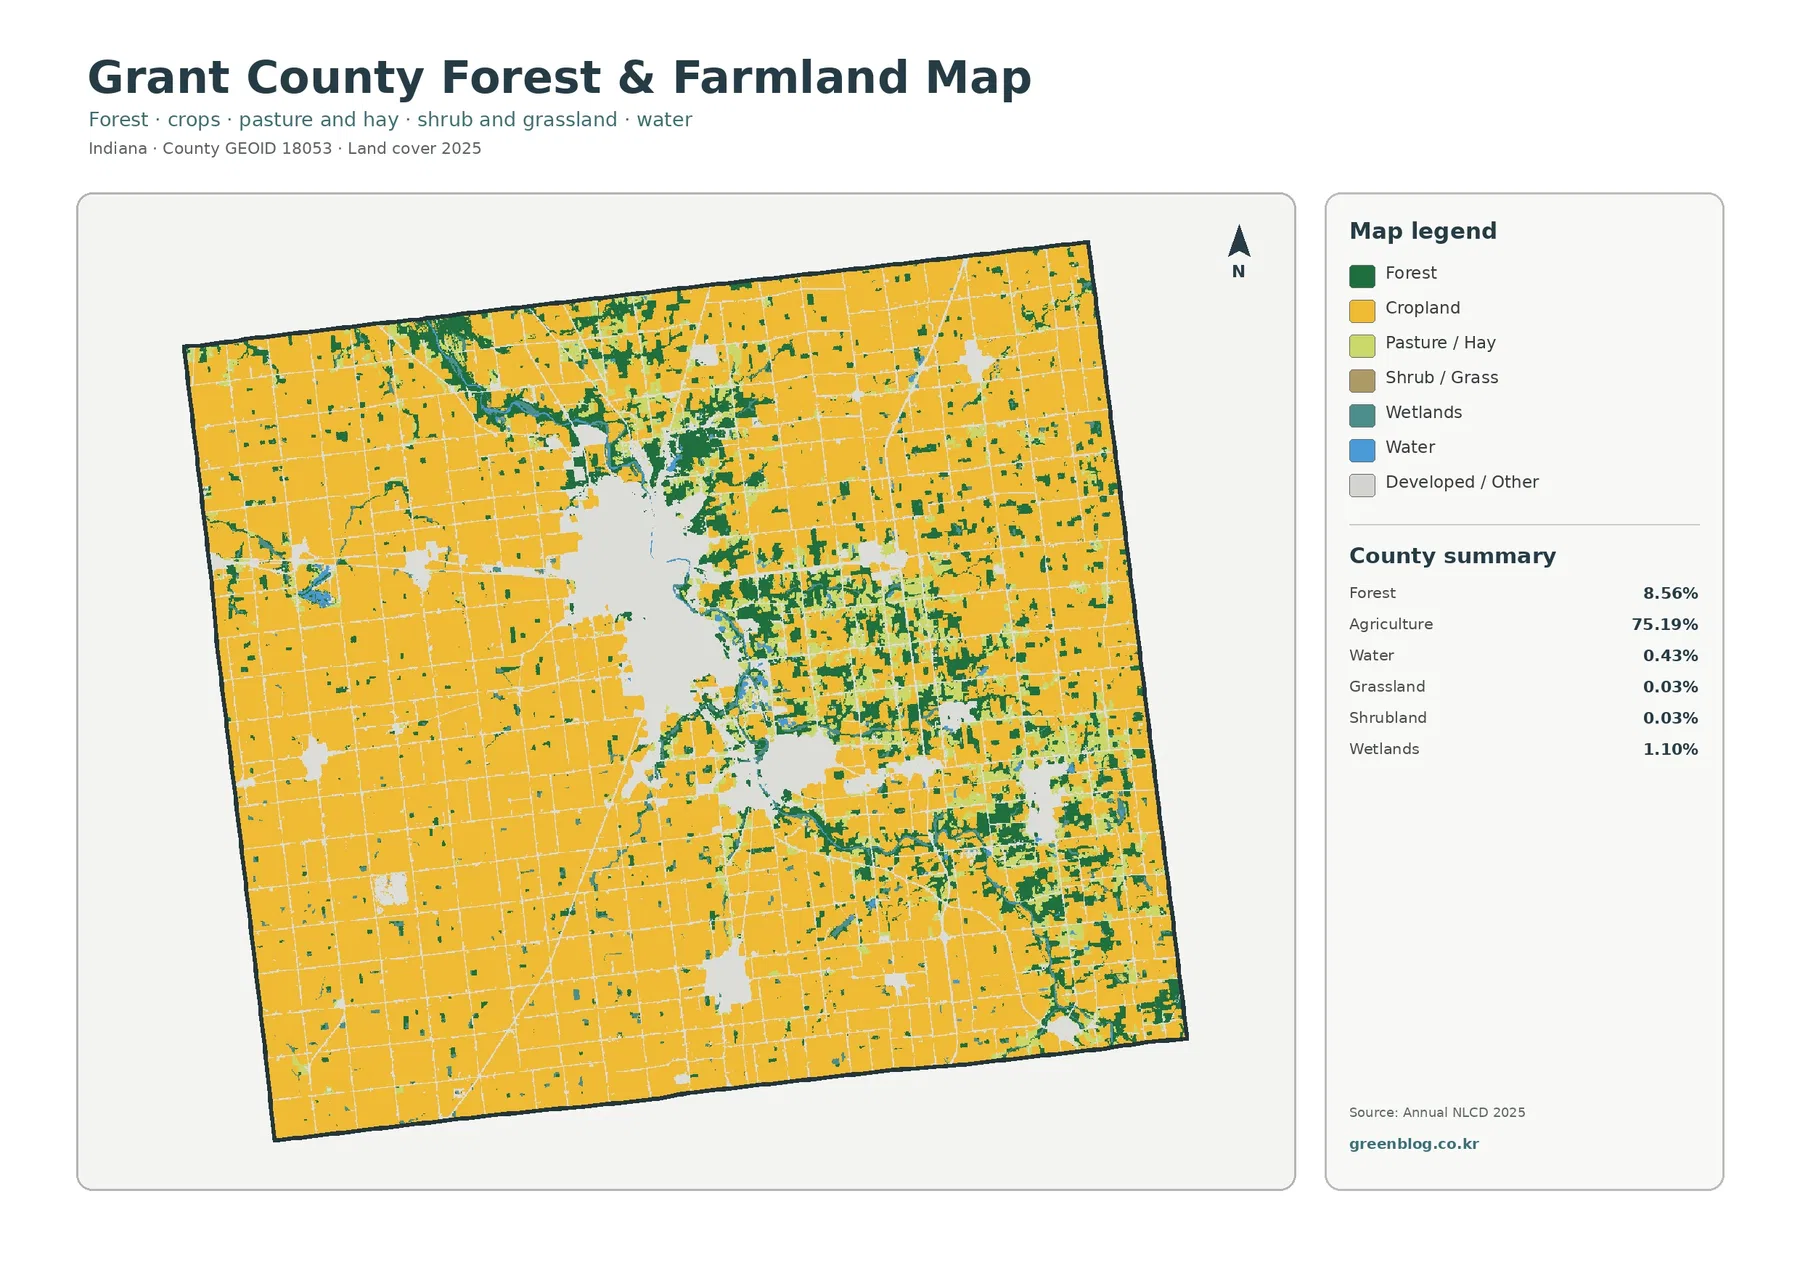
Field areas tend to have straighter edges and a more regular geometry, while forest and wetland features often have curved or branching boundaries. That difference in shape is useful when the map is viewed without place labels. A reader can move from the open-looking farm blocks in the west toward the more broken natural-cover pattern east of Marion and see how quickly the map changes. The pattern does not prove why a particular patch remained forested, but it clearly shows that forest is not evenly distributed across the county.
The legend also separates cropland from pasture or hay and includes shrub or grass, wetlands, water, and developed or other land. The county summary is broader: its 75.19% agriculture value combines the agricultural landscape at a higher reporting level. Small grassland and shrubland shares, both 0.03%, are too limited to define the county visually. They are still worth checking in the legend so that small light-colored or muted areas are not automatically read as cropland or forest.
Land cover is not the same as zoning or ownership. A yellow agricultural pixel does not confirm that a parcel is legally zoned for agriculture, and a forest pixel does not show public ownership or conservation status. Annual NLCD uses satellite-based classification to describe the surface that occupies each raster cell. Parcel lines, easements, development rights, property ownership, and zoning decisions require Grant County GIS or planning records rather than this map.
Impervious surface separates Marion from the rural road grid
Impervious surface measures the share of ground covered by features such as pavement and rooftops, where water does not readily soak into the soil. Grant County has a mean impervious value of 5.17%, and 2.84% of the county is in areas where impervious cover exceeds 50%. Those numbers differ from the 14.45% developed-land share because a developed class can still contain lawns, trees, bare soil, and other surfaces that remain partly permeable.
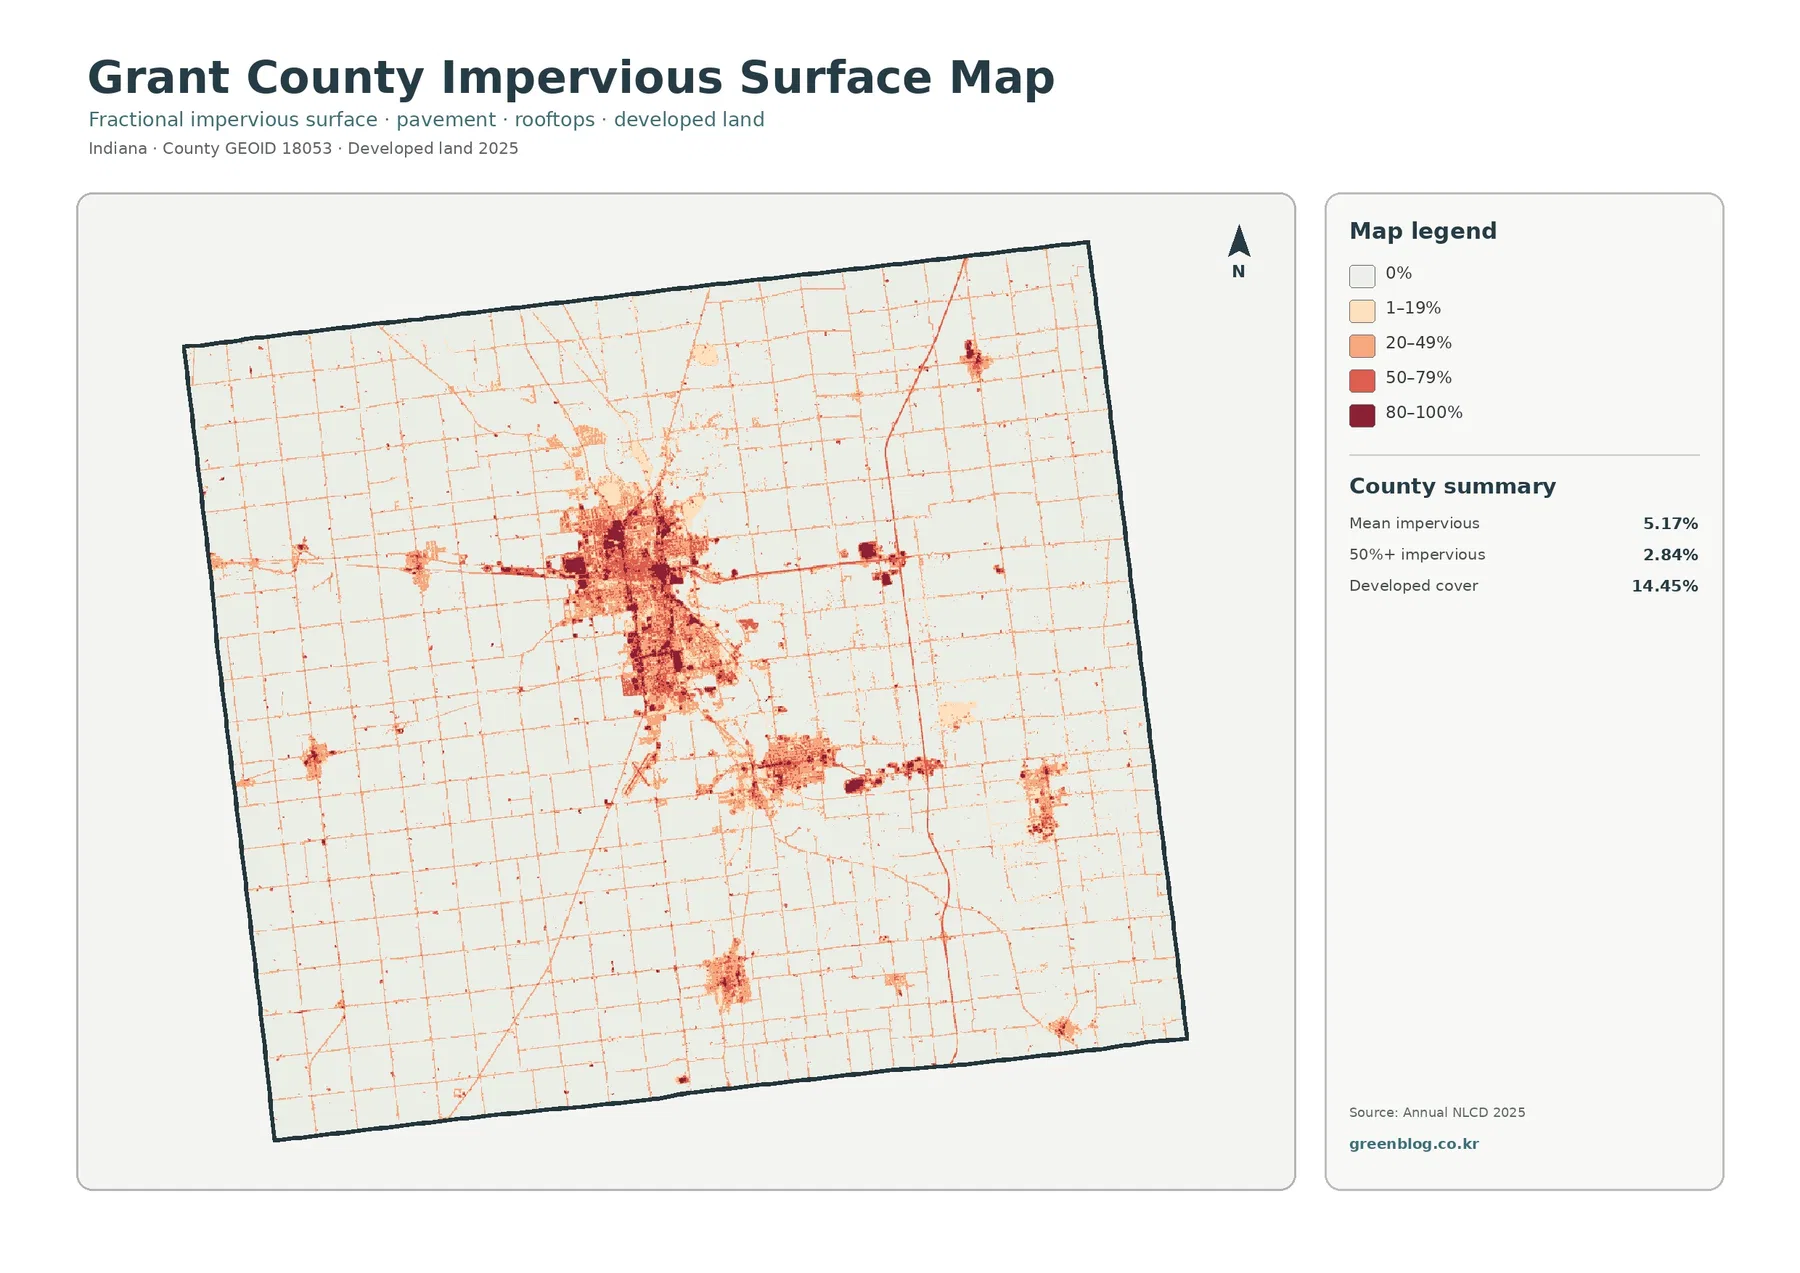
Marion stands out as the largest dark concentration by a wide margin. Near the urban core, higher impervious values form broad blocks rather than isolated road lines. Moving into the countryside, most of the map becomes pale, and roads appear as a thin rectangular network across farm areas. Smaller developed communities produce compact darker patches that are separated from Marion by long stretches of low-impervious agricultural land. This makes the map especially useful for comparing the intensity of built surfaces rather than simply locating developed land.
The southeast corridor is also informative. Built patches continue from Marion toward the Gas City and Jonesboro area, while additional smaller clusters appear farther southeast and south. The map does not label municipal borders, so the safest reading is to compare concentrations and corridors rather than assign every pixel to a named town. A high-value patch says that roofs, pavement, and similar surfaces occupy a large share of the cell; it does not define a legal city limit.
Imperviousness can be relevant to drainage discussions, but this map does not calculate runoff or flood hazard. Soil, slope, stormwater systems, rainfall, river levels, and floodplain position all affect actual water behavior. The Mississinewa corridor passes close to developed areas, including Marion, yet the impervious map alone cannot tell a property owner whether a location will flood. It works best as a countywide view of where built surfaces are dense and where the landscape remains mostly open and permeable.
The 1985–2025 change map is mostly stable, with differences clustered around developed and mixed edges
The mapped class difference between 1985 and 2025 is 7.91%. Within that total, 1.71% is classified as change to developed land, 0.26% as forest loss, 0.82% as agricultural loss, and 5.04% as other class difference. The large “other” share is important because it prevents a simple conclusion that every colored cell represents urban growth. Wetland differences and other category shifts also appear in the legend, and some differences can reflect classification variation along complicated boundaries.
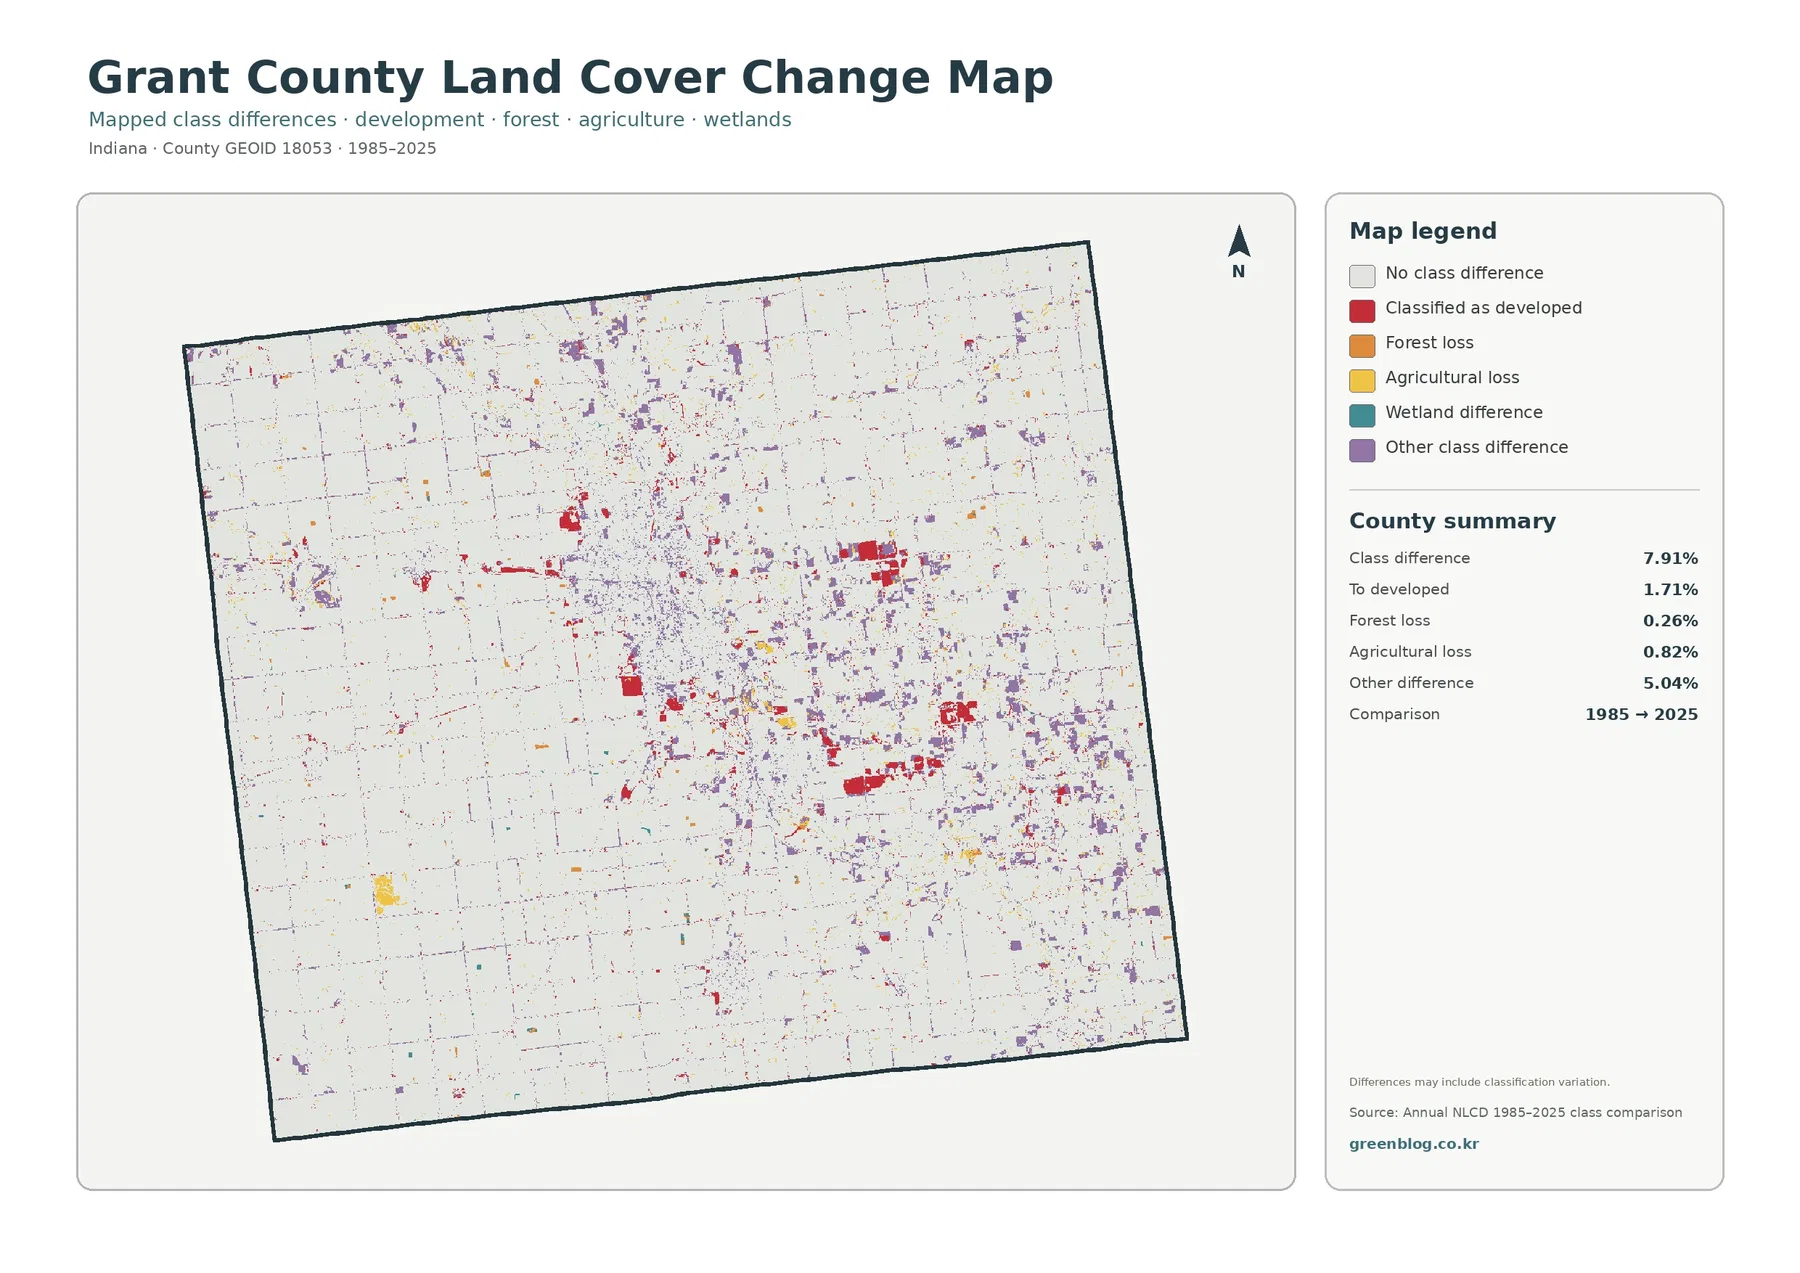
Red change-to-developed cells are easiest to notice in and around Marion, where they form larger pieces than in the surrounding farm country. Smaller red patches also appear near other settlements and along some road-linked development. East and southeast of Marion, purple and other change colors are more numerous where agriculture, forest, wetlands, and development meet in a fragmented pattern. By contrast, broad portions of the west and southwest contain large white areas, meaning the same major class was mapped at both comparison dates.
A colored cell is not a record of a specific construction project or land transaction. Annual land-cover products classify 30-meter raster cells, and a single cell may contain more than one real-world surface. Changes in imagery, mixed pixels, and category boundaries can also influence the comparison. For that reason, 7.91% should be read as the share of cells whose mapped class differs between the two selected years, not as the exact percentage of land that experienced a documented physical conversion.
The most useful way to read the change image is beside the current map. First locate Marion, the river corridor, and the large farm blocks in the 2025 view. Then check where red, orange, yellow, teal, or purple change colors fall relative to those features. That sequence makes it easier to distinguish a current developed area from a cell that changed to developed, and it reduces the temptation to treat every small color patch as a major landscape event.
Frequently Asked Questions
Why does Marion look so prominent if agriculture covers 75.19% of Grant County?
Agriculture occupies far more total area, but it is spread across broad rural parts of the county. Marion’s developed cover is concentrated in one central cluster, so it attracts more visual attention. Developed land totals 14.45%, while the impervious map shows an even smaller high-intensity core where pavement and rooftops are densest.
What is the winding green and teal corridor through Grant County?
Grant County’s comprehensive plan identifies the Mississinewa River as running generally from southeast to northwest through or near Matthews, Upland, Jonesboro, Gas City, and Marion. The land-cover maps show forest, wetlands, and small water features following a similar corridor. The colors describe surface cover, not an exact river, floodplain, or protected-area boundary.
Does the 7.91% class difference mean 7.91% of the county became developed?
No. The 7.91% figure includes several mapped differences between 1985 and 2025. Change to developed land accounts for 1.71%, forest loss 0.26%, agricultural loss 0.82%, and other differences 5.04%. Classification variation and mixed pixels can also affect the comparison, so the change map should not be treated as a parcel-level development history.
Scale, mixed pixels, and questions these maps cannot answer
Annual NLCD is designed for consistent regional and national comparison, not parcel surveying. Its raster cells are approximately 30 meters across. A narrow stream, a roadside tree strip, a small building, and part of a crop field can fall inside the same cell, yet the map must assign that cell a classification or impervious value. Fine boundaries may therefore look blocky or simplified, especially where forest, wetlands, development, and agriculture meet along the Mississinewa system.
The 2025 map is a snapshot of the classification for that year. Construction, clearing, planting, or other changes after the observation period are not represented. Likewise, the 1985–2025 comparison does not provide a year-by-year history. A white cell means the same major class was mapped at the two selected dates; it does not prove that nothing changed during the forty-year interval. A colored cell shows a classification difference but does not identify the cause or exact year of that difference.
Questions about property ownership, zoning, development permission, drainage regulation, or floodplain status require other records. Grant County’s Area Plan materials cover land use, transportation, agriculture, natural resources, and hazard mitigation, while Purdue Extension Grant County provides local agriculture and natural-resources information. These maps are most useful before that detailed research begins: they help a reader identify the parts of the county where farms, urban development, river-linked forest, and mapped change are concentrated.
Map File Information
The ZIP contains four original JPG maps for Grant County: general land cover, forest and farmland, impervious surface and developed land, and 1985–2025 land-cover change.
- Printable Size: 2480 × 1754 px each
- File Type: ZIP containing 4 JPG files
- Intended Use: classes, reports, presentations, county comparisons, and land-cover reference
Related Maps
- Adams County Indiana Land Cover Map
- Allen County Indiana Land Cover Map
- Bartholomew County Indiana Land Cover Map
Sources and References
- MRLC Annual NLCD Data – access to Annual NLCD land-cover products including the 2025 data
- USGS Annual NLCD Land Cover Classification – classification documentation and class descriptions
- U.S. Census Bureau TIGER/Line Shapefiles – official geographic boundary data used for county mapping
- Grant County, Indiana official website – county location and community information
- Grant County Comprehensive Plan 2025 – local information on the Mississinewa River, natural resources, agriculture, and land-use planning
- Purdue Extension – Grant County Agriculture and Natural Resources – local agriculture, forestry, land-use, and natural-resource resources
Green Map creates custom-edited map images using open geographic data sources such as geoBoundaries, Natural Earth, OpenStreetMap, and government open data.
These maps are edited visual materials, not raw data files, and are provided for education, documents, presentations, and graphic reference.