Fayette County is mostly farm country on the supplied 2025 surface classification, but the county is not a uniform field grid. Agriculture accounts for 64.20%, forest for 25.06%, and developed land for 10.00%. The largest built-up concentration sits around Connersville near the north-central part of the county, while wooded cover becomes much more extensive toward the southwest and southern edge. This Fayette County Indiana Land Cover Map is designed to make those contrasts easy to compare without treating land cover as a zoning or parcel map.
The page includes four related views: current land cover, a forest-and-farmland emphasis, impervious surface and developed land, and a 1985–2025 class-difference comparison. The WebP images are useful for quick on-screen reading, while the download box provides the same four maps as original 2480 × 1754-pixel JPG files in one ZIP. A clear way to use the set is to begin with current cover, then add only the map that answers the next question—vegetation, hard surfaces, or endpoint change.
Table of Contents
Connersville stands out as the main hard-surface concentration
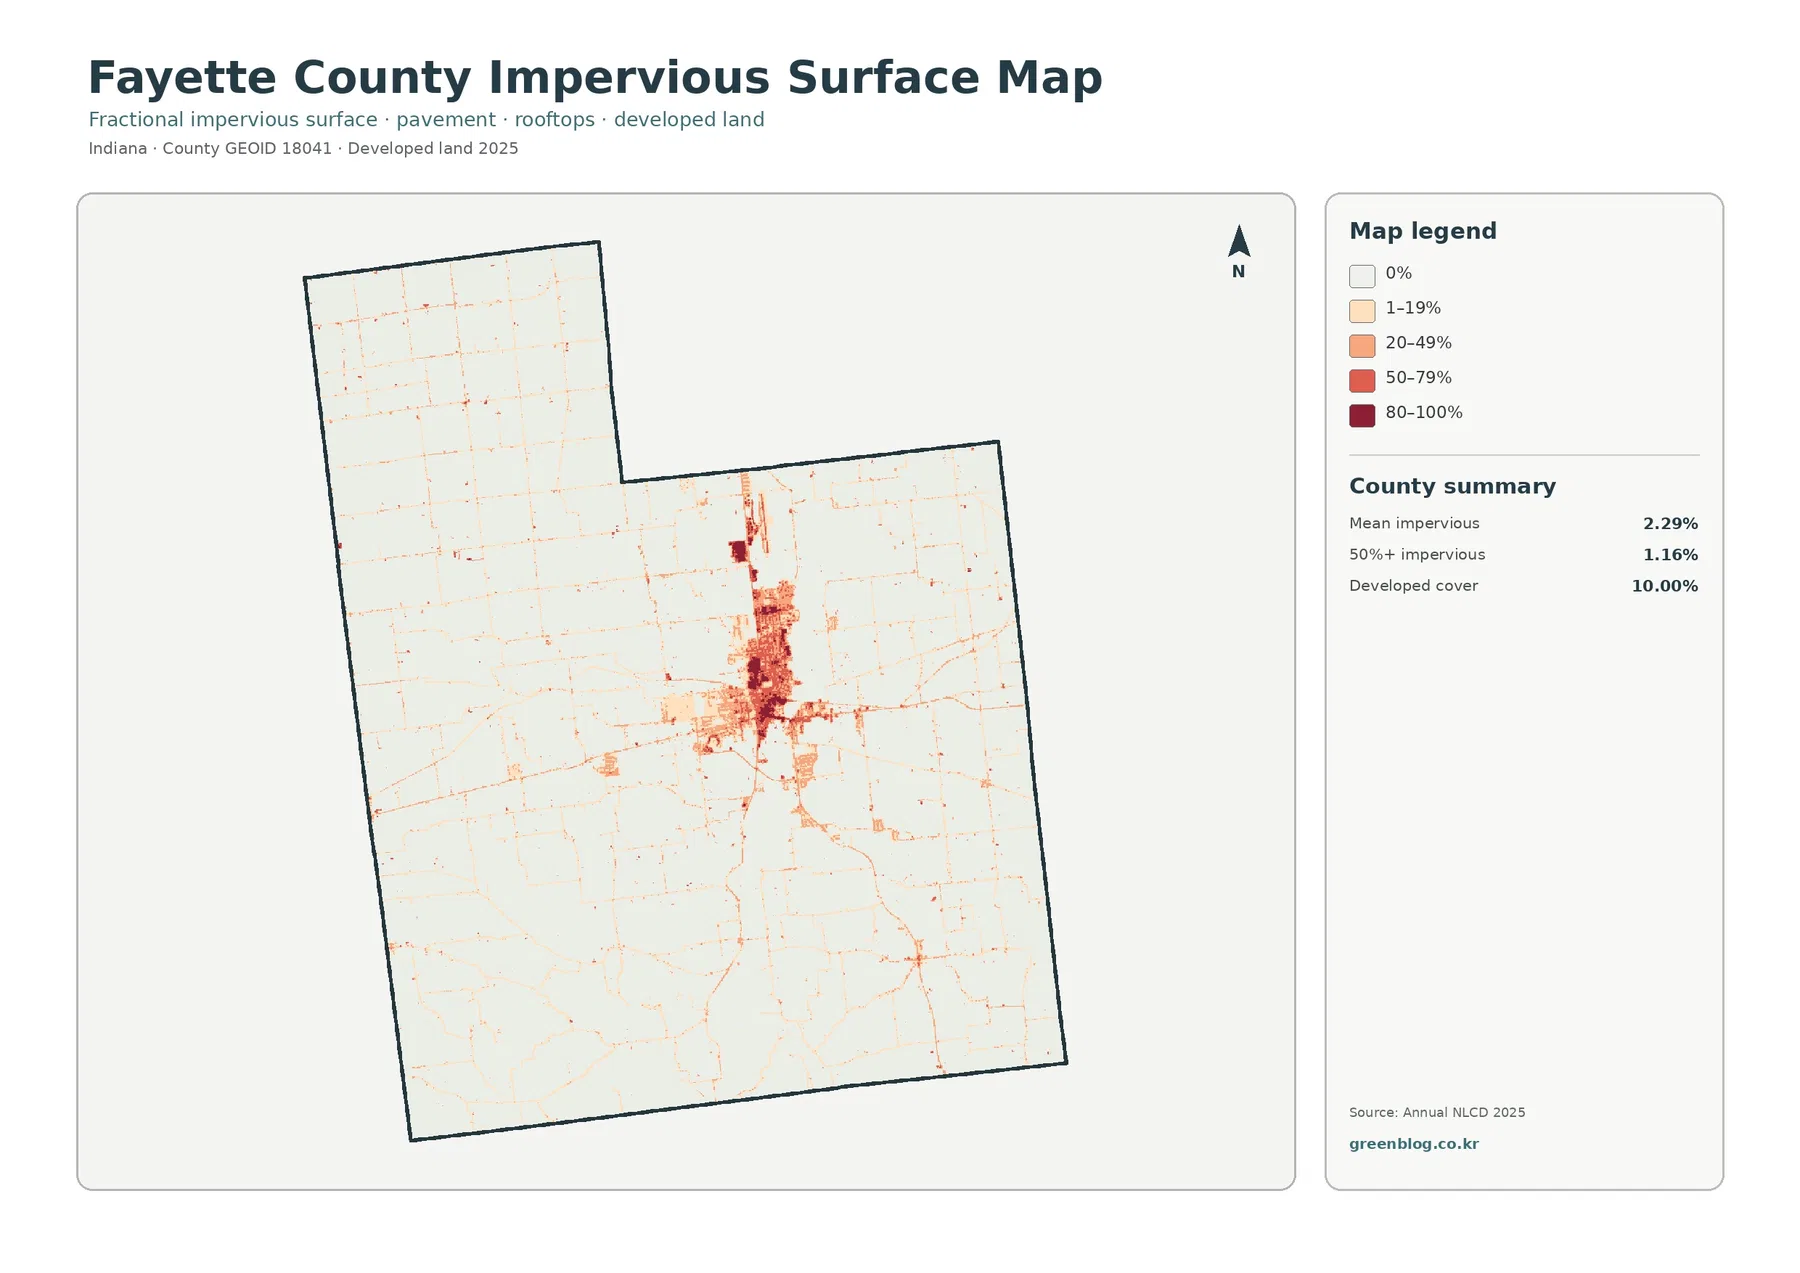
Mean impervious cover is 2.29%, and 1.16% of the county is mapped at 50% impervious or greater. Both values are much lower than the 10.00% developed-land share. That difference is expected because a developed land-cover class can contain grass, trees, bare soil, and other permeable surfaces around buildings and roads. The impervious layer narrows the question to rooftops, pavement, parking areas, and other surfaces that do not readily absorb water.
The darkest values form a compact cluster around Connersville, with a noticeable extension to the north and thinner traces running east, west, and south. Outside that core, most of the county quickly shifts to very low or zero impervious values. Thin lines and scattered dots remain visible across the farm landscape, but the preview does not label roads, subdivisions, or individual facilities. A line that looks like a highway should not be assigned a route number without a separate transportation layer.
A countywide mean can hide that sharp contrast. Dense urban blocks and large rural areas are combined into the same 2.29% average, so the location and continuity of darker cells are more informative when comparing development intensity. The map can support a discussion of runoff or urban surface change, but it does not measure flood risk by itself. Rainfall, soils, drainage, topography, channels, wetlands, and infrastructure would all be needed for a site-specific water question.
The developed and impervious layers also serve different purposes from zoning. A red or dark impervious cell shows what the surface looked like in the classification, not what a local ordinance permits on that land. A residential or business district may contain lawns and trees, while land that is legally eligible for development may still appear as agriculture or forest in the 2025 image. Keeping those concepts separate prevents a common mistake when map colors are compared with planning documents.
Farm blocks dominate the north while woods expand across the south
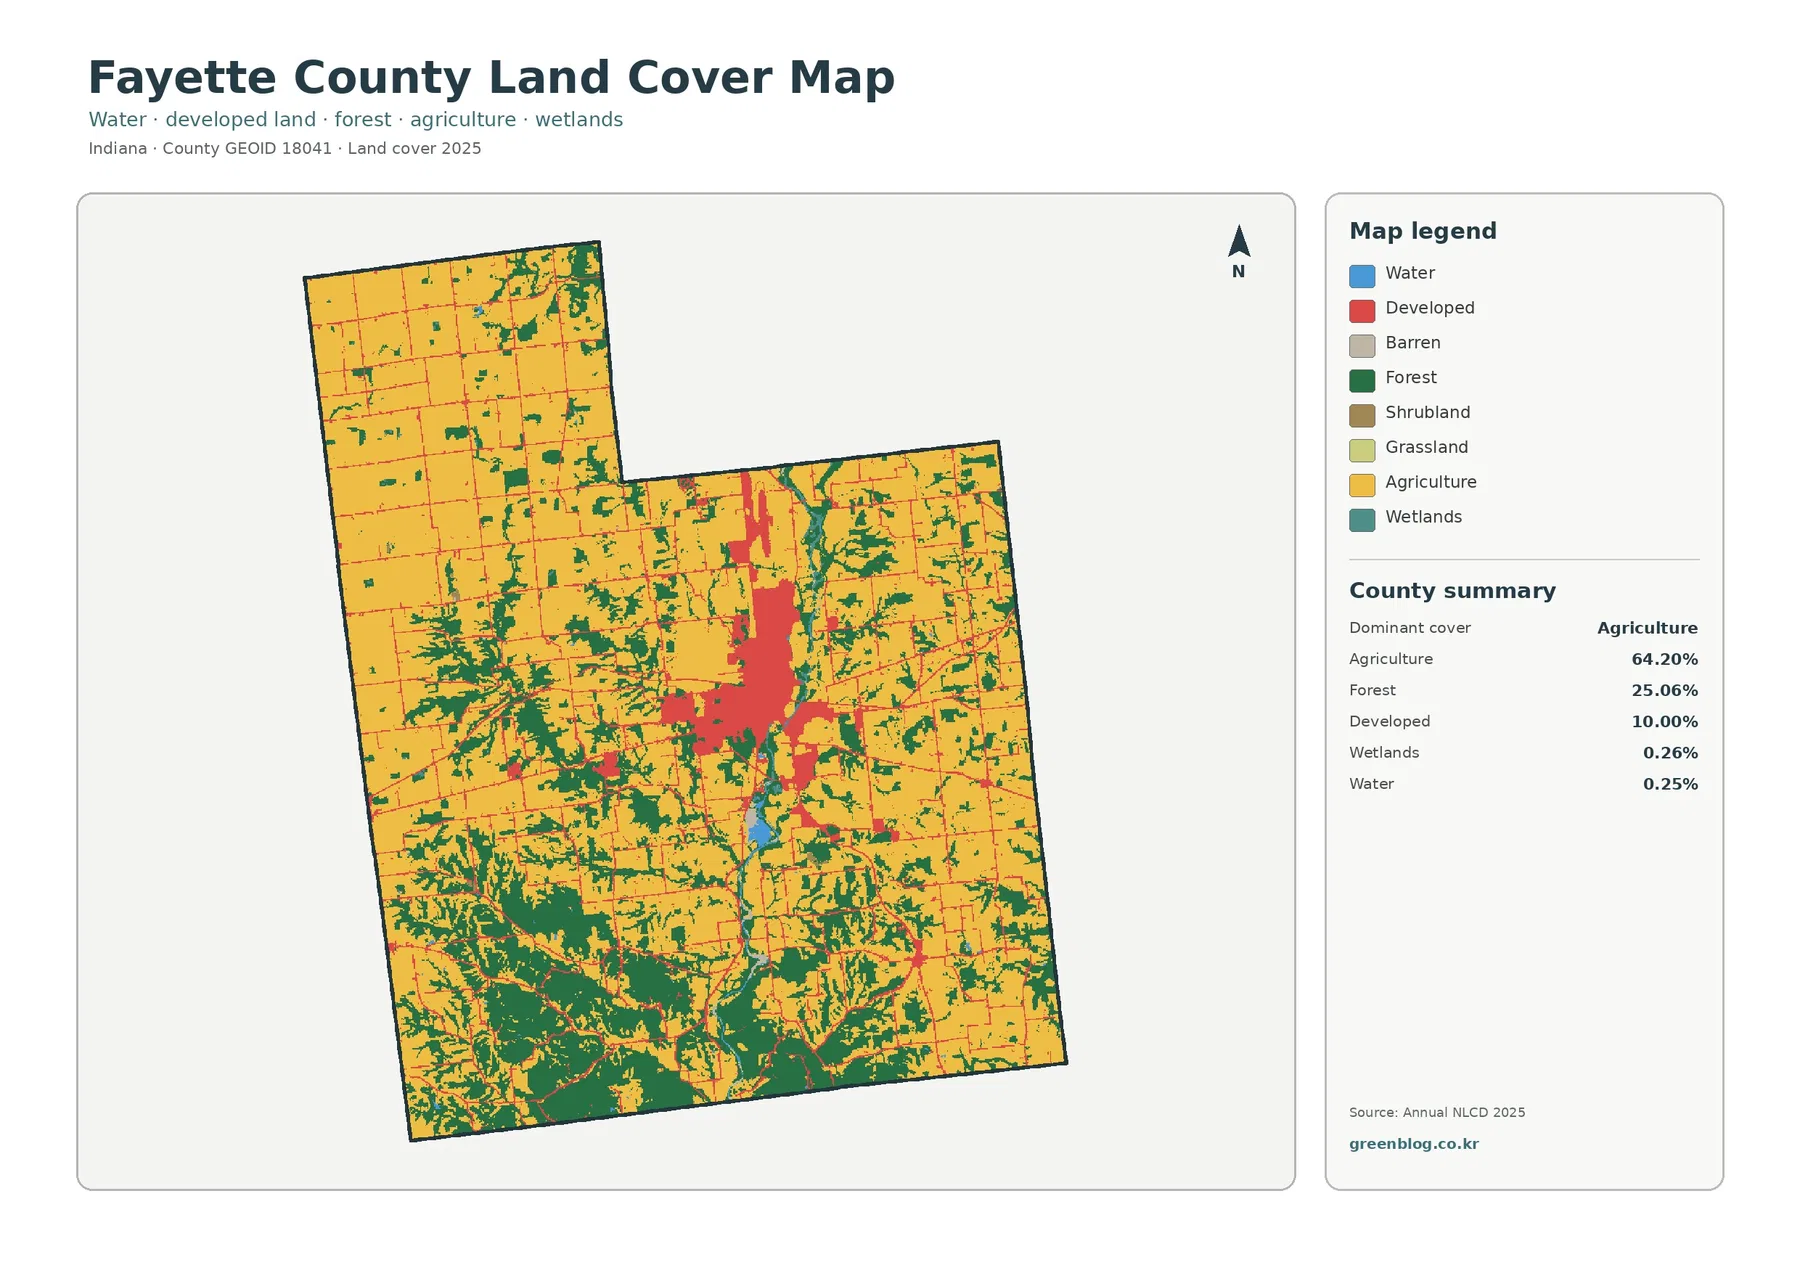
Agriculture is the dominant class at 64.20%, followed by forest at 25.06% and developed land at 10.00%. Wetlands account for 0.26% and open water for 0.25%. The northern projection and much of the northwest are primarily yellow agricultural cover interrupted by relatively small green patches. Moving toward the middle of the county, forest becomes more frequent, and the southern half contains much larger wooded blocks that divide the farm pattern into smaller pieces.
The strongest developed patch overlaps broadly with Connersville, but it is not a clean municipal boundary. Red cells spread beyond a compact center, thin into outward traces, and meet farm or forest at irregular edges. The map contains no city-limit line, street labels, or parcel boundaries, so smaller red areas should not be named as a specific neighborhood or jurisdiction without an administrative map. The value of this layer is the surface pattern rather than the legal geography.
Forest is especially important in the southwest and along much of the southern margin. Large green areas connect with branching strips that reach into agricultural land, and the west-central portion also contains a more complicated mix of woods and fields than the far north. The 25.06% county total therefore does not mean that one quarter of every township or local area is forest. The actual map shows a pronounced north-south difference that is more useful than the average alone.
Land cover describes the observed surface category assigned from imagery and related data. It is not a survey, deed map, zoning layer, crop inventory, or statement that a parcel can be built on. Agricultural color does not identify a crop or a farm operator, and developed color may include landscaped or grassy surfaces. Those limitations matter most around mixed edges, where a 30-meter cell can contain several real-world materials but still receive one predominant class.
The vegetation-focused view makes the southern woodland pattern easier to see
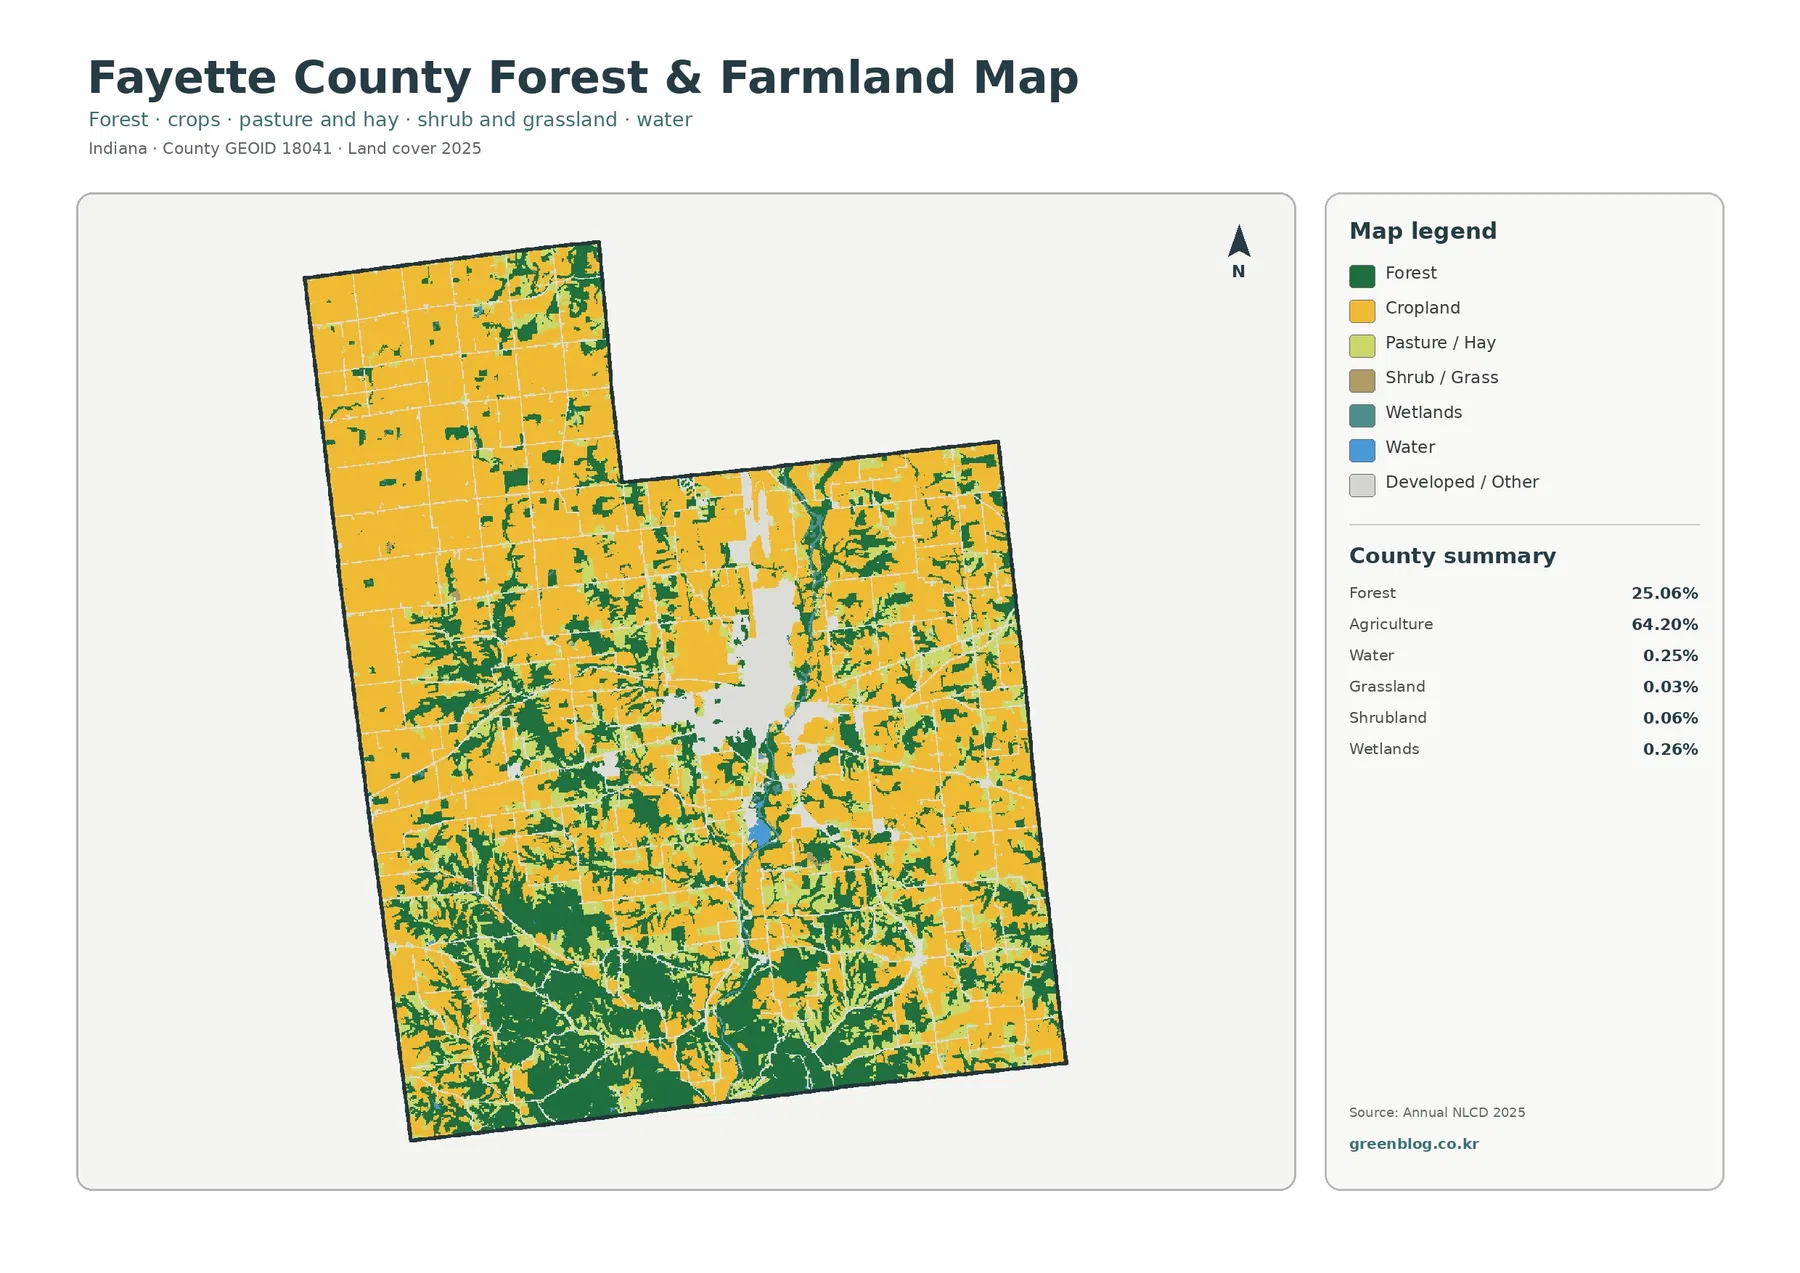
Fading the developed and miscellaneous surfaces brings the agriculture-forest contrast forward. Broad yellow field blocks fill much of the north, while the southwest contains extensive connected woods. In the center and south, the green pattern branches between fields instead of forming a single uninterrupted mass. That structure is useful for explaining why two parts of a county with the same dominant class can still look very different on the ground or in a map-based lesson.
Open water is only 0.25% of the county and wetlands are 0.26%, yet both remain visible in the map. Blue appears along the central watercourse and in a few small features, while teal wetland cells occupy limited areas near water or other low-lying surfaces. Water and wetland colors should not be combined as if they represent the same condition. Open water emphasizes exposed water surfaces, whereas wetlands can include vegetation and saturated ground.
Grassland is listed at 0.03% and shrubland at 0.06%. Those values are too small to describe Fayette County as a grassland or shrubland landscape. They are better treated as minor classes that complete the legend while agriculture and forest carry the main spatial story. A useful presentation order is therefore to discuss the two major covers first, add developed land, and mention the smaller classes only where they help explain a particular edge or local feature.
Purdue Extension Fayette County provides local agriculture and natural-resource education on topics that include agriculture, water, soil, and related issues. That local material can add context to a map dominated by farm cover, but it should not be substituted for the Annual NLCD percentages. The county map summarizes classified surface cover at a broad scale; Extension resources address farm management, soils, natural resources, and local questions with a different purpose and level of detail.
The Whitewater River system provides a useful reference through the developed center
Indiana’s official navigable-waterways roster lists the West Fork of the Whitewater River in Fayette County to the three forks near Connersville. On the supplied land-cover map, a blue water feature passes through the central developed area and continues south through a landscape where woods and agriculture repeatedly meet. The preview does not print stream names, so it is safer to use the state waterway reference for naming the larger system and avoid assigning names to smaller tributaries from appearance alone.
South of the main developed concentration, wooded strips often lie close to the mapped water line, with agricultural cells occupying the surrounding ground. The map supports a statement that water, forest, and farmland occur close together in these areas. It does not establish that one class caused the location of another, nor does it define a floodplain, regulated buffer, or jurisdictional wetland. Those questions require hydrography, elevation, flood, and regulatory sources beyond a land-cover classification.
The small countywide percentages for water and wetlands can therefore be misleading if read without location. They occupy little total area, but a narrow channel can still be an important geographic reference because it crosses several cover types and passes near the principal built-up area. When a class is naturally narrow, percentage and spatial role are not the same thing. Showing the current cover map alongside an official waterway source gives a clearer explanation than simply ranking classes by area.
A 10.58% endpoint difference does not mean 10.58% new development
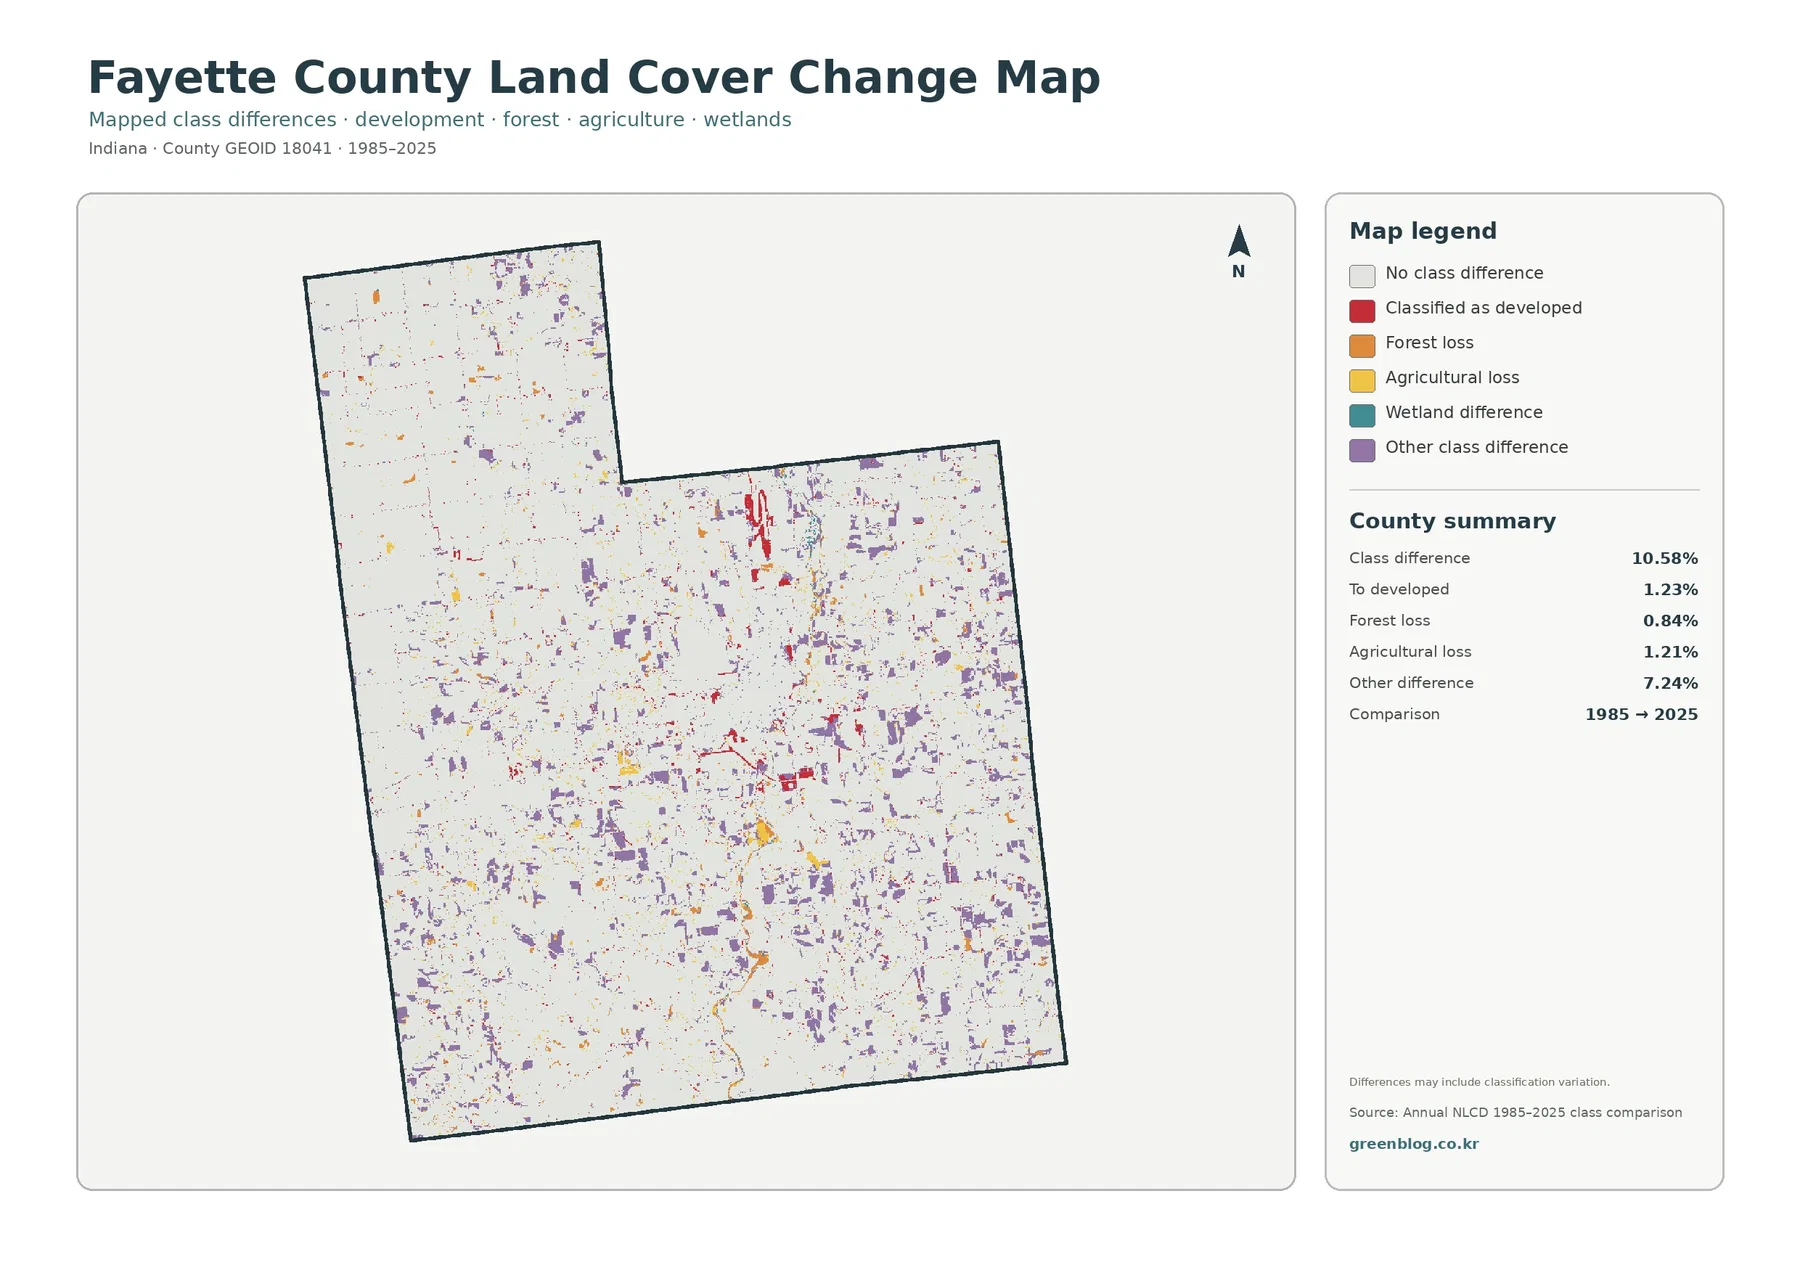
The supplied comparison reports 10.58% total class difference between 1985 and 2025. Its listed components are 1.23% classified as developed, 0.84% forest loss, 1.21% agricultural loss, and 7.24% other class difference. The largest component by far is the broad “other” category. Treating the full 10.58% as urban growth, forest clearing, or farmland loss would therefore turn a multi-category endpoint comparison into a claim the map does not support.
Red developed-conversion cells are most noticeable around the Connersville area and along a few outward traces. Orange forest-loss and yellow agricultural-loss cells are more scattered, while purple other-difference cells appear widely across the county. The legend also includes wetland difference but does not provide a separate percentage for it in the summary. A residual value should not be calculated and presented as though it were an official wetland-change statistic.
“Forest loss” and “agricultural loss” identify a change in the endpoint class, not a verified cause. A cell classified as forest in 1985 and something else in 2025 does not by itself prove logging, construction, storm damage, farming, or classification error. The same caution applies to agricultural loss. Determining when and why a location changed would require intermediate imagery, aerial photography, local records, permits, or field evidence.
The change layer is most useful after the 2025 map has already established the current surface. A current developed cell and a developed-conversion cell answer different questions, just as current forest cover and forest-loss pixels are not interchangeable. Comparing the same location across the two maps helps prevent change colors from being mistaken for present-day cover and keeps the 1985–2025 image in its proper role as an endpoint screening tool.
Thirty-meter cells are broad enough to simplify field, road, and stream edges
Annual NLCD uses 30-meter square cells. Each cell receives a predominant land-cover class even when a field edge, tree line, ditch, road, lawn, and building share the same area. That generalization is especially relevant around the edge of Connersville, along narrow waterways, and where branching woods enter farm blocks. Zooming makes the squares larger on screen, but it does not create parcel detail that was not part of the source classification.
Fayette County and the City of Connersville also have an Area Zoning Code with agricultural, residential, business, industrial, and flood-plain districts. Those legal categories answer a different question from land cover. A parcel may be zoned for one use while its observed 2025 surface appears as forest, agriculture, lawn, or developed cover. Likewise, a red land-cover cell is not a statement that development is permitted there. Planning and surface classification should be compared, not merged.
The 2025 map is also a snapshot of the supplied observation year. Construction, harvest, vegetation recovery, timber activity, standing water, or other later changes may not appear. For a current parcel, permit, wetland, or engineering decision, recent aerial imagery and the appropriate local or state records should take priority. These maps are strongest when used for countywide patterns, classroom comparison, presentations, and early screening rather than site-level legal or design decisions.
Use the four JPGs as a sequence, not as four copies of the same message
For a general county profile, begin with the 2025 land-cover overview because it puts agriculture, forest, development, water, and wetlands on the same page. If the question is about working land and woodland, follow with the forest-and-farmland view. If the question concerns roofs, pavement, or the concentration of the Connersville built area, the impervious map is the better second image. Save the endpoint-change layer for a later comparison after readers understand current cover.
Each JPG measures 2480 × 1754 pixels. That size works well for documents, slides, teaching material, and many normal print uses. The package does not label the files as meeting an A3 high-resolution reference, so a large poster should be test-printed before relying on fine labels or thin lines. The files are not survey plats, parcel maps, official wetland determinations, flood-insurance maps, road-design plans, or construction documents.
Using only the maps that support the question also reduces repetition. A farm-and-forest lesson may need only the overview plus the vegetation-focused map. A development discussion can pair the overview with impervious surface. A historical comparison works best with the current map beside the 1985–2025 difference layer. That approach lets each image contribute new information and makes the download set easier to use in a report or presentation.
Frequently Asked Questions
Is Fayette County mainly agricultural or mainly forested?
Agriculture is the largest 2025 class at 64.20%, while forest covers 25.06%. The map is not uniform, however. Large farm blocks dominate much of the north, while the southwest and southern part of the county contain much more connected woodland. The clearest description is an agricultural county with a distinctly more wooded southern landscape.
Why is developed cover 10.00% when mean impervious cover is only 2.29%?
Developed land-cover classes can include lawns, trees, bare ground, and other permeable surfaces around buildings and roads. Impervious cover isolates rooftops, pavement, parking areas, and similar hard surfaces. The highest values are concentrated around Connersville, while the large rural part of the county remains mostly low, which pulls the countywide mean down.
Does the 10.58% 1985–2025 class difference mean that much land was newly developed?
No. Only 1.23% is listed as classified to developed. Forest loss is 0.84%, agricultural loss is 1.21%, and other class difference is 7.24%. The 10.58% total combines several endpoint-class differences, so it cannot be used as a direct measure of urban growth, damage, or land degradation.
Sources and Reference Data
- MRLC Annual NLCD Data – official access point for current and annual land-cover products
- USGS Annual NLCD Land Cover Classification – definitions and guidance for agriculture, forest, developed land, wetlands, water, and related classes
- U.S. Census Bureau TIGER/Line Shapefiles – official county-boundary reference for Fayette County
- Purdue Extension Fayette County – Ag & Natural Resources – local agriculture, water, soil, and natural-resource education and information
- Indiana NRC – Navigable Waterways Roster by County – official reference listing the West Fork of the Whitewater River in Fayette County
- Fayette County and Connersville Area Zoning Code – legal zoning context that should be kept separate from observed land cover
Map File Information
The ZIP contains four original JPG maps for comparing Fayette County agriculture, southern woods, Connersville-area developed and impervious surfaces, and 1985–2025 class differences.
- Included Files: Use only the versions confirmed in the article and supplied images
- File Type: Use the confirmed download contents
- Intended Use: Printing, education, presentations, and map-based projects
Related Maps
- Adams County Indiana Land Cover Map
- Allen County Indiana Land Cover Map
- Bartholomew County Indiana Land Cover Map
Green Map creates custom-edited map images using open geographic data sources such as geoBoundaries, Natural Earth, OpenStreetMap, and government open data.
These maps are edited visual materials, not raw data files, and are provided for education, documents, presentations, and graphic reference.