The 2023 global population density map compares how many people live, on average, on each square kilometer of land across World Bank countries and separately reported economies. The comparison uses World Development Indicators series EN.POP.DNST and keeps one common year. After regional and income-group aggregates are excluded, the master set contains 217 country/economy rows; 215 have a numeric 2023 observation, while the Channel Islands and Kosovo remain source-missing.
The country distribution is highly uneven. The median is 95.3 people per sq. km of land area, but the simple unweighted mean rises to 453.6. That large gap is driven by a small number of exceptionally dense observations, including Macao SAR at 20,569.7 and Monaco at 18,692.9. A map that uses a linear color scale would compress most countries into a narrow range, so the visual uses a logarithmic legend while preserving the original values in the tables and calculations.
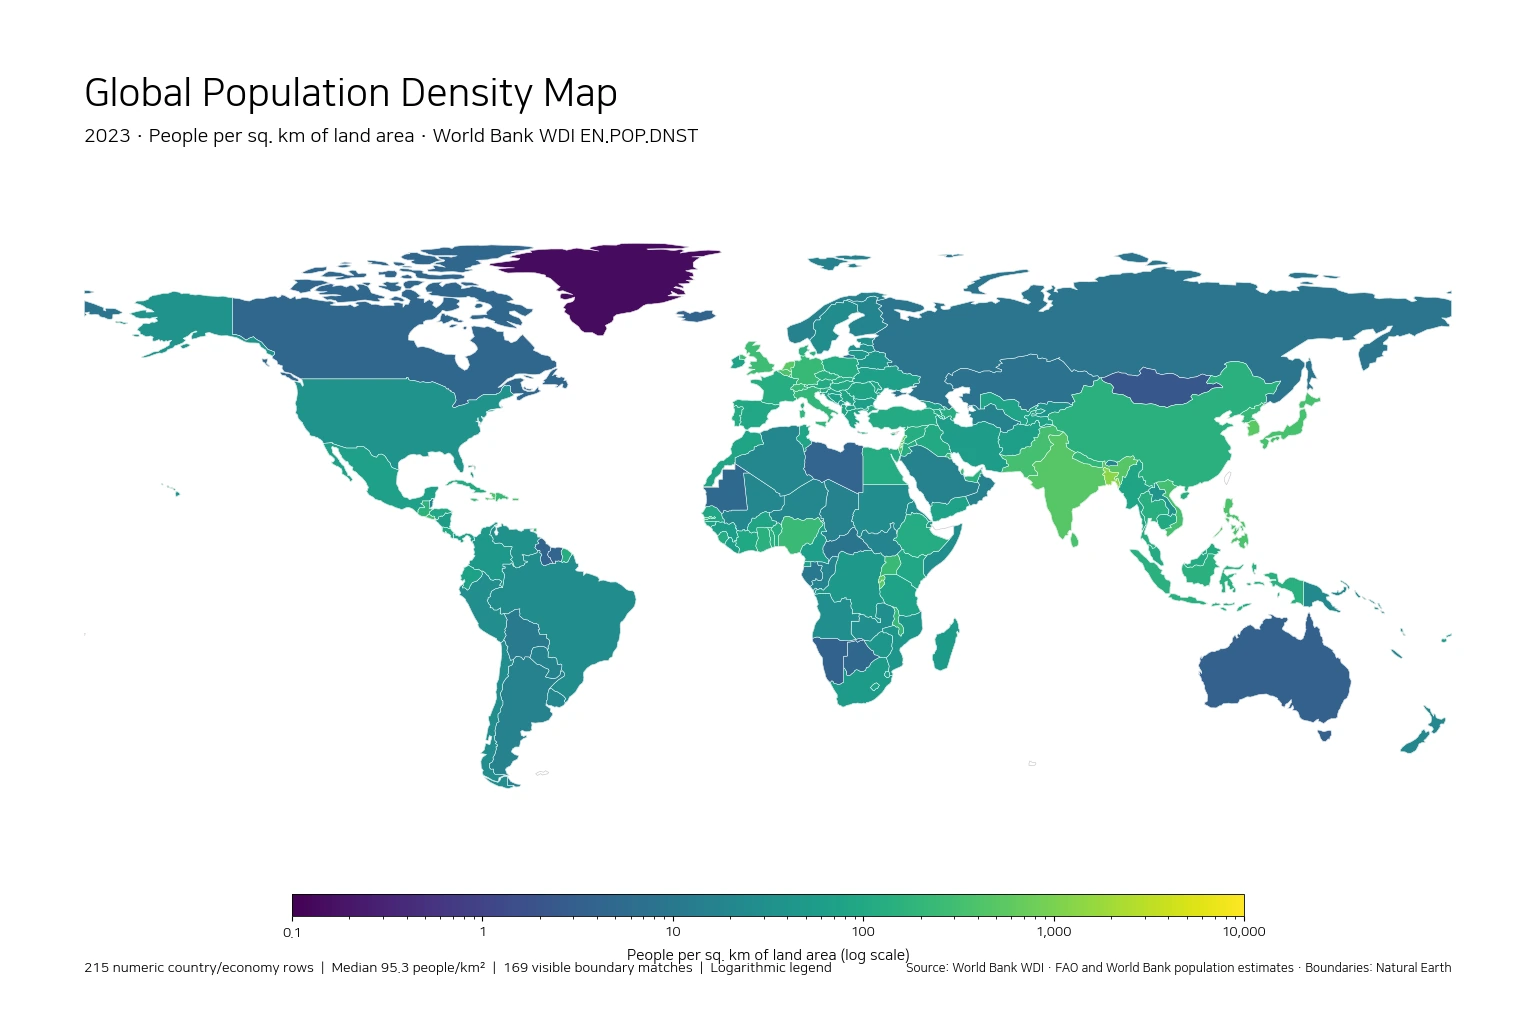
Table of Contents
How the World Bank defines population density
World Bank series EN.POP.DNST is titled Population density (people per sq. km of land area). The indicator is calculated as midyear population divided by land area in square kilometers. The population concept is de facto residence: residents are counted regardless of legal status or citizenship, with refugees who are not permanently settled in the country of asylum generally treated as part of their country of origin.
The denominator is land area rather than a country’s total maritime or surface area. The WDI metadata excludes inland water bodies, national claims to the continental shelf, and exclusive economic zones from the land-area measure. That distinction matters for international comparisons, but it also means this is still a national average. It is not a measure of built-up land, habitable land, city density, or the density of the places where most residents actually live.
The 2023 distribution is strongly right-skewed
The first quartile of the 215 numeric observations is 39.8 people per sq. km, the median is 95.3, and the third quartile is 241.6. In other words, the middle half of country/economy observations falls between roughly 39.8 and 241.6. The mean of 453.6 is far above that range because the upper tail extends into the thousands and, for two observations, close to twenty thousand people per sq. km.
| 2023 density band (people/km²) | Countries/economies | Share of 215 |
|---|---|---|
| 0–<10 | 15 | 7.0% |
| 10–<25 | 20 | 9.3% |
| 25–<50 | 29 | 13.5% |
| 50–<100 | 49 | 22.8% |
| 100–<250 | 50 | 23.3% |
| 250–<500 | 29 | 13.5% |
| 500–<1,000 | 12 | 5.6% |
| 1,000–<2,000 | 6 | 2.8% |
| 2,000+ | 5 | 2.3% |
There are 113 observations below 100 people per sq. km, slightly more than half of the numeric sample. Fifty fall between 100 and 250, and 29 between 250 and 500. Only 11 observations are at or above 1,000 people per sq. km. Five exceed 2,000: Macao SAR, Monaco, Singapore, Hong Kong SAR, and Gibraltar. Those few economies occupy the far end of the distribution and explain why the mean is not a good description of the typical country observation.
Very high-density economies dominate the top of the ranking
| Highest 2023 country/economy observations | People per sq. km |
|---|---|
| Macao SAR, China | 20,569.7 |
| Monaco | 18,692.9 |
| Singapore | 8,241.8 |
| Hong Kong SAR, China | 7,177.2 |
| Gibraltar | 3,847.1 |
| Bahrain | 1,971.3 |
| Maldives | 1,765.1 |
| Malta | 1,727.3 |
| Bangladesh | 1,319.2 |
| Sint Maarten (Dutch part) | 1,257.3 |
Macao SAR and Monaco are both close to 20,000 people per sq. km, while Singapore and Hong Kong SAR are above 7,000. Gibraltar is about 3,847 and Bahrain about 1,971. The table intentionally says “countries/economies” rather than “sovereign countries,” because the World Bank geography master includes separately reported territories and special administrative areas alongside states.
Bangladesh is also in the top ten at about 1,319 people per sq. km. That helps show why the ranking should not be reduced to a story about microstates alone. Even so, national density does not directly measure crowding, housing conditions, or how evenly people are distributed within the boundary. A national average can combine very dense metropolitan areas with much less populated rural or peripheral areas.
Large economies occupy very different density bands
| Selected economy | 2023 people per sq. km |
|---|---|
| United States | 36.8 |
| China | 150.3 |
| India | 483.7 |
| Japan | 341.5 |
| Korea, Rep. | 529.8 |
| Germany | 238.4 |
| France | 126.9 |
| United Kingdom | 283.2 |
| Brazil | 25.3 |
| Mexico | 66.7 |
| Canada | 4.6 |
| Indonesia | 148.6 |
| Nigeria | 250.2 |
| South Africa | 52.1 |
| Australia | 3.5 |
| Bangladesh | 1,319.2 |
| Netherlands | 531.0 |
| Russian Federation | 8.8 |
| Egypt, Arab Rep. | 115.1 |
| Ethiopia | 114.0 |
| Pakistan | 321.1 |
Among the selected economies, South Korea is about 529.8 people per sq. km, India 483.7, Japan 341.5, the United Kingdom 283.2, and Nigeria 250.2. Germany is 238.4, China 150.3, Indonesia 148.6, and France 126.9. These values show why population size and population density answer different questions: a very populous country can be moderately or highly dense, while a large economy with a broad land base can have a much lower national average.
The United States is about 36.8 people per sq. km and Brazil 25.3. Canada falls to 4.56 and Australia to 3.47. Those gaps are large enough to be visible even on a coarse world map. They should not, however, be read as direct measures of urban form or settlement quality. A country with a low national density can still contain very dense cities, and a high-density country can still have substantial internal variation.
Sparse national averages fall below 10 people per sq. km
| Lowest 2023 country/economy observations | People per sq. km |
|---|---|
| Greenland | 0.14 |
| Mongolia | 2.23 |
| Australia | 3.47 |
| Namibia | 3.60 |
| Iceland | 3.82 |
| Guyana | 3.91 |
| Suriname | 3.92 |
| Libya | 4.15 |
| Botswana | 4.38 |
| Canada | 4.56 |
| Mauritania | 4.87 |
| Kazakhstan | 7.53 |
| Central African Republic | 8.27 |
| Russian Federation | 8.78 |
| Gabon | 9.64 |
Greenland has the lowest observation in the file at about 0.14 people per sq. km. Mongolia is 2.23, Australia 3.47, Namibia 3.60, Iceland 3.82, Guyana 3.91, Suriname 3.92, and Canada 4.56. Fifteen observations are below 10 people per sq. km. These values describe the ratio of national population to national land area; they do not mean residents are spread evenly at those densities across every part of the territory.
That distinction is especially important when the map is used for planning or classroom comparisons. The national ratio is useful for finding broad contrasts, but questions about metropolitan concentration, rural settlement, service coverage, transport demand, or local land pressure require a smaller geographic unit such as provinces, counties, municipalities, census tracts, or population grids.
What a country-average density map can and cannot tell you
Population density compresses two basic quantities—population and land area—into a comparable ratio, which makes it effective for a first-pass global map. Neighboring countries can be compared quickly, broad high- and low-density zones become visible, and unusual outliers are easy to identify. The map is therefore useful for asking where more detailed demographic or land-use research may be worthwhile.
The indicator does not identify the cause of a high or low density. It does not contain urbanization, terrain, housing, migration, transport, income, or land-use variables, so geographic clustering should not be converted into a causal explanation. High density is not automatically evidence of overpopulation or poor living conditions, and low density is not automatically evidence of abundant usable land. Those are different questions that need additional, aligned datasets.
Missing statistics and missing map polygons are different
The statistical sample contains 215 numeric observations, while 169 polygons in the low-resolution Natural Earth layer can be directly filled with a 2023 value. Several valid World Bank economies are too small or are not represented as separate polygons at this scale. Macao SAR, Hong Kong SAR, Singapore, and various island economies can therefore be present in the rankings even when they are difficult or impossible to see as a separate colored area on the map.
The two source-missing rows are handled separately. The Channel Islands and Kosovo are not converted to zero and are not filled with an older observation. Means, medians, rankings, quartiles, and density-band counts all use only the 215 numeric rows. Keeping the statistical sample separate from the cartographic geometry prevents map simplification from silently changing the calculations.
Data source and mapping method
The values follow the official World Bank World Development Indicators metadata for EN.POP.DNST. The World Bank identifies FAO population estimates and World Bank population estimates as the sources, reports the unit as people per square kilometer of land area, and describes the series as annual. This comparison uses only 2023 observations rather than mixing each economy’s latest available year.
Regional, income-group, and other aggregate rows are excluded from the country ranking. World Bank, OECD, regional, and income aggregates answer a different statistical question and should not sit beside individual economies in the same league table. Separately reported countries, economies, and territories are retained, so the 217-row master is not intended to represent a sovereign-state count.
Frequently Asked Questions
Does the indicator use total area or land area?
Land area. World Bank EN.POP.DNST divides midyear population by land area in square kilometers, excluding inland water bodies, continental-shelf claims, and exclusive economic zones from the land-area denominator.
Is the 453.6 people/km² mean the population density of the world?
No. It is the simple unweighted mean across the 215 numeric country/economy observations in this 2023 comparison. A world population-to-world-land-area ratio is a different statistic.
Why can an economy appear in the ranking but not on the map?
Some separately reported economies and small islands have valid World Bank observations but no distinct visible polygon in the low-resolution world boundary layer. The statistical tables keep those observations.
Are missing 2023 values treated as zero?
No. The Channel Islands and Kosovo remain NA and are excluded from rankings and summary statistics. Older observations are not used to fill the 2023 snapshot.
Related Articles
- Global Population Growth Map – Country Patterns in 2025
- Global Electricity Access Map – 2024 Population Access by Country
- Global Internet Use Map – 2024 Country Comparison
Green Map creates custom-edited map images using open geographic data sources such as geoBoundaries, Natural Earth, OpenStreetMap, and government open data.
These maps are edited visual materials, not raw data files, and are provided for education, documents, presentations, and graphic reference.