Agriculture covers 76.52% of Washington County in the 2025 land-cover summary, but the county is not a single uninterrupted farm surface. Forest and wetlands become much more frequent in the northwest and across the southern half, while developed land forms a larger cluster near the middle of the county and several smaller clusters elsewhere. This page uses four views—general land cover, forest and farmland, impervious surface, and 1985–2025 class differences—to show where those contrasts appear within the same County GEOID 17189 boundary.
The WebP maps in the article are sized for quick viewing in a browser. The four original JPG maps are also available together in one ZIP near the end of the page. They are useful for comparing the broad farm landscape with wooded and wet areas, separating developed land from the harder paved and roofed surfaces measured by imperviousness, and locating cells whose mapped class differs between 1985 and 2025. Land cover describes what is on the surface—such as crops, forest, water, wetlands, or development—and should not be treated as a parcel boundary, ownership record, or zoning map.
Table of Contents
A 76.52% farm landscape is broken up most clearly by woods and wetlands in the south
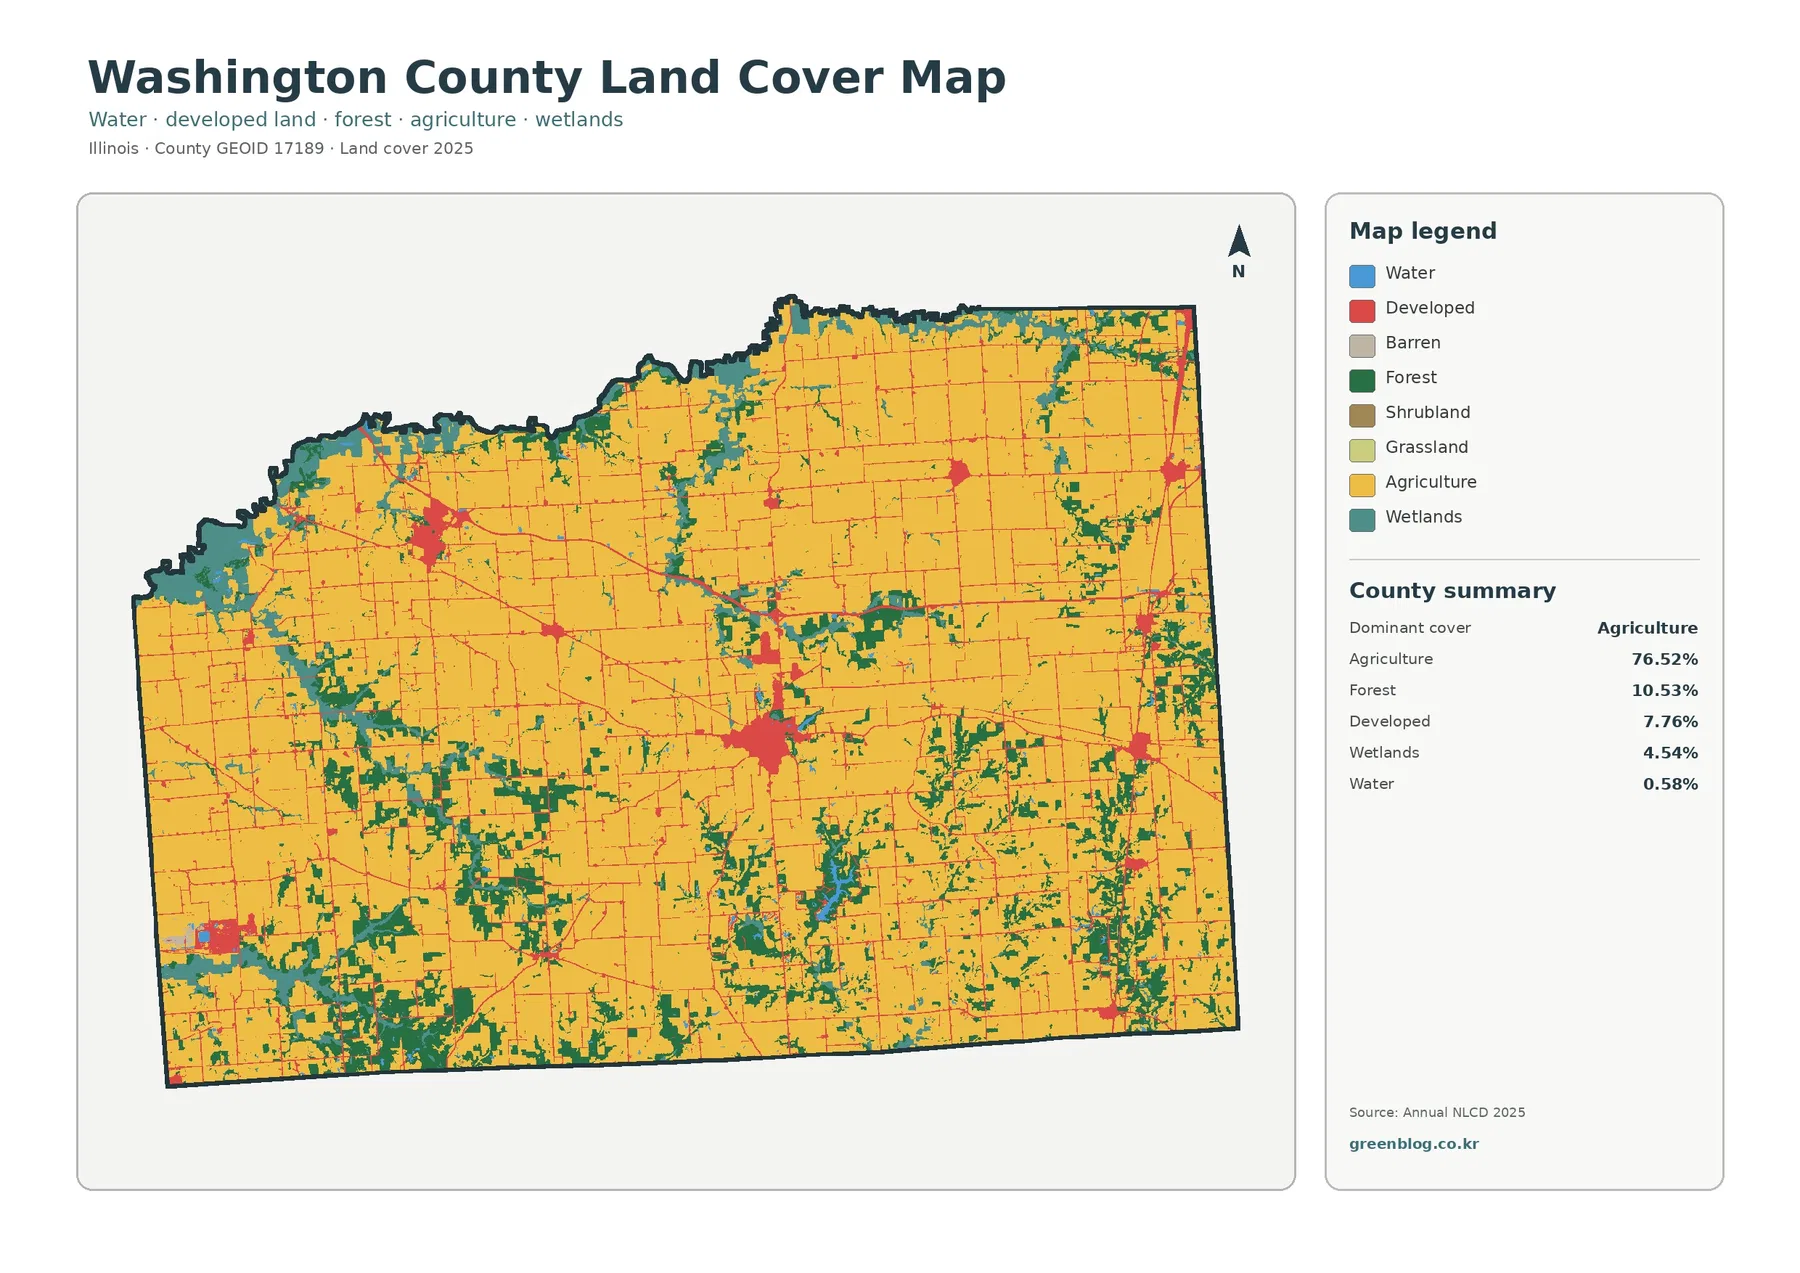
The 2025 county summary assigns 76.52% of Washington County to agriculture, 10.53% to forest, 7.76% to developed land, 4.54% to wetlands, and 0.58% to water. Grassland is only 0.02%, while shrubland rounds to 0.00% in the map summary. The general land-cover map matches those numbers visually: yellow agricultural classes dominate the northern, central, and eastern parts of the county. The pattern is broad enough that farming is the first feature most readers will notice, yet the map becomes much more varied as attention shifts toward the northwest edge and the southern half.
Green forest patches and teal wetlands interrupt the agricultural surface far more often in those areas. In the south, wooded shapes are irregular and branched rather than square, and many wetland cells appear near or between them. The northwest also contains a conspicuous mix of forest, wetlands, and farming along the county boundary. By comparison, large sections of the north-central and northeastern interior remain mostly agricultural, with only narrow nonfarm breaks. These regional differences are important because the countywide percentages alone do not show where the less common cover classes are concentrated.
Developed land is smaller in area than forest, yet it is easy to find because its red map symbol is clustered rather than evenly scattered. The largest developed concentration lies near the middle of the county, with another notable cluster in the northwest. Smaller concentrations appear toward the east and south, and thin developed lines cross many agricultural areas. The supplied map does not label roads, so those linear features should be described as mapped developed or impervious corridors rather than assigned to specific road names that are not shown in the package.
Forest is not evenly distributed: it becomes denser in the northwest and southern half
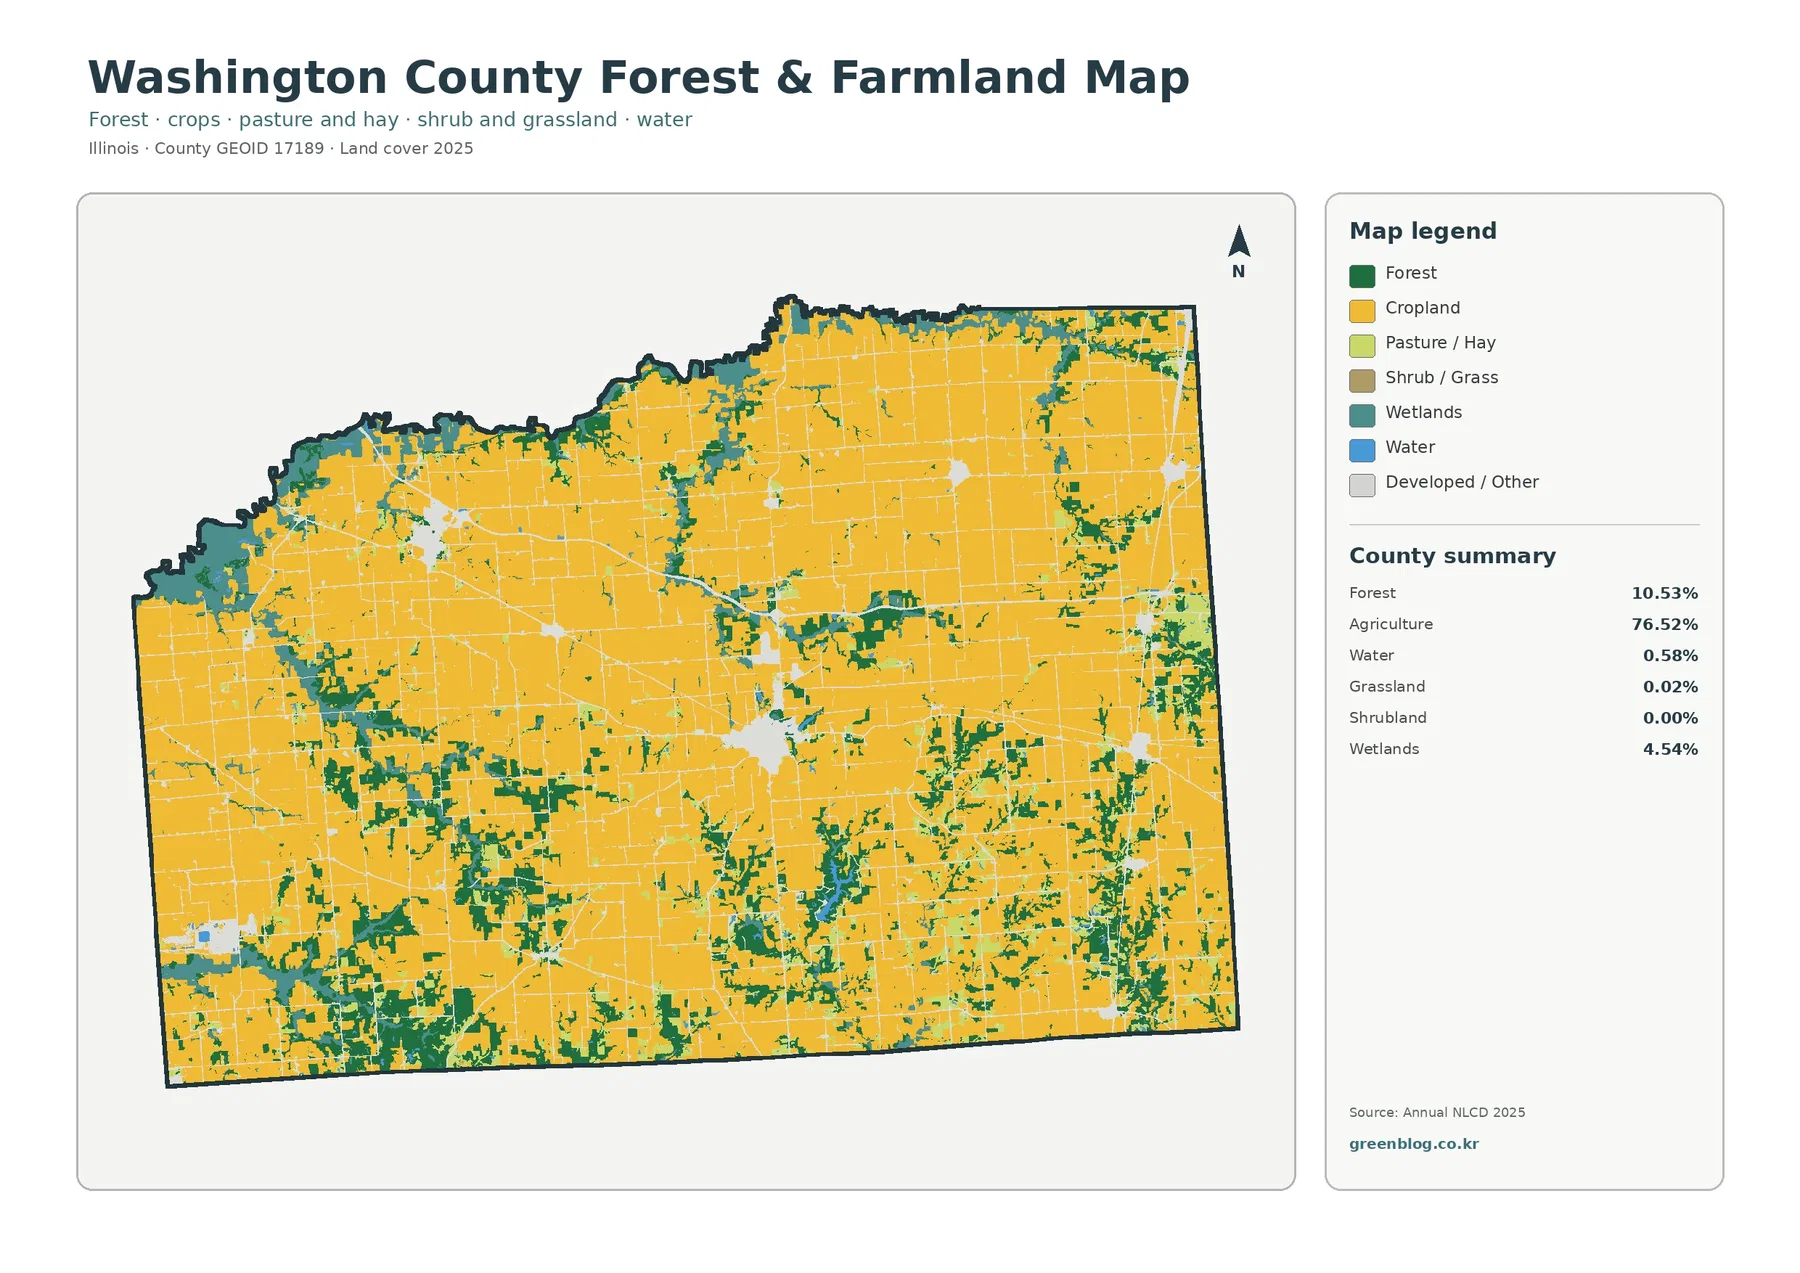
The forest-and-farmland map strips away much of the visual competition from developed and other classes, making the contrast between crops and woods easier to follow. Agricultural land remains the dominant surface across the county, but forest is noticeably uneven. The northwest boundary has a broad mix of woods and wetlands, and the southern half contains many more green patches than most of the north. Large agricultural blocks are especially apparent in the north and northeast, where forest breaks are generally smaller and farther apart.
Southern forest patches differ in shape from the surrounding farm fields. Many are narrow, bent, or branched, and several connect with other wooded pieces instead of forming large rectangular blocks. The pattern is visible in both the southwest and southeast. A small blue water body and nearby nonfarm cover also stand out in the south-central portion of the map. These shapes may correspond to local terrain or drainage conditions, but the land-cover image by itself does not establish a cause. It is safer to say that forest and wetlands are mapped there more frequently than in the county’s broad northern agricultural areas.
The 10.53% forest share can look modest when read as a countywide number, yet its concentration gives it a strong visual presence in particular parts of Washington County. For a report focused on agriculture, the general map can introduce all cover types and this simplified forest-and-farmland view can then show how woodland interrupts the agricultural surface. It is also a practical choice when the main question is not development but the location of wooded land relative to the county’s extensive fields.
Wetlands cover 4.54%, far more area than the county’s 0.58% open water
Open water occupies only 0.58% of the county, but wetlands account for 4.54%. That difference is easy to see on the general map. Blue water cells are limited to a few relatively small locations, while teal wetland cells appear in many more places. Wetlands are especially noticeable along the northwest edge and throughout the southern half, where they often sit next to forest or along the margins of agricultural land. Reading only the open-water percentage would therefore miss an important part of the county’s mapped water-related surface.
Water and wetland classes should not be merged when interpreting the legend. Water marks cells classified as open water, whereas wetlands represent a different land-cover category. At the 30-meter scale used by Annual NLCD, a single raster cell can contain a mix of wet soil, vegetation, trees, narrow water, and nearby farm ground. The mapped boundary is therefore a generalized classification rather than a survey line. These maps are useful for countywide comparison, but they are not suitable for determining a legal wetland boundary, a regulated buffer, or the exact shoreline of a small feature.
The wetland pattern also changes which map is most useful for a given question. The forest-and-farmland view makes the woodland pattern easier to see, but the general land-cover map is better when the goal is to understand why the southern landscape looks more varied. It shows forest, wetlands, small water areas, agriculture, and development at once. Moving back and forth between the two views keeps the strong yellow farm background from hiding the less common but locally concentrated wetland and forest classes.
Developed land forms one larger central cluster and several smaller centers
Developed land covers 7.76% of Washington County. The largest mapped concentration is near the center of the county, where red cells form a compact cluster and extend outward along thinner developed lines. A second notable concentration appears in the northwest, with additional smaller clusters toward the east and south. This arrangement matters because the developed percentage is not spread uniformly across the agricultural landscape. Most of the county remains lightly developed, while a limited number of centers account for much of the visible concentration.
NLCD developed classes are broader than pavement alone. A low-density developed cell can include houses or other built features together with lawns, trees, soil, and other permeable surfaces. That is why the red developed footprint on the general map does not match the darkest parts of the impervious-surface map. Treating the two as separate measurements avoids a common mistake: developed land asks where the surface has been classified into developed categories, while imperviousness estimates the fraction of the surface covered by materials such as pavement and rooftops.
Mean imperviousness is 2.15%, with high values concentrated in developed centers and narrow corridors
Impervious surfaces are places where water does not readily soak into the ground, including pavement, parking areas, and building roofs. Washington County has a mean impervious value of 2.15%, and only 0.87% of the county is mapped at 50% impervious or greater. Most of the impervious map is therefore very pale. That broad light background corresponds to the county’s extensive agriculture, forest, wetlands, and other nonpaved surfaces. Darker values are localized rather than countywide.
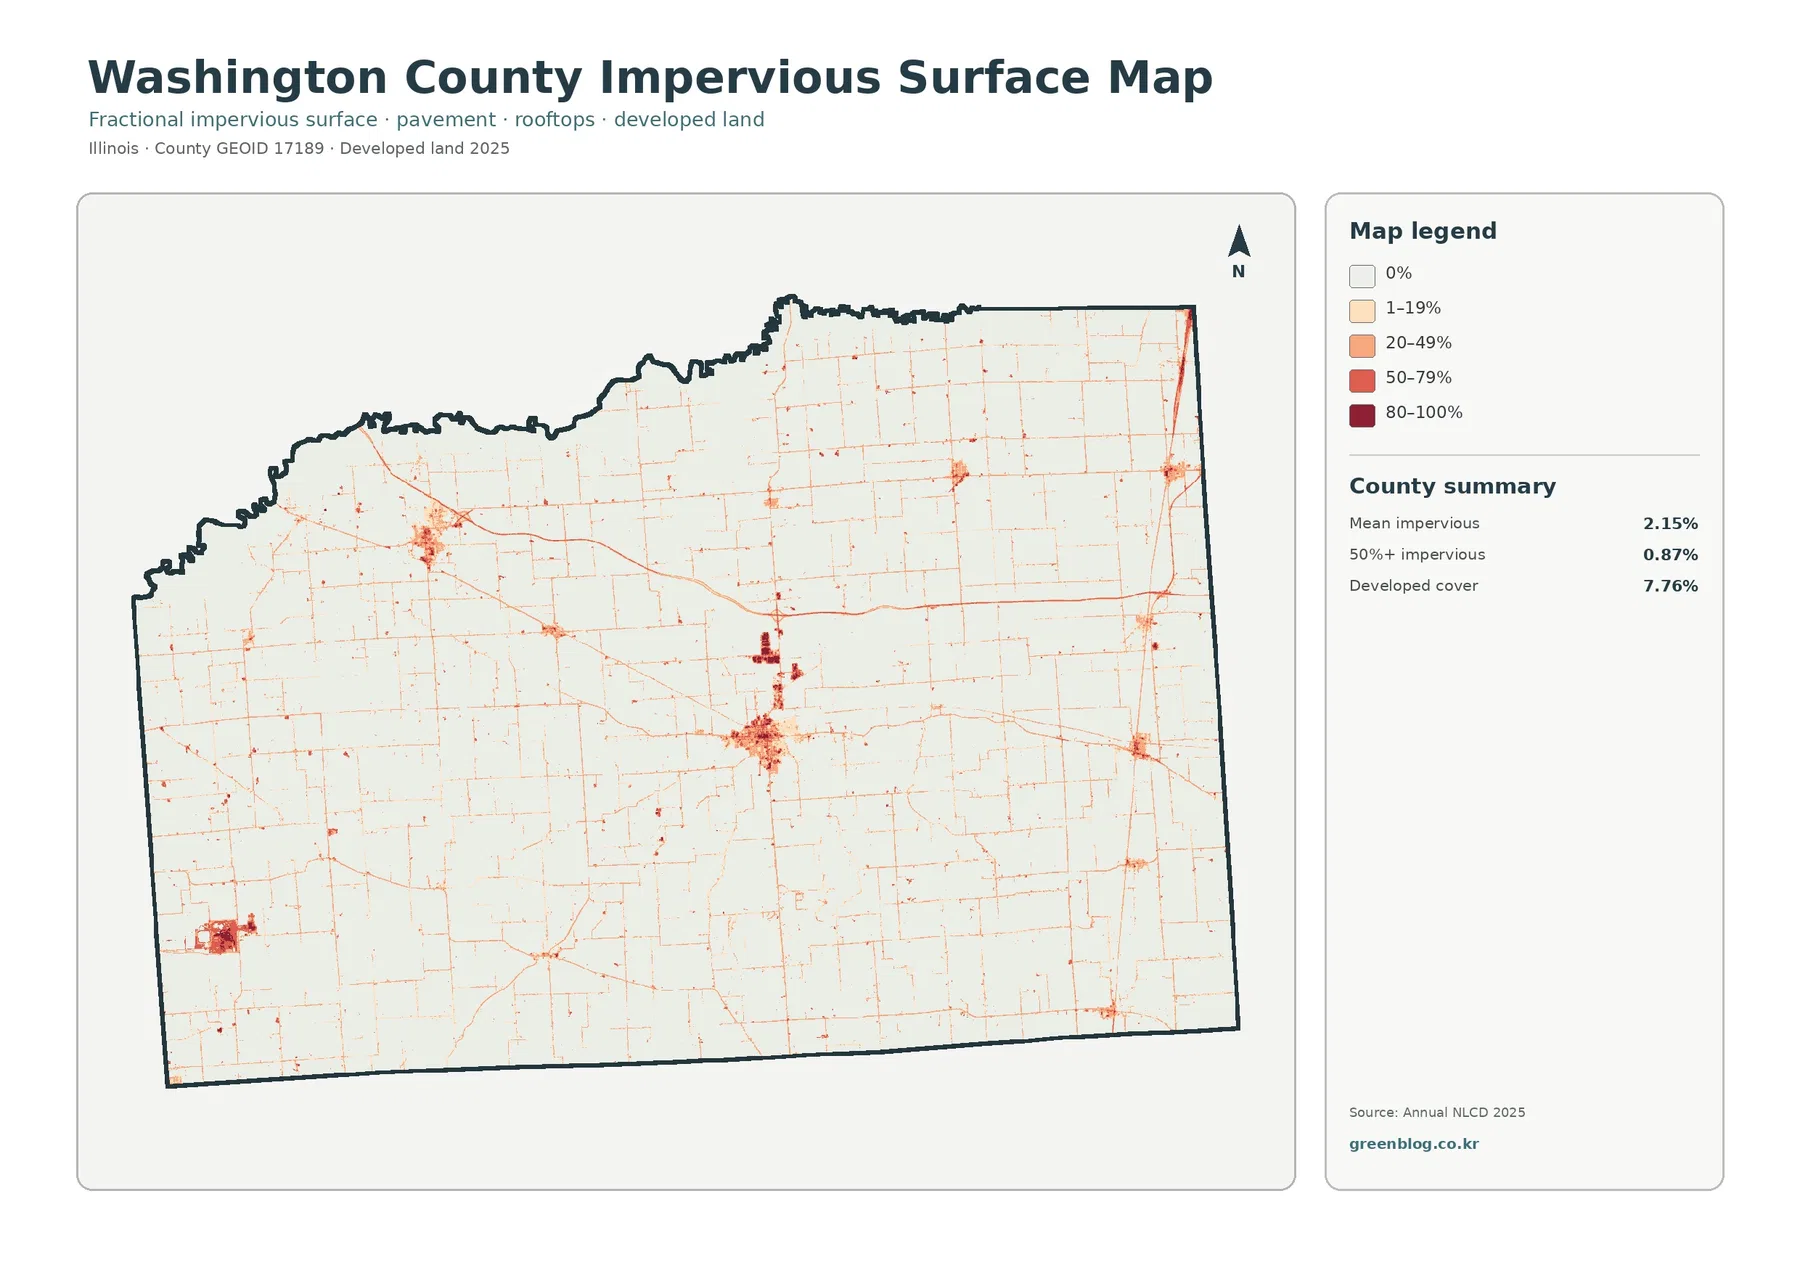
The central developed cluster contains the clearest concentration of darker orange and red cells. The northwest center is also visible, and several smaller developed places toward the east and south show local increases above the surrounding farmland. Thin lines cross the agricultural interior, marking places with more impervious surface than nearby fields. Because the map has no road labels, those features should be interpreted as relative impervious corridors rather than identified as particular highways or streets.
Even inside the main developed cluster, not every cell reaches the darkest category. Developed areas can contain yards, vegetation, open ground, and other surfaces that still absorb water. The difference between 7.76% developed cover and a 2.15% mean impervious value is therefore expected rather than contradictory. The map is useful as a background for comparing the intensity of built surfaces, but it does not include drainage systems, storm sewers, soil infiltration, or actual flood hazard. Those questions require data designed for hydrology or infrastructure analysis.
The 1985–2025 map shows 6.38% class difference, mostly as many small scattered changes
The change map compares mapped land-cover classes from 1985 and 2025. Washington County has a total class difference of 6.38%. The summary divides that into 1.27% classified as developed, 0.42% forest loss, 0.51% agricultural loss, and 4.05% other class difference. The large share assigned to the “other” category is a key reading note. The 6.38% total should not be presented as a direct measurement of real-world land-use conversion without further verification.
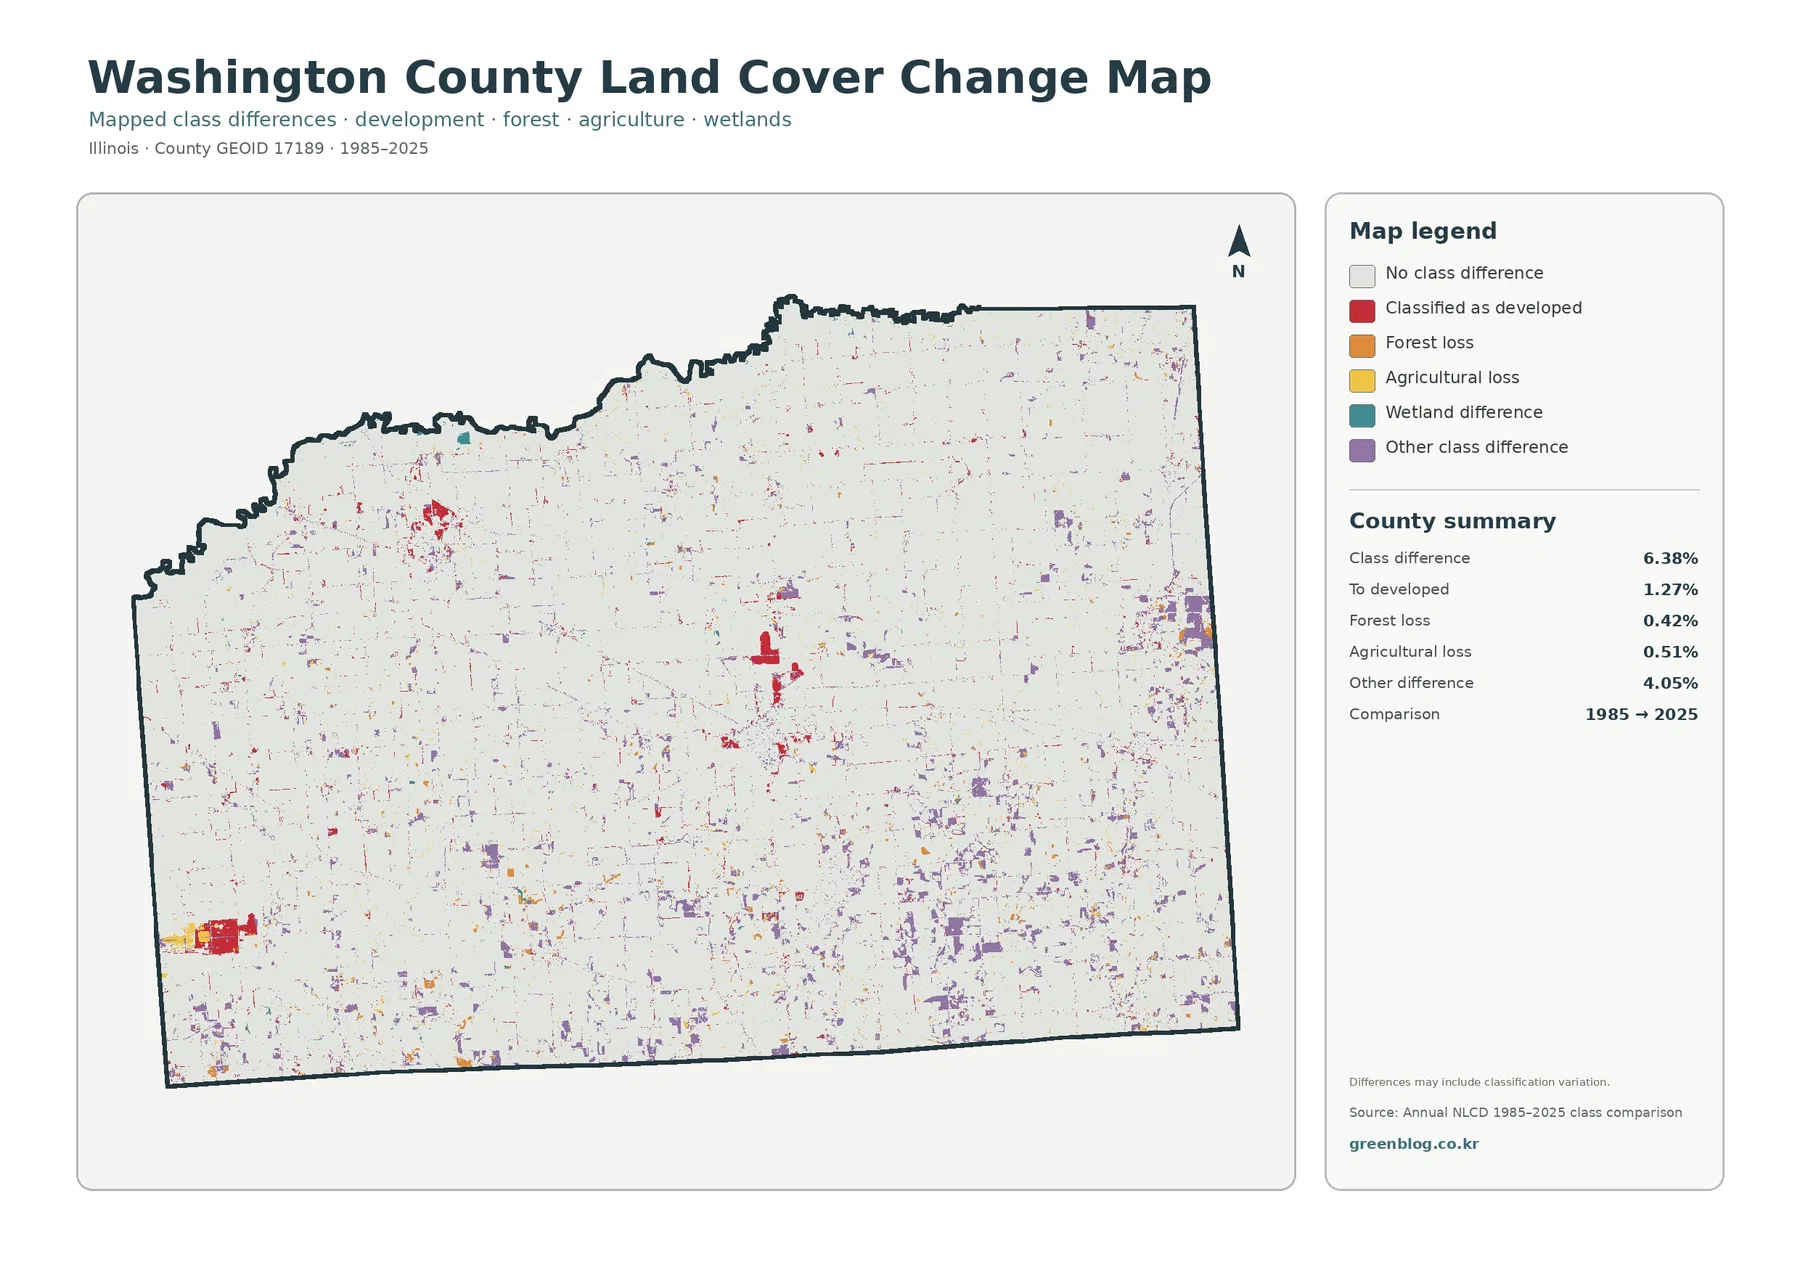
Colored change cells are scattered across the county rather than forming one continuous block. Red developed-change cells are relatively easy to see around the central cluster and the northwest developed concentration. Purple “other difference” cells appear more widely, especially in parts of the east and south, and small patches of several change types occur near forest and wetland areas. The map therefore suggests many localized classification differences rather than a single countywide front of change.
A difference between two classification years can result from real development or vegetation change, but it can also reflect image dates, classification methods, seasonal conditions, or mixed pixels along boundaries. That caution is especially important here because the other-difference category accounts for 4.05 percentage points of the 6.38% total. If a specific site needs to be checked for actual development, forest removal, or agricultural conversion, the change map is best used as a screening layer and then compared with additional Annual NLCD years, aerial imagery, and local records.
Matching the same place across all four maps separates cover, paving, and long-term class differences
The central developed area is a useful example. On the general land-cover map it appears as a broad red cluster surrounded by agriculture. On the impervious map, the core and some connecting lines are darker, while other parts of the developed footprint remain much lighter. The change map adds a third question by showing where 1985 and 2025 classifications differ, including some cells mapped as a transition to developed. Current development, high imperviousness, and a historical class difference are related concepts, but they are not interchangeable.
The southern half supports a different comparison. The general map shows a complicated mix of agriculture, forest, wetlands, and a few small water features. The forest-and-farmland map simplifies the background and makes the irregular wooded shapes easier to trace. On the impervious map, most of the same area stays pale, creating a strong contrast with the central developed cluster. The change map then adds scattered class differences without implying that every present-day forest or wetland patch changed during the comparison period.
The northwest is another good place to move between views. Agriculture, forest, wetlands, and a developed center are all relatively close together on the general map. Impervious values increase around the developed concentration and along connecting lines but stay low across nearby farm and wooded surfaces. The change map contains both developed and other differences in the same broad area. Comparing maps in this way is more informative than reading any single percentage because it preserves the location of each measurement.
Thirty-meter raster cells are appropriate for county patterns, not parcel-level decisions
Annual NLCD is raster data. In plain terms, the landscape is divided into a grid and each cell receives a representative class. At roughly 30 meters, one cell can contain the edge of a field, trees, a narrow road, a building, wet ground, or a small drainage feature at the same time. The final map still has to assign a class to that cell. This is why boundaries between agriculture, forest, wetlands, and development may look blocky or may not line up exactly with what a person sees on the ground.
The maps are well suited to questions about Washington County as a whole: where agriculture dominates, where forest and wetlands become more frequent, where developed land clusters, and where impervious values are higher than the rural background. They are not substitutes for a property survey, parcel ownership record, building-permit map, agricultural zoning layer, or jurisdictional wetland determination. A land-cover class is a useful description of the mapped surface, not a legal statement about how a parcel may be used.
It is also better to read broad patterns before focusing on individual cells. Washington County’s strongest pattern is stable across the four views: agriculture forms the large background, forest and wetlands add much more variety in the northwest and south, and built surfaces remain concentrated in a limited number of centers and corridors. Once that countywide structure is clear, zooming into smaller areas can answer more focused questions without giving a single mixed pixel more precision than the source supports.
Choose the map by the question rather than treating all four as interchangeable
Use the general land-cover map when a reader needs the full 2025 surface pattern in one view. It is the only map in the set that places agriculture, forest, developed land, wetlands, and water together with the same legend. The forest-and-farmland version is cleaner for showing where the 10.53% forest share interrupts the 76.52% agricultural background. The impervious map is the better choice for comparing built-surface intensity, and the change map is designed specifically for locating cells whose class differs between 1985 and 2025.
In a classroom or comparative report, the four maps can be arranged side by side around county-specific questions. Where do forest and wetlands interrupt an otherwise agricultural landscape? How much smaller is the darkest impervious footprint than the full developed class? Do mapped class differences cluster around today’s developed centers or also occur in rural forest and wetland areas? Those questions use the maps for what they actually show and avoid turning a general land-cover product into a parcel or regulatory dataset.
Washington County can also be compared with other agricultural counties, but the local pattern should not be reduced to the agriculture percentage alone. Two counties with similar farm shares may have very different locations of forest, wetlands, developed centers, and high-impervious surfaces. Here, the concentration of woods and wetlands in the northwest and south is one of the features that keeps the map from looking like a uniform block of farmland. Preserving that geographic detail makes a county comparison more meaningful than simply ranking percentages.
Download the four Washington County JPG maps
The download ZIP contains the Washington County general land-cover map, forest-and-farmland map, impervious-surface/developed-land map, and 1985–2025 land-cover change map as separate JPG files. Each uses the same County GEOID 17189 boundary, making it easy to compare the central developed concentration, the northwest mix of woods and wetlands, and the more varied southern landscape at matching locations. The WebP images above are optimized for page viewing, while the JPG files are convenient for saving locally and placing into documents or presentations.
Frequently Asked Questions
Does the 76.52% agriculture figure equal the legally recorded farmland area of Washington County?
No. The 76.52% figure is the share of the supplied 2025 Annual NLCD map classified into agricultural cover. It is a satellite-based surface classification and does not equal parcel ownership, tax classification, agricultural zoning, or a legal inventory of protected farmland. Parcel-level questions need property and administrative records designed for that purpose.
Why are wetlands 4.54% while open water is only 0.58%?
They are separate land-cover classes. Open water marks cells classified mainly as water, while wetlands are mapped from wetland vegetation and surface conditions. In Washington County, wetlands are much more widespread than open water and appear frequently in the northwest and southern half. Neither percentage should be used as a legal wetland or shoreline boundary.
Can the 6.38% 1985–2025 class difference be reported as the county’s actual land-use change rate?
Not by itself. The 6.38% total includes 1.27% mapped to developed, 0.42% forest loss, 0.51% agricultural loss, and 4.05% other class difference. Some differences can come from image timing, classification methods, or mixed cells as well as real landscape change. A site-specific conclusion should be checked against additional NLCD years, aerial imagery, and local records.
Sources and reference data
- MRLC Annual NLCD Data – annual land-cover and impervious-surface datasets
- USGS Annual NLCD Land Cover Classification – class definitions and legend information
- U.S. Census Bureau TIGER/Line Shapefiles – standard Washington County boundary geography
Map File Information
Download four original JPG maps for Washington County covering current land cover, forest and farmland, impervious/developed land, and the 1985–2025 class comparison.
- Intended Use: comparing agriculture, forest, wetlands, developed centers, impervious surfaces, and mapped class differences
Related Maps
- Adams County Illinois Land Cover Map
- Alexander County Illinois Land Cover Map
- Bond County Illinois Land Cover Map
Green Map creates custom-edited map images using open geographic data sources such as geoBoundaries, Natural Earth, OpenStreetMap, and government open data.
These maps are edited visual materials, not raw data files, and are provided for education, documents, presentations, and graphic reference.