Shelby County, Illinois is mostly agricultural, yet its land-cover pattern is defined by a feature that breaks the farm landscape dramatically: Lake Shelbyville. Agriculture covers 77.45% of the county in the 2025 summary, while forest forms thick bands around the reservoir and branching corridors farther south. Shelbyville creates the strongest developed cluster near the lake’s southern end. This page compares four views of the same county: general land cover, forest and farmland, impervious surface, and 1985–2025 class differences.
The four original JPG maps are available together in one ZIP. Choose the general map for the full county pattern, the forest-and-farmland map for the relationship between fields and wooded corridors, the impervious map for Shelbyville and road-related hard surfaces, and the change map for places where the broad class differs between 1985 and 2025.
Table of Contents
Lake Shelbyville is the visual center of an otherwise farm-dominated county
The official Shelby County website identifies Shelbyville as the county seat and features Lake Shelbyville as one of the county’s major attractions. Both are easy to locate in the supplied land-cover map. The reservoir forms the largest continuous blue feature in the north-central part of the county, with broad forest cover wrapped around many of its arms. Just south of the lake, Shelbyville appears as the largest connected developed cluster on the county map.
The 2025 summary assigns 77.45% to agriculture, 13.19% to forest, 7.38% to developed land, 1.37% to water, and 0.50% to wetlands. Agriculture clearly dominates by area, but forest and water are strongly concentrated rather than evenly scattered. The lake and its wooded edge create a large natural complex in the north-central interior, while the southwest and southern portions contain a different kind of woodland pattern made of many narrow, branching strips between fields.
Illinois Department of Natural Resources material describes Lake Shelbyville as a reservoir created by damming the Kaskaskia River in 1970. The same source describes the lake as a lopsided Y, with upper arms formed by the West Okaw and Kaskaskia Rivers. That description helps explain the large branching water shape visible on the map. The body map does not label every watercourse, so smaller blue features should be treated as mapped water rather than assigned a river name without a separate hydrographic reference.
Three places to read first on the 2025 map: the reservoir, Shelbyville, and the wooded south
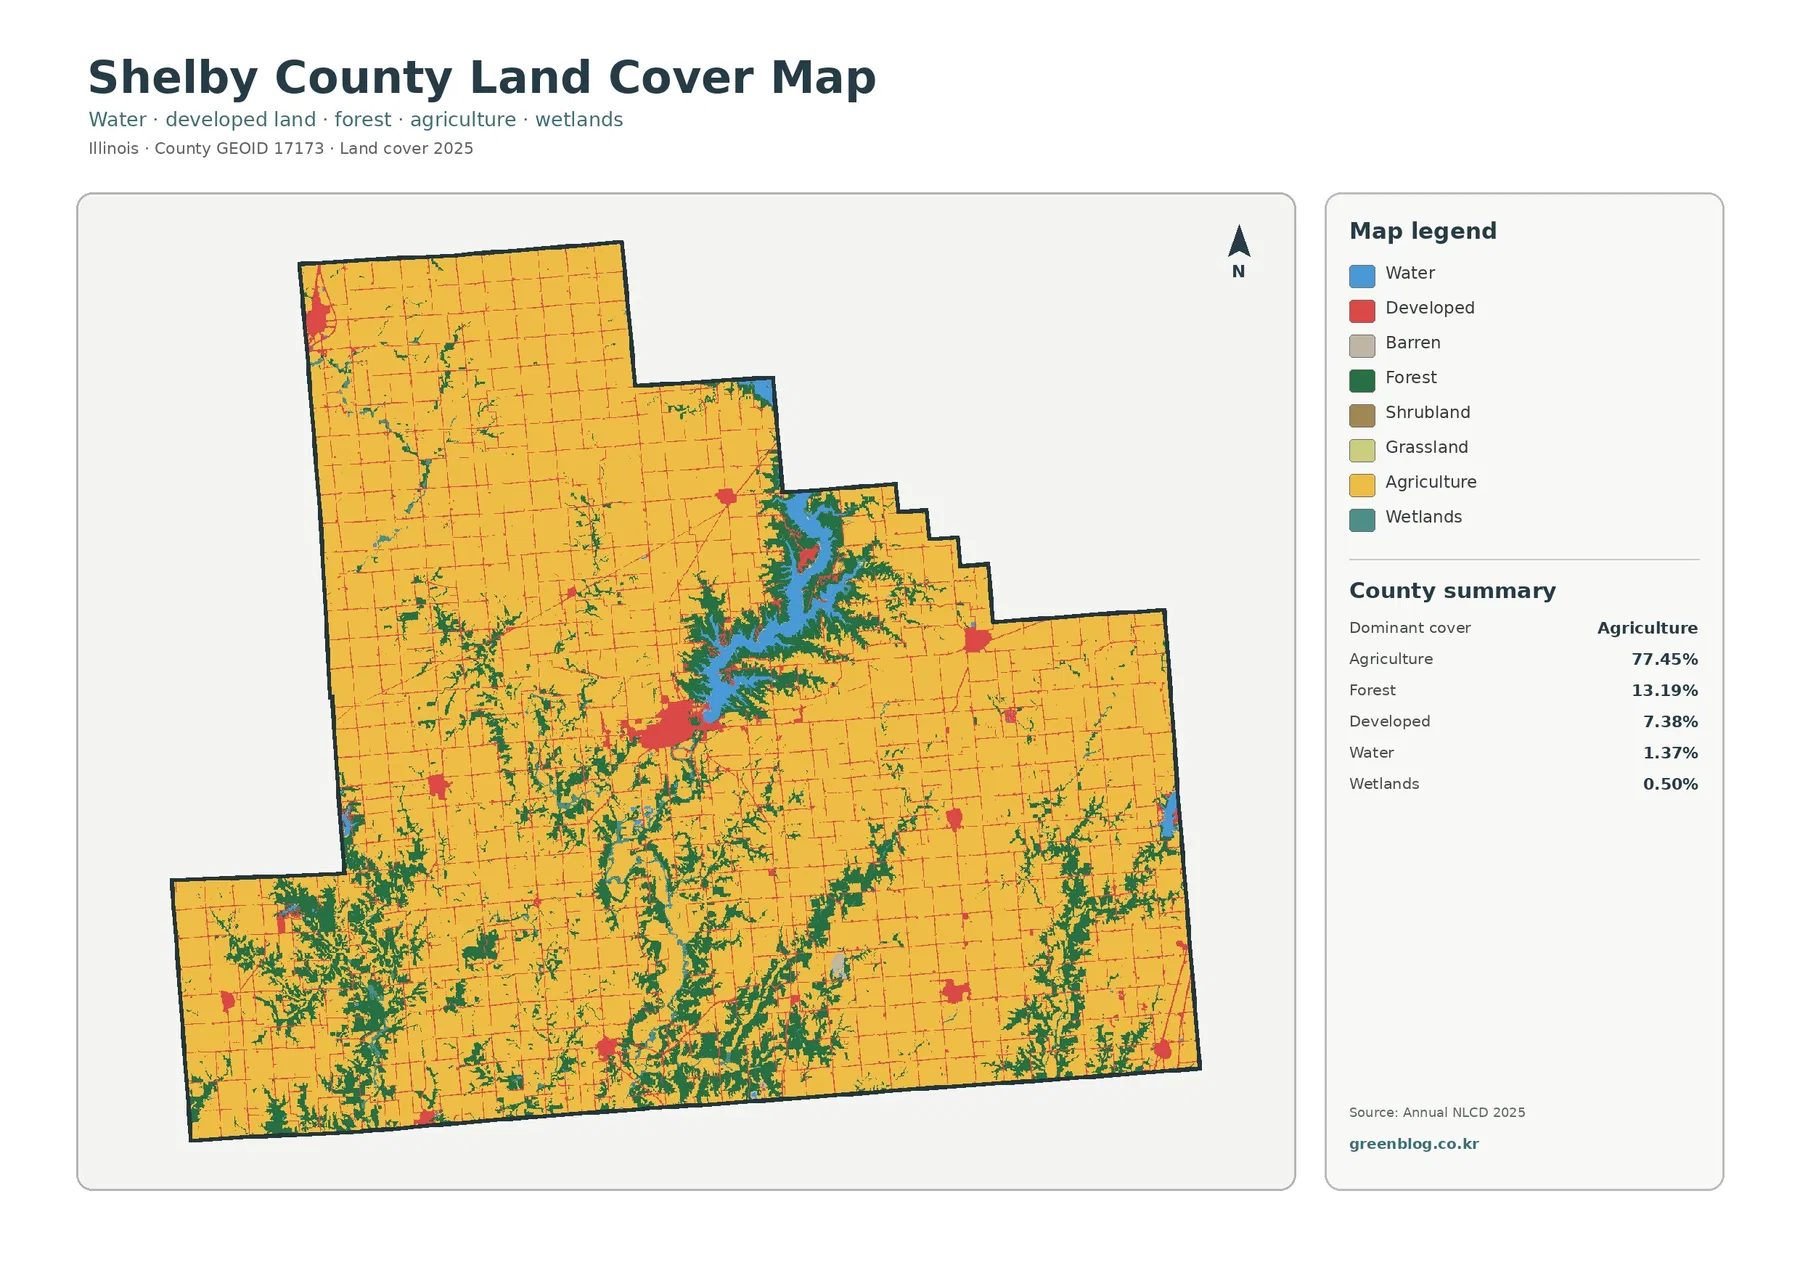
Yellow agricultural cover forms the broad background across most of Shelby County. The northwest, east, and southeast contain especially large farm blocks, crossed by a fine grid of developed road traces. The pattern changes sharply near Lake Shelbyville. Blue water occupies a large area, and dark green forest follows many of its irregular coves and arms. The visual contrast makes the reservoir easy to identify even before reading the legend.
Shelbyville is the largest red developed cluster and sits close to the lake’s southern end. The county courthouse and government offices are located in Shelbyville, confirming its role as the county seat. On the map, several road corridors spread away from the town into surrounding agricultural land. Smaller developed clusters appear in the northwest, north-central, east, and southeast, but none forms a connected footprint as large as Shelbyville.
The southwest and southern parts of the county add another distinct pattern. Forest is not concentrated around one large lake there. Instead, green cover splits into long, branching strips that divide farm areas into smaller pieces. Some wooded corridors connect with larger forest blocks, while others become thin ribbons or isolated patches. This difference between shoreline forest and interior branching forest is one of the most useful county-specific observations in the map set.
Water is 1.37% and wetlands are 0.50% in the 2025 summary. Those percentages are small compared with agriculture, but the water class is strongly concentrated in Lake Shelbyville, making it visually important. Wetland cover occurs in narrower patches along parts of the lake edge and other water-related corridors. The map can support watershed or environmental lessons, but it does not show flood zones, legal wetland boundaries, reservoir operating levels, or water quality.
Land cover describes what is on the surface, not how the land is legally zoned or owned. A developed cell does not tell the reader whether a parcel is residential, commercial, industrial, or public. Agricultural cover does not establish ownership or farmland-protection status. Parcel boundaries, zoning, permits, and regulatory decisions must be checked in the appropriate county or state records.
The forest-and-farmland view separates shoreline woods from the branching southern corridors
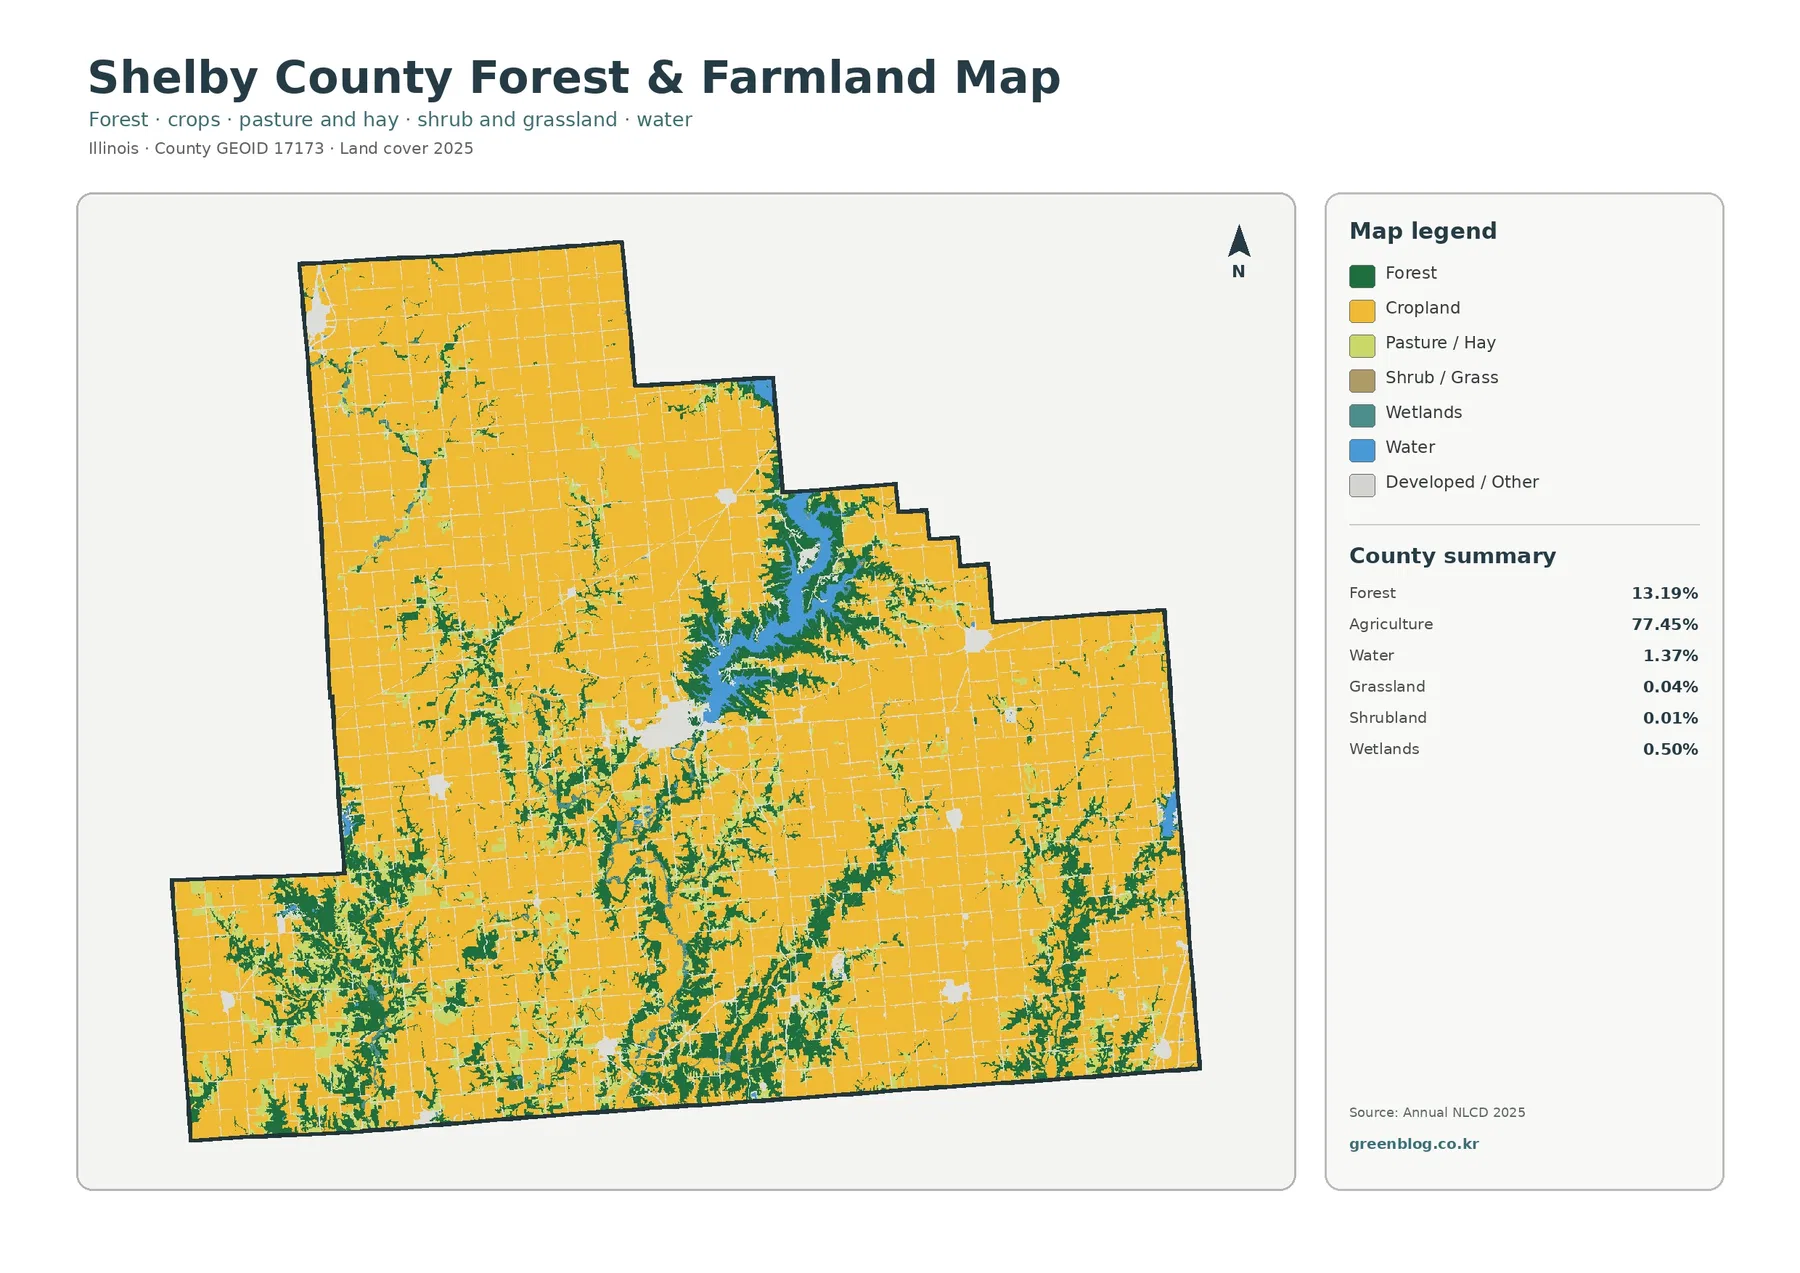
When developed and minor classes are simplified, the contrast between 77.45% agriculture and 13.19% forest becomes easier to read. Large agricultural blocks dominate the northwest and much of the east. Around Lake Shelbyville, however, forest forms a thick and nearly continuous frame around the reservoir’s irregular shape. That wooded shoreline is one of the clearest places where the natural-cover pattern differs from the open farm grid.
South of the lake, the forest pattern changes. Wooded cover follows many narrow, twisting corridors through farmland, particularly in the southwest and southern interior. These strips often branch, reconnect, and form larger patches. The shapes may align with drainage and local relief, but the supplied map does not contain elevation or stream labels. The safest conclusion is that forest is concentrated along narrow landscape corridors rather than spread evenly over the agricultural surface.
Grassland is listed at 0.04% and shrubland at 0.01% in the simplified summary. They are legitimate mapped classes but too small to define the county-wide story. Agriculture, forest, water, and wetlands explain the major visual differences more clearly. Minor grass and shrub patches are best treated as local details rather than expanded into major themes.
Lake Shelbyville is managed by the U.S. Army Corps of Engineers, whose official page lists a Lake Shelbyville office in Shelbyville. That verified management context helps explain why the reservoir is such a prominent named feature in the county. The land-cover map itself does not show public-land boundaries, recreation sites, forest ownership, or park limits, so the green shoreline should not be assumed to match one management boundary.
Mean impervious cover is 1.72%, with Shelbyville forming the strongest hard-surface cluster
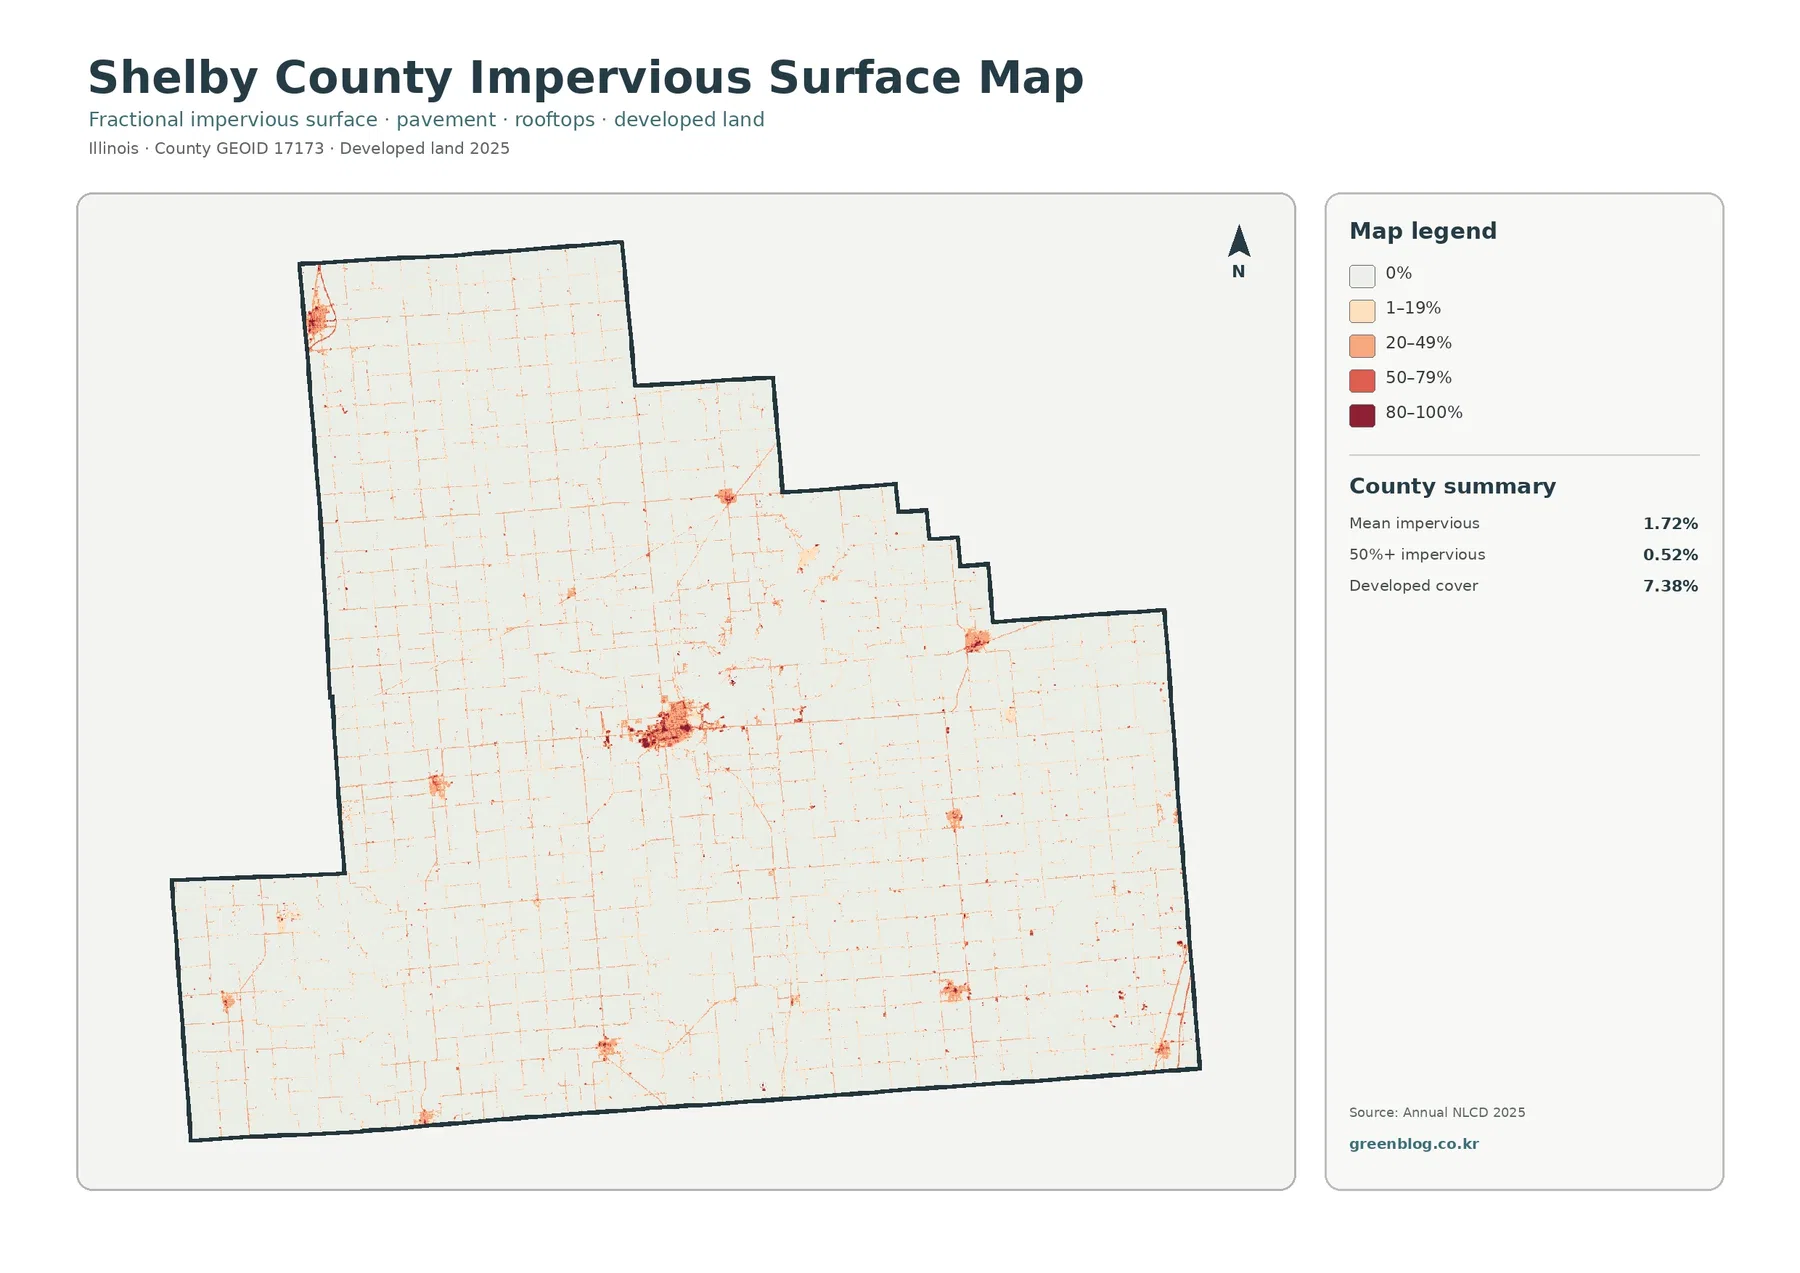
Impervious surface means hard cover such as pavement, parking areas, and rooftops where water does not readily soak into the soil. Shelby County’s mean impervious value is 1.72%, and cells with at least 50% impervious surface account for 0.52% of the county. Developed land is 7.38% in the general land-cover summary. Those values fit a rural county where settlements are visible but most land remains agricultural or forested.
Shelbyville is the darkest and broadest impervious cluster. The center contains tightly grouped orange and red cells, and road lines extend outward in several directions. Smaller clusters appear in the northwest, north-central, east, and southeast. Because the impervious map does not label town names, those smaller patches are best described as separate settlement clusters unless an administrative map is used to confirm the exact municipality.
The difference between developed land and impervious percentage is important. A low-density developed cell can contain lawns, trees, and open soil in addition to roads and buildings. The impervious layer reports the fraction of hard surface inside each 30-meter cell. That is why Shelbyville’s core appears darker than its outer developed fringe and why some areas classified as developed in the general map remain relatively pale on the impervious view.
Lake Shelbyville almost disappears from the impervious map because water and forest are not hard built surfaces. What remains are access roads, nearby developed areas, and other narrow lines. This comparison is especially useful for readers who might otherwise assume that a prominent named place on one map should be equally prominent on every thematic map. Each view highlights a different property of the same county.
USGS describes Annual NLCD as a Landsat-based raster product with 30-meter spatial resolution. A single cell can contain several real-world surfaces, so small roads, buildings, lawns, and tree lines may be generalized. The impervious map works well for county-scale concentration patterns but should not be used to calculate paved area for a parcel or to design drainage for a specific site.
The 1985–2025 class difference is 6.64%, while developed change is 0.97%
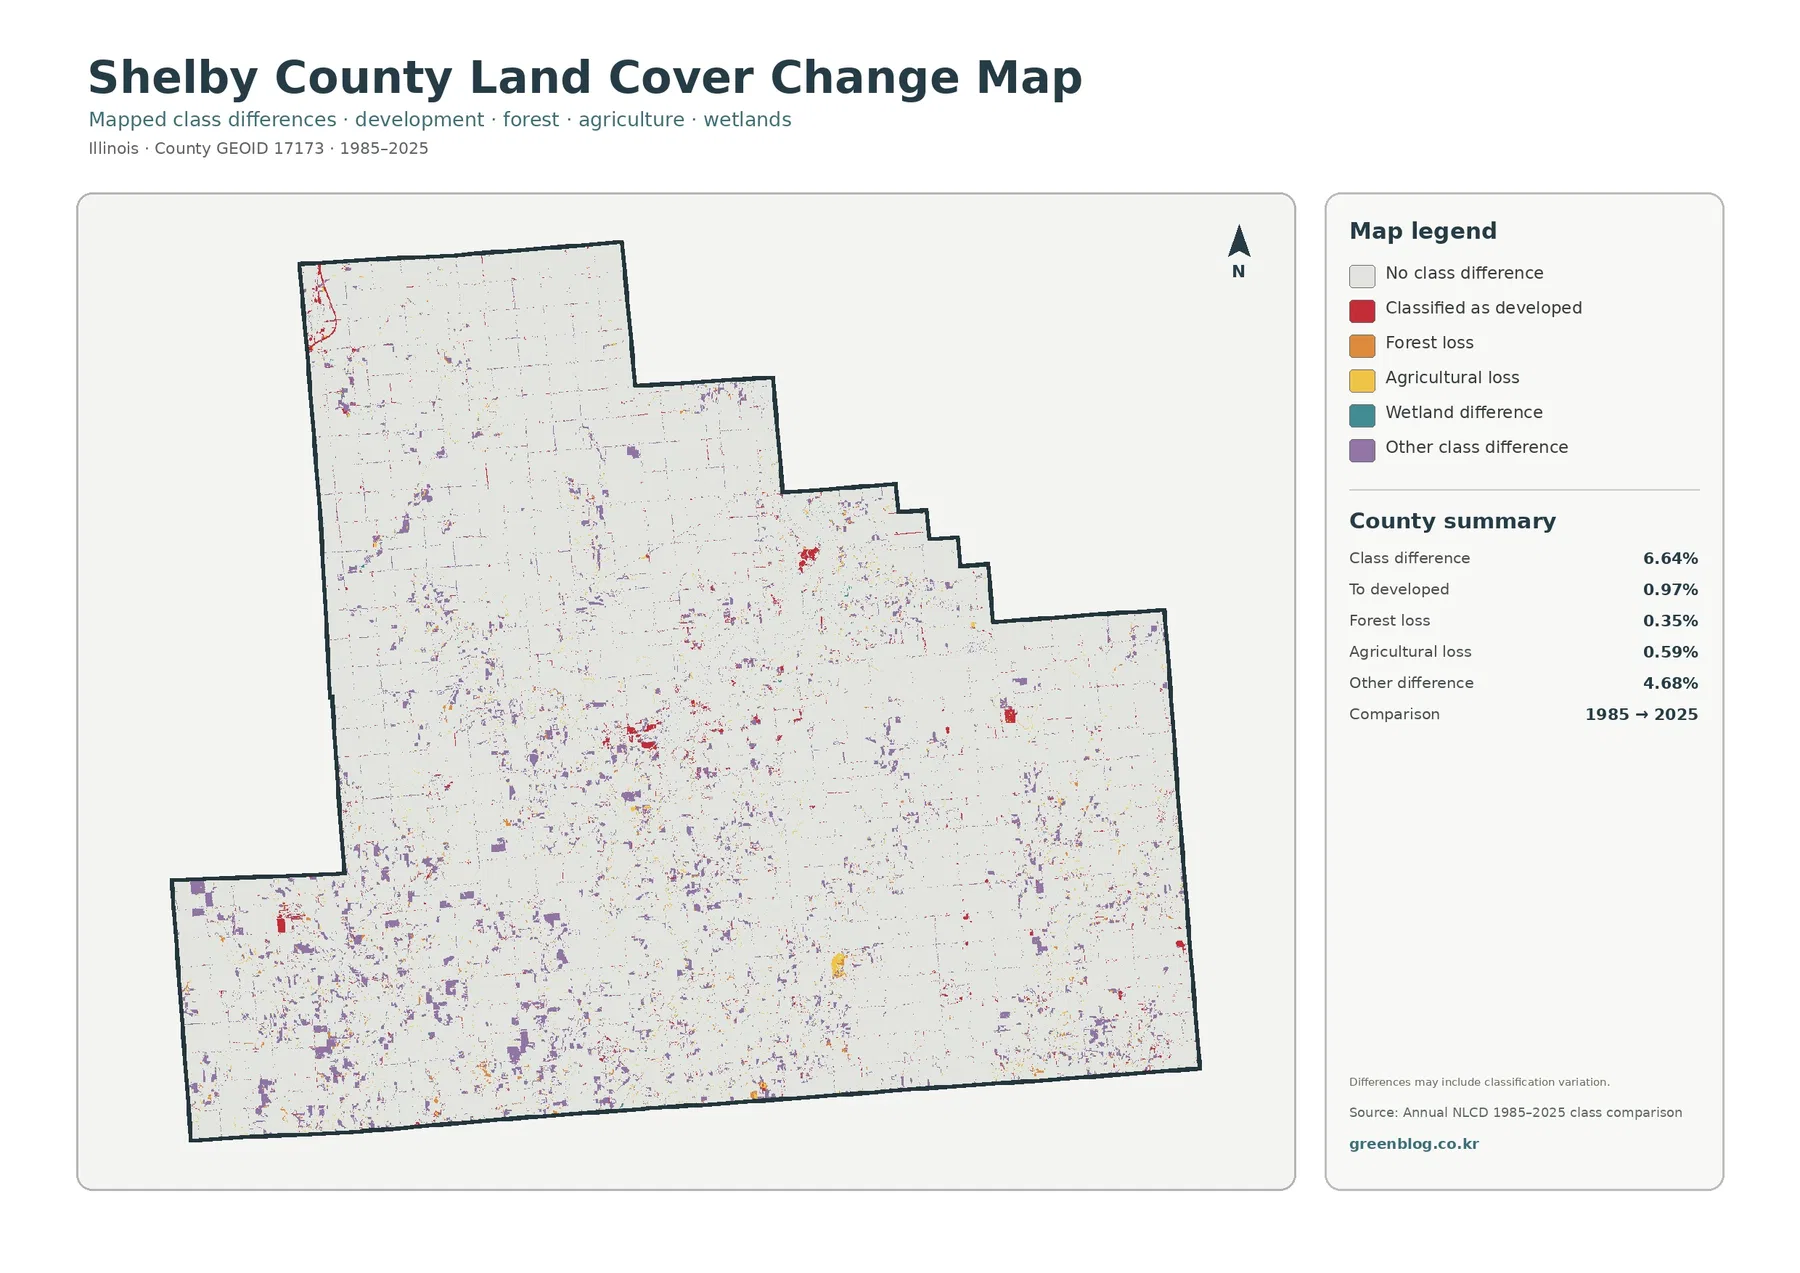
The change map reports a total class difference of 6.64% between 1985 and 2025. Cells classified as developed account for 0.97%, forest loss for 0.35%, agricultural loss for 0.59%, and other class differences for 4.68%. Wetland difference is shown in the legend, although the summary panel does not give it a separate percentage. The 6.64% total should not be interpreted as a development-growth rate.
Other class difference is the largest component. A broad class can differ between two dates because of a real surface transition, but mixed pixels, classification boundaries, and different image conditions can also contribute. The map itself warns that differences may include classification variation. Purple cells are therefore useful screening locations, not proof that a particular land-use event occurred.
Developed-change cells appear around Shelbyville and several smaller settlement or road corridors, but their 0.97% share is far smaller than the full class-difference total. Forest loss and agricultural loss are even smaller percentages. Some more visible patches occur in the northwest, near the reservoir, and in the south, but the two-date map cannot determine the exact year or cause of a change.
Lake Shelbyville adds another reason for caution. Water, shoreline vegetation, wetlands, agriculture, and forest meet along an irregular reservoir edge. Actual water-level or vegetation changes may influence the map, but classification boundaries can also shift. A specific shoreline question should be checked with intermediate Annual NLCD years and U.S. Army Corps of Engineers reservoir information rather than inferred from one endpoint comparison.
A 1985–2025 comparison also does not record every intermediate event. A cell that changed class and later returned to the same broad class by 2025 can appear unchanged in the two endpoints. The map is therefore most useful for locating long-term class differences that deserve closer study, not for reconstructing a complete forty-year history.
Use Lake Shelbyville and Shelbyville as two anchors when comparing all four maps
Lake Shelbyville is the easiest natural anchor. On the general map it appears as a large blue reservoir surrounded by forest. On the forest-and-farmland map the wooded shoreline becomes even clearer because developed detail is reduced. On the impervious map most of the reservoir and forest fade into low values, leaving roads and built surfaces. The change map shows only cells whose broad class differs between the two comparison years.
Shelbyville is the strongest human-built anchor. The general map shows a red developed cluster, while the impervious map separates its dense center from lower-density edges and road corridors. The forest-and-farmland view simplifies the town to gray so the relationship among the city, farmland, forest, and reservoir is easier to see. The change map is not a map of current city size; it shows only broad-class differences between 1985 and 2025.
The southwest provides a third comparison point. General and forest-focused views show branching woodland through farm country. The impervious map turns most of that area pale because little hard surface is present outside roads and small settlements. Scattered colors on the change map identify locations that deserve additional review, but they should not be treated as a single large conversion event.
Which map works best for a county overview, lake lesson, or development comparison?
The general 2025 map is the strongest single image for a Shelby County overview because it combines the 77.45% agricultural background, the reservoir, forest, Shelbyville, smaller settlement clusters, and wetlands. The forest-and-farmland map is more effective when the topic is the relationship between farm blocks and wooded corridors. The impervious map is the clearest choice for built surfaces and roads.
Lake Shelbyville is a useful teaching focus because official IDNR material explains that the reservoir was created by damming the Kaskaskia River and has an irregular Y-like form. The land-cover maps show the present relationship among water, shoreline forest, nearby development, and surrounding agriculture. They do not provide depth, water quality, flood-control operations, recreation facilities, or legal shoreline boundaries.
Shelbyville works well for explaining the difference between a developed class and impervious cover. The town is obvious on both maps, yet the impervious view shows that hard surface is concentrated most strongly in the center and along roads. That makes it easier to explain why the county-wide developed share of 7.38% can coexist with a much lower mean impervious value of 1.72%.
The downloadable JPGs measure 2480×1754 pixels, but enlarging the image cannot recover detail that is absent from the underlying 30-meter data. Small buildings, narrow streams, tree lines, and parcel edges may be generalized. The maps are intended for county-scale interpretation, printing, and presentation rather than property surveys, zoning decisions, or engineering measurements.
The observation year matters as well. The 2025 map will not show construction or vegetation changes that occurred later. The change map compares only the 1985 and 2025 endpoints. Current conditions and the exact timing of past transitions require newer imagery, intermediate Annual NLCD years, county records, and other appropriate local sources.
Choosing the right original JPG
Choose the general land-cover map for the broadest county reference. Use the forest-and-farmland view when Lake Shelbyville’s wooded shoreline and southern forest corridors are the main story. Pick the impervious map for Shelbyville, smaller settlement clusters, and road-related hard surfaces. Select the 1985–2025 map when the goal is to find broad class differences that need further investigation. The ZIP contains one original JPG for each view.
Frequently Asked Questions
Why does Lake Shelbyville stand out so strongly on the land-cover map?
Lake Shelbyville is the county’s largest continuous water feature, and broad forest cover follows many of its irregular shoreline arms. Water is only 1.37% of the county in the 2025 summary, but much of it is concentrated in one large reservoir. IDNR describes the lake as a reservoir formed by damming the Kaskaskia River, which provides verified geographic context for the large blue feature.
How agricultural is Shelby County in the 2025 map?
Agriculture is the dominant class at 77.45%. Forest is 13.19%, developed land 7.38%, water 1.37%, and wetlands 0.50%. The county is clearly farm-dominated, but the reservoir, its wooded shoreline, and branching forest in the south make the spatial pattern more varied than the agriculture percentage alone suggests.
Does the 6.64% 1985–2025 class difference mean 6.64% of the county was developed?
No. Cells classified as developed account for 0.97%, forest loss for 0.35%, agricultural loss for 0.59%, and other class differences for 4.68%. Other difference is the largest component, and the map warns that classification variation may contribute. The 6.64% total is a two-date class-difference measure, not a development-growth rate.
Map File Information
Download four original JPG maps for Shelby County, Illinois: 2025 land cover, forest and farmland, impervious surface and developed land, and 1985–2025 land-cover class differences.
- Included Files: Use only the versions confirmed in the article and supplied images
- File Type: Use the confirmed download contents
- Intended Use: Printing, education, presentations, and map-based projects
Related Maps
- Adams County Illinois Land Cover Map
- Alexander County Illinois Land Cover Map
- Bond County Illinois Land Cover Map
Sources and References
- MRLC Annual NLCD Data — annual land-cover and related products
- USGS Annual NLCD Land Cover Classification — land-cover class definitions and methodology
- USGS Annual NLCD Spatial Resolution — 30-meter raster resolution
- U.S. Census Bureau TIGER/Line Shapefiles — county boundary data
- Shelby County, Illinois official website — county-seat and Lake Shelbyville context
- U.S. Army Corps of Engineers Lake Shelbyville — official reservoir management and location information
- Illinois DNR Lake Shelbyville Description — Kaskaskia River, reservoir formation, and lake geography
Green Map creates custom-edited map images using open geographic data sources such as geoBoundaries, Natural Earth, OpenStreetMap, and government open data.
These maps are edited visual materials, not raw data files, and are provided for education, documents, presentations, and graphic reference.