Randolph County is dominated by agriculture in the 2025 land-cover summary, yet the maps are far from uniform. Broad farm country in the north and center gives way to more wooded ground toward the south, while water and wetlands trace the irregular western and southern edges. Four map views on this page separate those patterns so they can be compared without treating every land-cover class as the same kind of information.
The original four JPG maps are available together in one download. Each file is 2480×1754 pixels and covers a different question: current land cover, forest versus farmland, impervious surface and developed land, or class differences between 1985 and 2025. The WebP images in the article are previews; the ZIP contains the JPG map files.
Table of Contents
Agriculture Leads the County, but It Does Not Look the Same Everywhere
Agriculture accounts for 60.07% of the 2025 summary. Forest is the next largest class at 22.54%, followed by developed land at 8.95%, wetlands at 4.35%, and water at 3.71%. Those percentages establish the countywide balance, but the map adds an important second layer: the classes are arranged very differently from north to south and from the interior to the river-shaped outer edge.
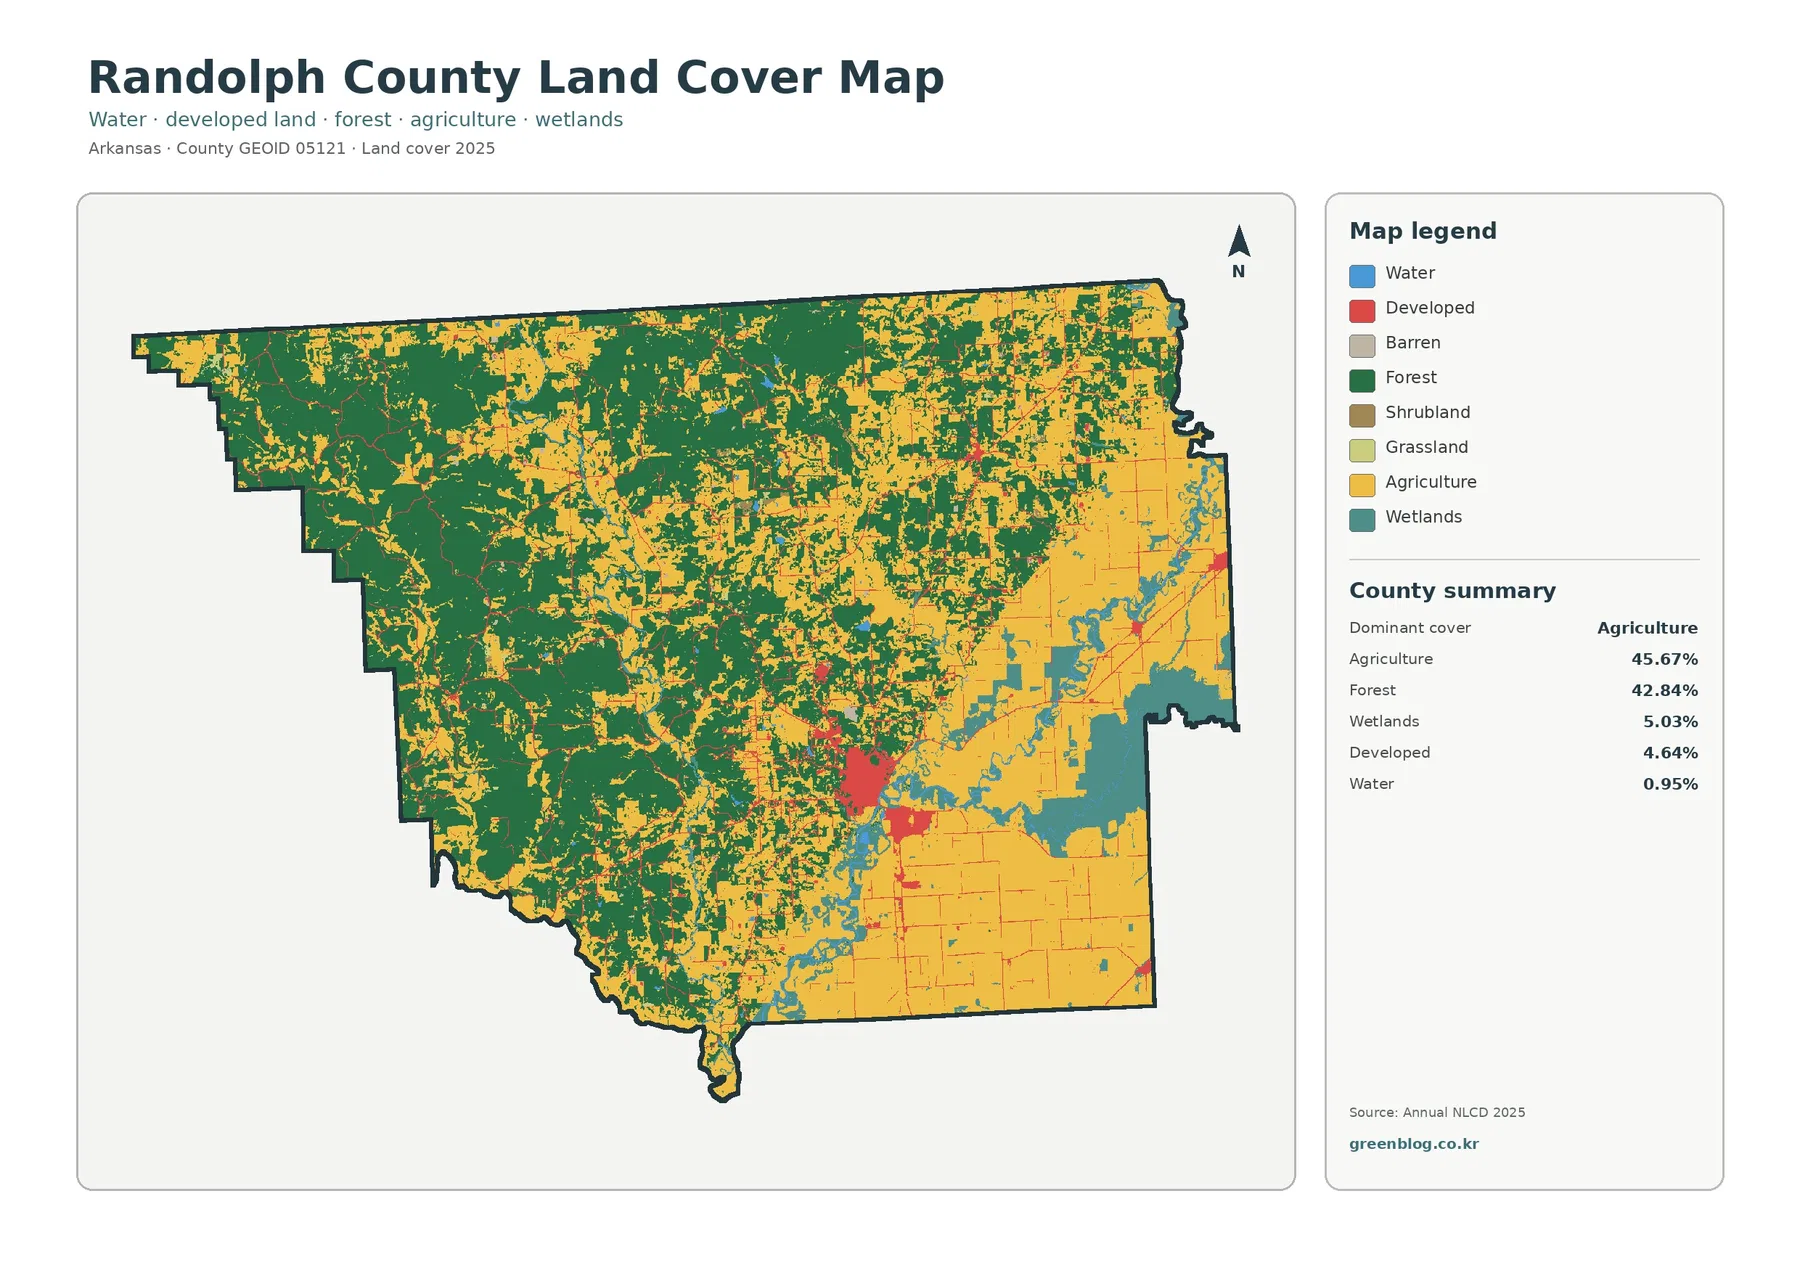
The northern half contains the largest uninterrupted blocks of cropland. Forest becomes more frequent across the central and southern portions, where green patches and larger wooded blocks break up the yellow agricultural areas. Water and wetland colors are especially conspicuous along the west and southwest, while developed areas appear as separated clusters rather than one continuous urban blanket. That combination makes Randolph County a useful example of why a county average should not be mistaken for a description of every part of the county.
Reading the 2025 Land-Cover Mosaic
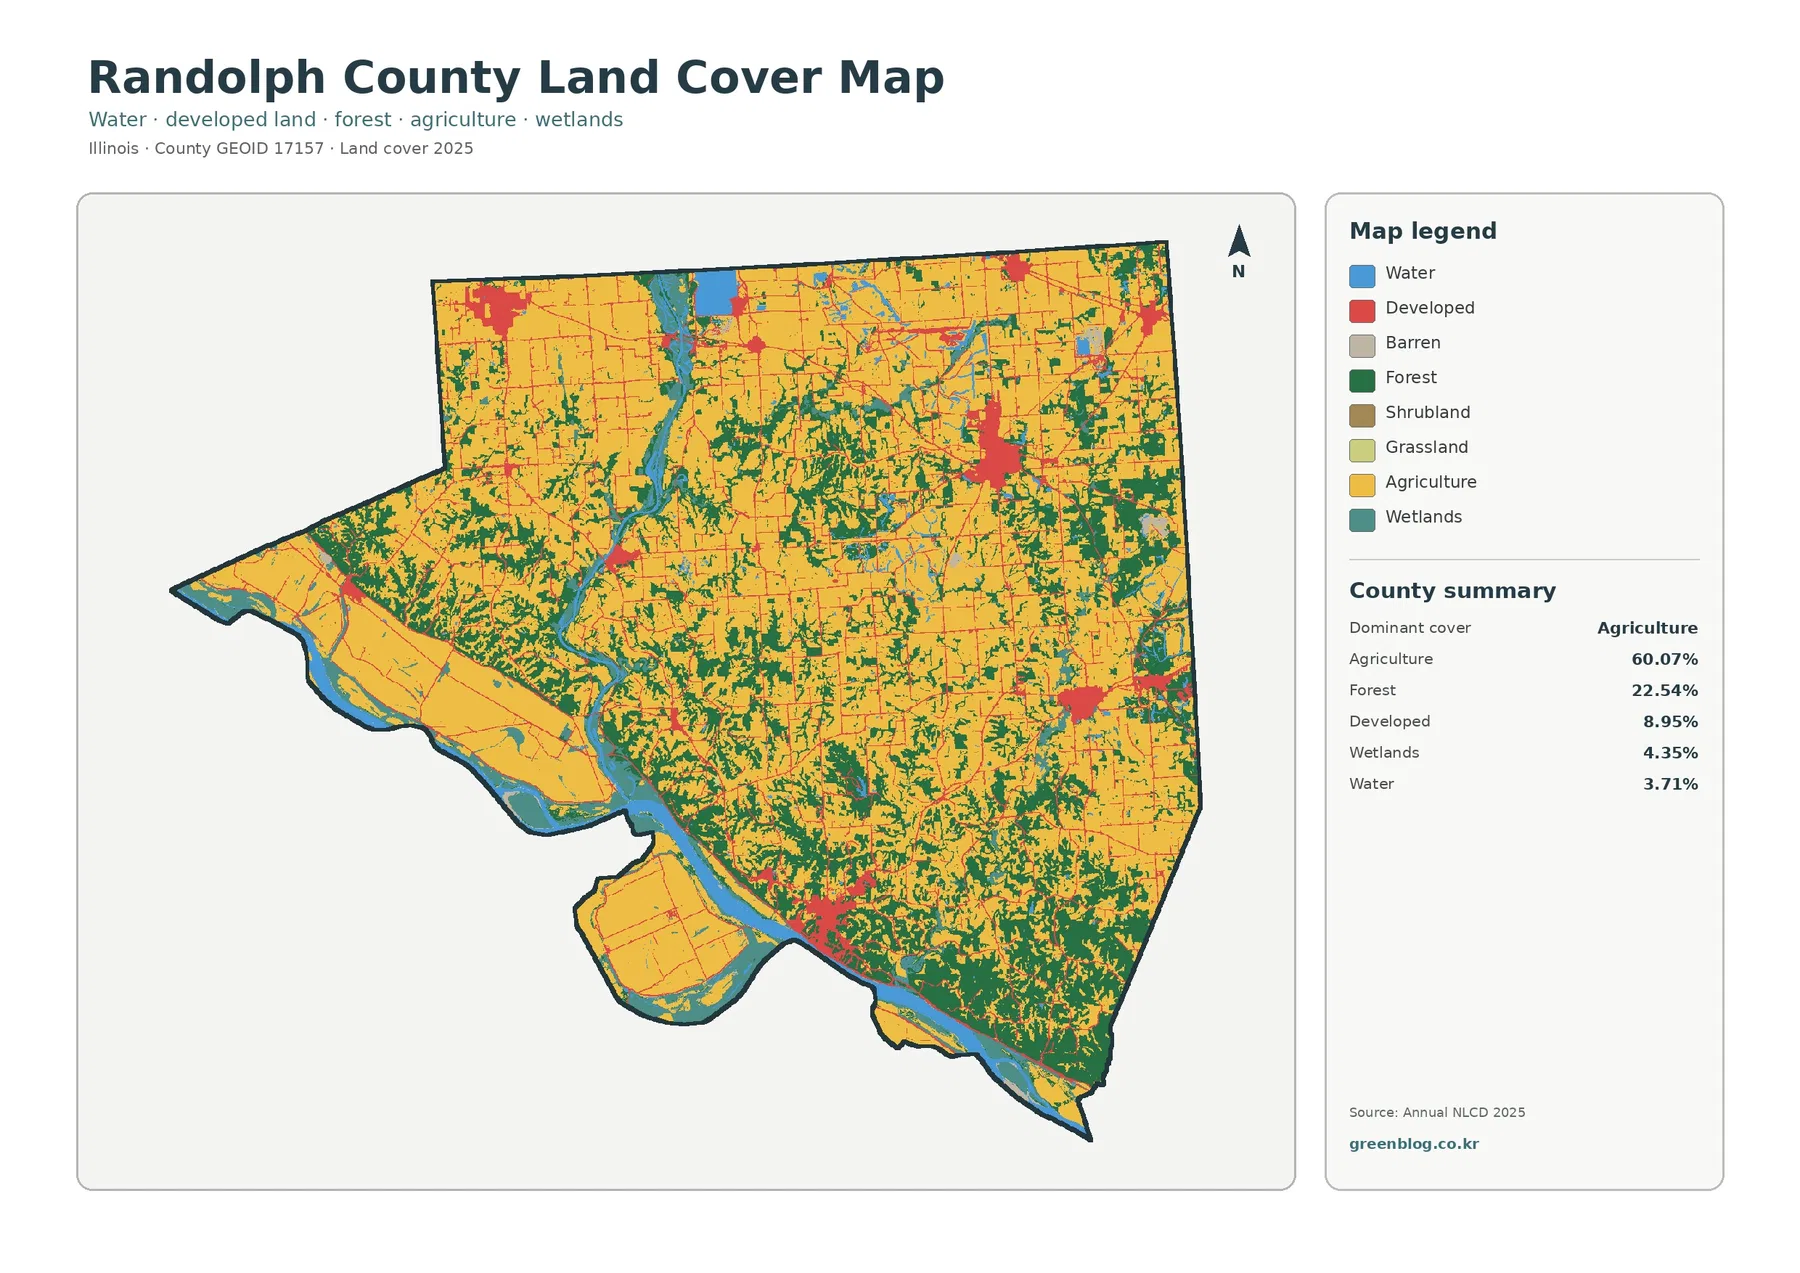
The general map works best as the first reference because it shows all major classes at once. Yellow agricultural cover fills much of the north and center, but it is repeatedly interrupted by green forest, blue water, teal wetlands, and red developed land. The western projection is particularly distinctive: farm fields extend toward the outer edge while water, wetlands, and wooded strips create a very different texture from the large agricultural blocks farther north.
Developed land is not spread evenly across the county. A larger red concentration stands near the northwest, another cluster appears toward the upper center, a prominent concentration lies east of the middle, and additional developed patches occur toward the southeast and along the southern margin. Thin red lines also follow parts of the road network. These patterns show where development and transportation surfaces occur together, but the map alone does not establish what caused the development.
Water covers 3.71% and wetlands 4.35%, modest shares compared with agriculture and forest. Even so, the two classes strongly shape the map because they form long corridors and edge features. Blue and teal are visible around the western and southern boundary and along an internal north-to-south water corridor. This is a good reminder that a small percentage can be geographically important when it is concentrated in connected places rather than scattered in tiny pieces.
Where the 60% Farm Landscape Gives Way to Woods
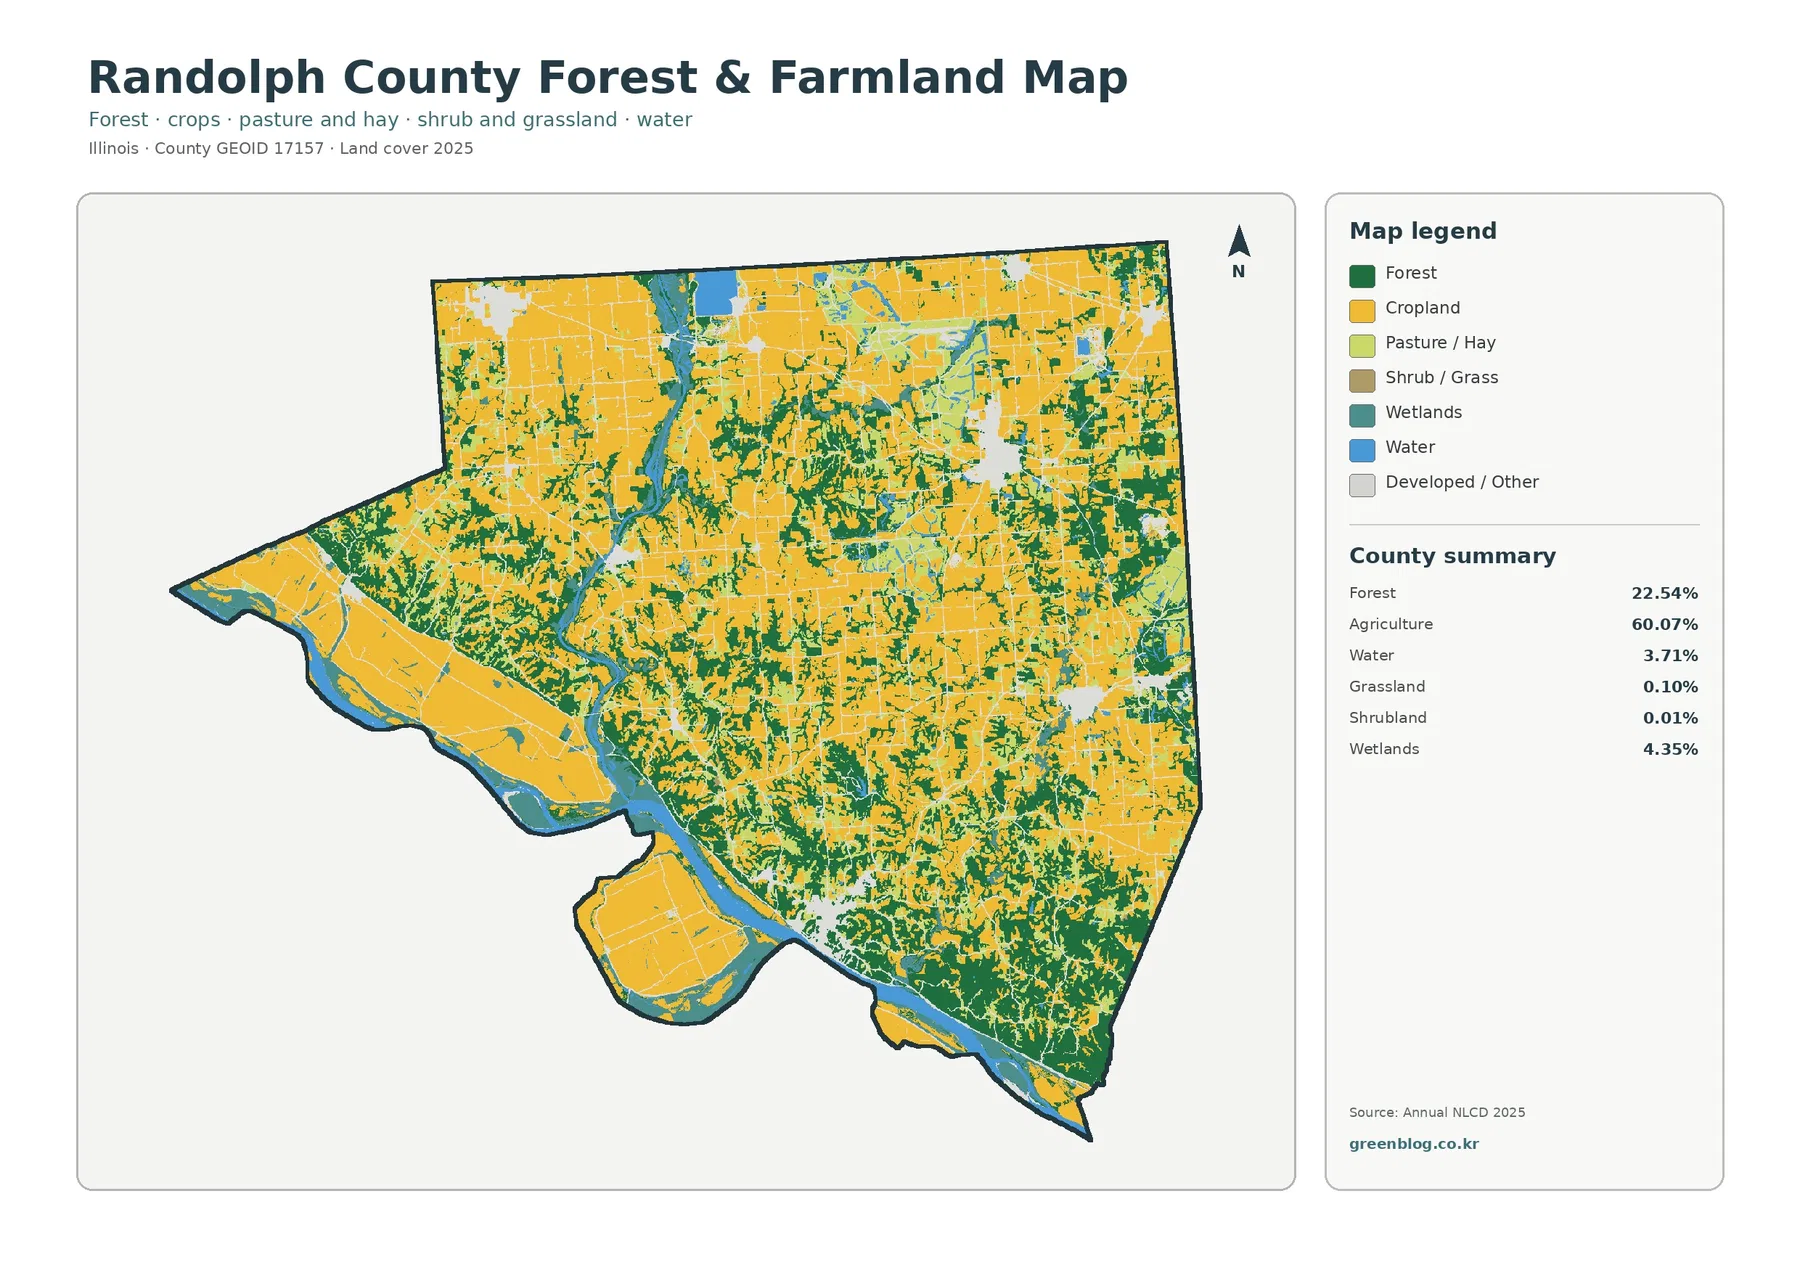
The forest-and-farmland map removes much of the visual competition from the developed classes and makes the county’s two largest covers easier to compare. Cropland dominates broad northern and central areas, while forest is much more continuous in the south and southeast. Smaller wooded branches reach into agricultural areas, and the western side contains alternating bands of farm fields, woodland, water, and wetlands rather than one simple land-cover block.
Forest is 22.54% countywide, but that number does not describe its shape. Some wooded areas form large connected masses, especially in the lower half of the county. Elsewhere forest occurs as narrow branching strips or small patches within farmland. For habitat or watershed discussions, that distinction matters because a connected block and a scattered patch can have very different roles even when both count toward the same forest percentage.
Grassland accounts for 0.10% and shrubland for only 0.01% in the supplied summary. Those classes are therefore minor parts of the overall picture and should not be given the same weight as agriculture, forest, wetlands, or water. Wetlands, in contrast, make up 4.35% and create visible bands around water-rich edges. The map is most useful when the legend is read selectively: start with the dominant classes, then use the smaller classes to explain local transitions.
Impervious Surface Reveals a Much Smaller Built Footprint Than Developed Cover Alone
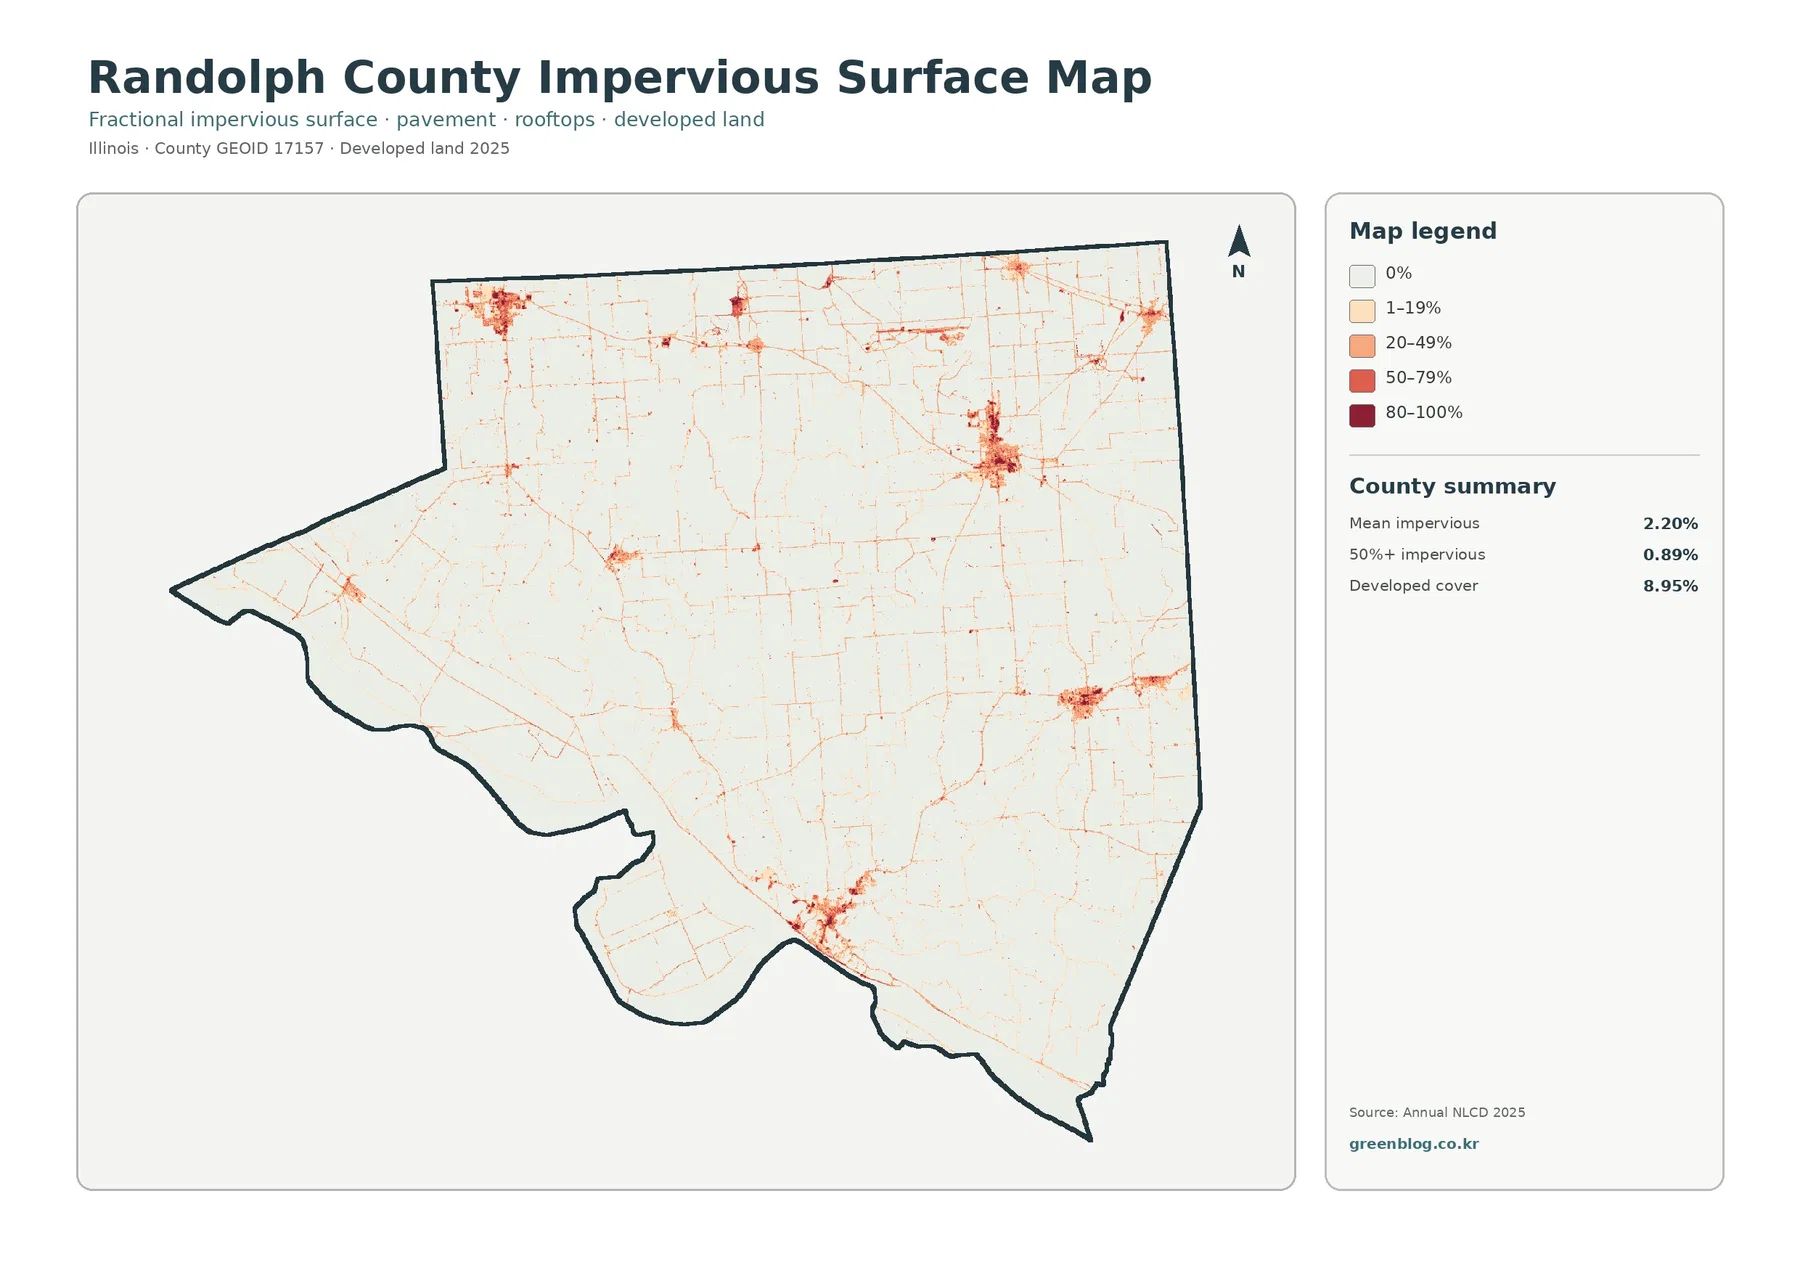
Impervious surface means ground covered by materials such as pavement, rooftops, and other hard surfaces that do not absorb water readily. Randolph County has a mean impervious value of 2.20%, and areas with at least 50% impervious cover make up 0.89%. Those figures are much lower than the 8.95% developed-cover share because a developed land-cover class can also contain lawns, trees, bare ground, and other surfaces that still allow some infiltration.
The darkest concentrations appear in a limited number of built clusters rather than across the rural landscape. The northwest, upper-center, east-central, southeast, and southern portions contain the most visible high-intensity patches. Between them, pale lines trace roads through otherwise low-impervious farmland and forest. The pattern is therefore one of isolated built concentrations linked by linear surfaces, not a county covered continuously by pavement.
This map should not be used by itself as a flood, drainage, or stormwater-risk map. Imperviousness is one piece of those questions, but elevation, soil, drainage infrastructure, rainfall, and water levels are also important. Its strongest use here is comparative: by switching between the general land-cover map and the impervious view, a reader can distinguish areas classified as developed from the smaller places where hard surfaces are actually concentrated.
Most of the 1985–2025 Difference Is Not Labeled as Development, Forest Loss, or Agricultural Loss
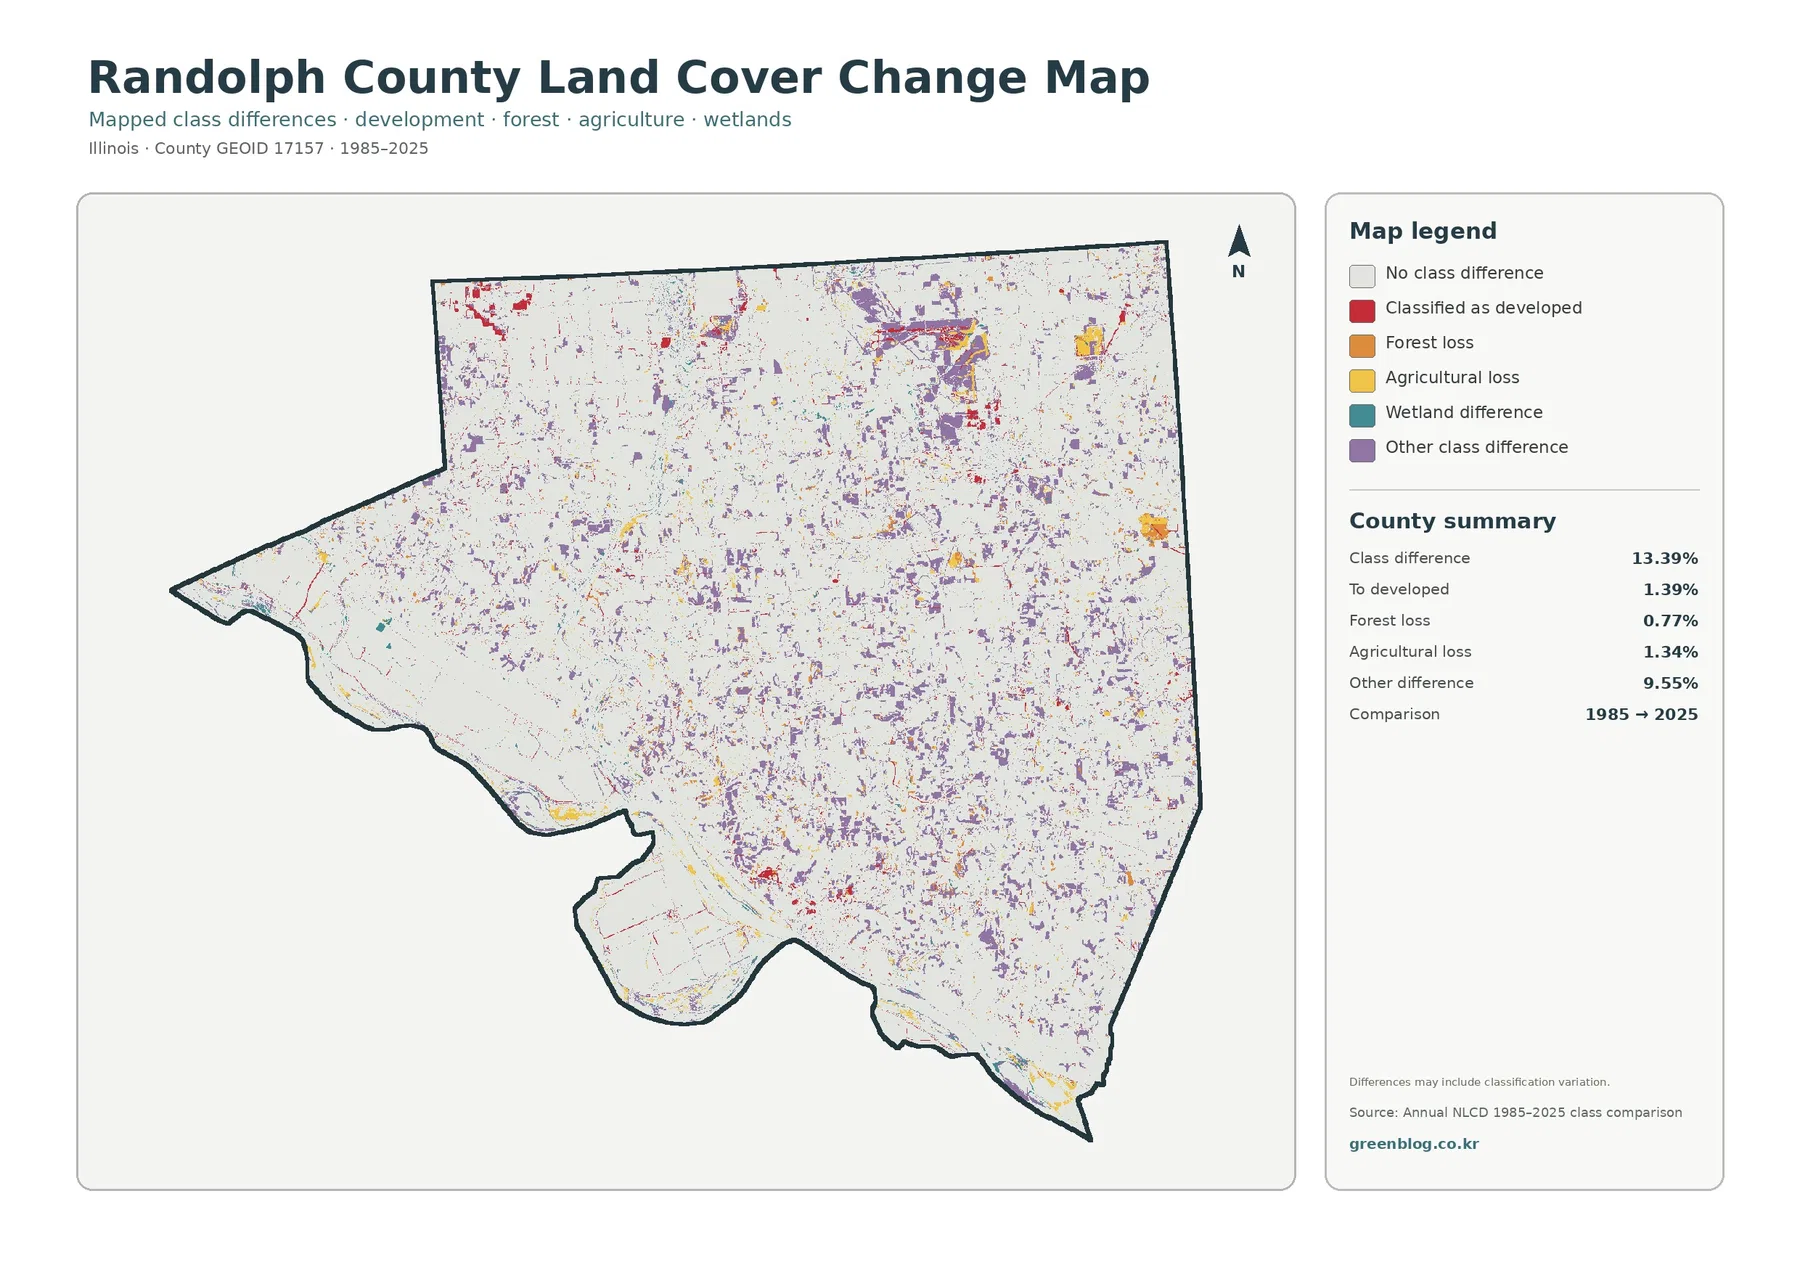
The supplied comparison reports class differences across 13.39% of the county between 1985 and 2025. Of that total, 1.39% is classified as a change to developed land, 0.77% as forest loss, and 1.34% as agricultural loss. The largest category by far is “other class difference” at 9.55%. That breakdown is essential because the 13.39% total cannot be treated as a 13.39% urban-growth rate or a 13.39% loss of natural land.
Purple other-difference cells are scattered widely across the county, while red developed-change cells form smaller concentrations and lines. Orange forest-loss and yellow agricultural-loss patches also appear in several areas, but their summarized percentages are comparatively limited. Wetland difference is included in the legend, yet no exact wetland-difference percentage is provided in the county summary. For that reason, its mapped locations can be discussed, but an unsupported number should not be added.
The map also warns that differences may include classification variation. A pixel that changes from one class to another in the two datasets is not automatically proof that a specific real-world event occurred there. Small differences can reflect mixed land cover within a grid cell, imagery conditions, or how similar surfaces were assigned to categories. A site-level change claim would need aerial imagery, local records, or another time series in addition to this countywide comparison.
The Western and Southern Edge Carries More Land-Cover Variety Than the County Average Suggests
The county outline bends sharply along the west and south, and the land-cover map shows water and wetlands following much of that irregular edge. Farm fields remain present close to the boundary, but they share the landscape with wooded strips and wet areas. The result is a narrow zone where several classes sit close together, unlike the broad agricultural blocks in the northern interior.
Woodland also grows more prominent across the southern half. On the forest-and-farmland map, green expands into larger blocks and branching corridors, while cropland becomes less visually dominant than it is in the north. If only the countywide 60.07% agriculture figure were used, this north-south contrast would be easy to miss. The map is valuable precisely because it shows how one statistic can represent several different local landscapes.
Water, wetlands, and forest often appear close together along the outer edge, but proximity should not be turned into a causal statement without another source. The maps establish spatial association: these classes occur next to one another and form connected-looking corridors. They do not establish ownership, legal wetland status, floodplain boundaries, or the exact ecological condition of those areas.
A Practical Way to Compare the Four Maps Without Mixing Their Meanings
Start with the current land-cover map when the question is broad. It answers where agriculture, forest, developed land, wetlands, and water are located in 2025. Move to the forest-and-farmland map when the main issue is the balance between cropland and woods. That second view removes much of the visual noise and makes the southern forest concentration and the branching wooded corridors easier to see.
Use the impervious map for a different question: how concentrated are hard built surfaces inside the developed landscape? A red developed patch on the general map can contain areas with relatively little pavement or rooftop cover, so the impervious map refines the interpretation. The change map then adds time, but only as a comparison of mapped classes between two years. It should not be used as a substitute for the 2025 current-condition maps.
For a presentation, it is usually clearer to enlarge the map that answers the primary question and use one other view as a comparison. Four small maps on one slide can make the legends difficult to read. A current-cover map paired with the impervious map works well for developed-land questions, while the forest-and-farmland map paired with the change map can separate today’s pattern from the locations where classifications differ across time.
Land Cover Is Not Zoning, Ownership, or a Parcel Survey
Land cover describes what the surface is classified as—forest, agriculture, water, wetland, developed land, and related classes. It does not say how a parcel is zoned, who owns it, whether construction is allowed, or whether a wet area meets a legal regulatory definition. Those questions require different datasets and, in many cases, local government or site-specific information.
The maps are also generalized raster products. Each grid cell represents an area rather than an exact property boundary. A narrow road, small stream, isolated building, or small patch of vegetation can be simplified or mixed with nearby surfaces. When multiple cover types fall within one cell, the final classification may not reflect every feature visible on the ground.
The 2025 maps describe the supplied 2025 dataset, not changes that happened after that observation period. The 1985–2025 comparison carries an additional caution because its “other class difference” category is much larger than the specific development, forest-loss, and agricultural-loss categories. Countywide maps are best used to locate broad patterns and places for follow-up, not to make a final decision about a particular property.
Choosing the Right JPG for Printing, Teaching, or Reference
The download contains four original JPG files, one for each map view, at 2480×1754 pixels. If a document needs one overview image, the 2025 general land-cover map is the most complete starting point. The forest-and-farmland file is better when agriculture and woodland are the main subjects, while the impervious map is useful for built-surface concentration and the change map is suited to a clearly labeled two-date comparison.
Keep the legend and title visible when cropping for a slide or worksheet. The change map in particular should retain the 1985→2025 comparison label so that viewers do not mistake it for a current-condition map. Enlarging the JPG can make the image easier to see, but it does not add parcel-level information that was absent from the underlying classification.
Frequently Asked Questions
What is the largest land-cover class in Randolph County?
Agriculture is the largest 2025 class at 60.07%, followed by forest at 22.54%. The percentages do not mean every part of the county looks agricultural, however. The southern half is noticeably more wooded, and water and wetlands form strong features along the western and southern edge.
Why is developed cover 8.95% while mean impervious surface is only 2.20%?
Developed land is a land-cover category that can include both hard surfaces and permeable areas such as lawns or trees. Impervious surface measures the share covered by pavement, rooftops, and similar hard materials. They describe related but different properties, so the percentages are not expected to match.
Does the 13.39% class difference mean 13.39% of the county was developed between 1985 and 2025?
No. Only 1.39% is summarized as a change to developed land. The largest part of the 13.39% total is other class difference at 9.55%, and the map notes that classification variation can be included. A real-world development claim should be checked with additional time-series or local evidence.
Sources and Reference Data
- MRLC Annual NLCD Data – annual land-cover datasets used for current and comparison mapping
- USGS Annual NLCD Land Cover Classification – explanation of land-cover classes and classification framework
- U.S. Census Bureau TIGER/Line Shapefiles – county boundary reference data
Map File Information
Download four original JPG maps covering Randolph County’s 2025 land cover, forest and farmland, impervious surface, and 1985–2025 class differences.
- Included Files: Use only the versions confirmed in the article and supplied images
- File Type: Use the confirmed download contents
- Intended Use: Printing, education, presentations, and map-based projects
Related Maps
- Adams County Illinois Land Cover Map
- Alexander County Illinois Land Cover Map
- Bond County Illinois Land Cover Map
Green Map creates custom-edited map images using open geographic data sources such as geoBoundaries, Natural Earth, OpenStreetMap, and government open data.
These maps are edited visual materials, not raw data files, and are provided for education, documents, presentations, and graphic reference.