Marshall County, Illinois is dominated by agriculture in the 2025 land-cover summary, but the map does not look like an uninterrupted farm sheet. Agriculture accounts for 77.04% of the county, while a broad water corridor just west of the center is bordered by conspicuous forest and wetland cover. Forest represents 10.90%, developed land 6.47%, water 2.74%, and wetlands 2.48%. Because several of the smaller classes are concentrated along the same corridor, they stand out more strongly on the map than their countywide percentages might suggest.
The page provides four related views: current land cover, a simplified forest-and-farmland map, impervious surface and developed land, and a 1985–2025 class-difference map. The original four JPG files are available together in one download, while the WebP versions below are convenient for on-page comparison. Using the views separately helps keep present cover, paved or roofed surface, and historical class difference from being treated as the same thing. Here, land cover describes what is mapped on the surface; it does not establish zoning, ownership, parcel boundaries, or development rights.
Table of Contents
A mostly agricultural county is split visually by water, woods, and wetlands
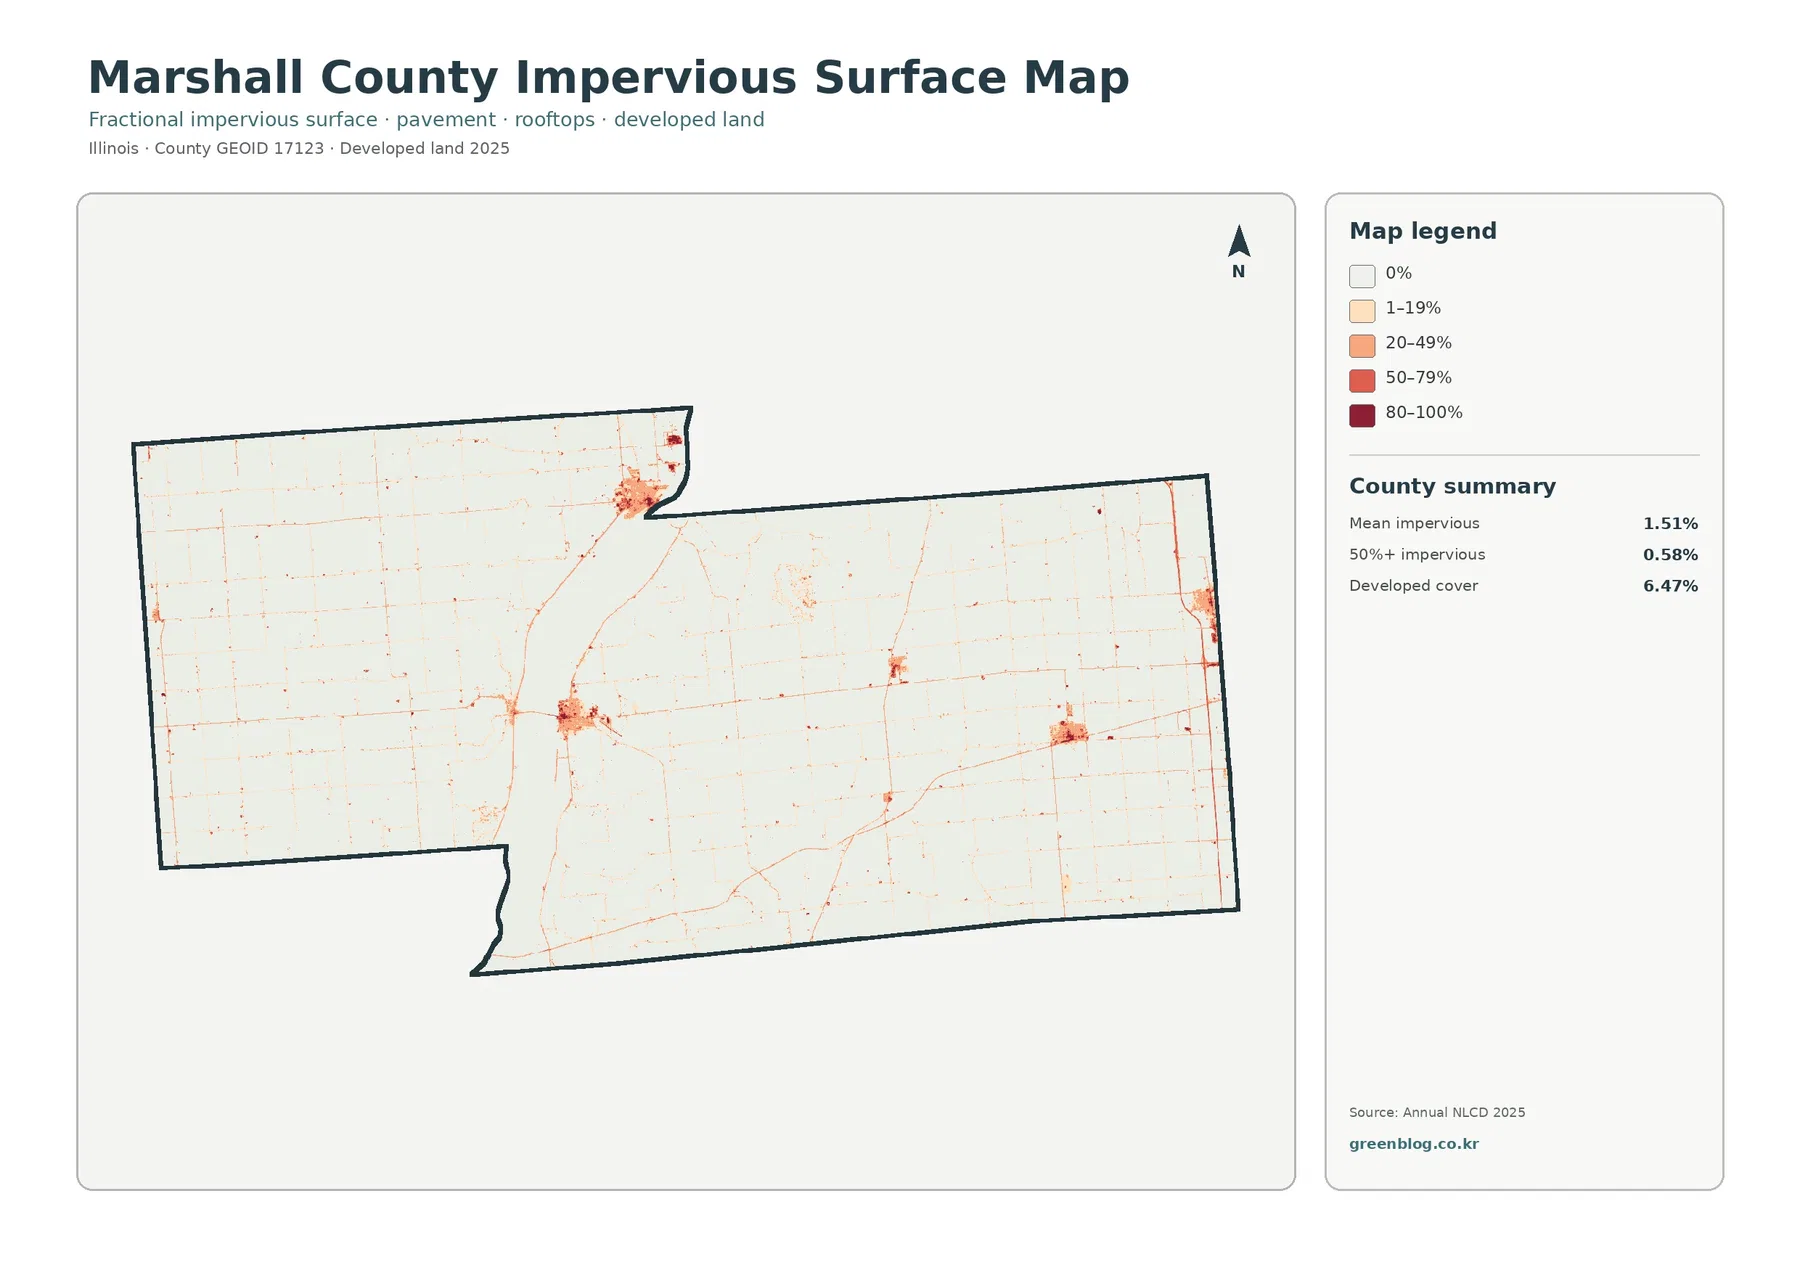
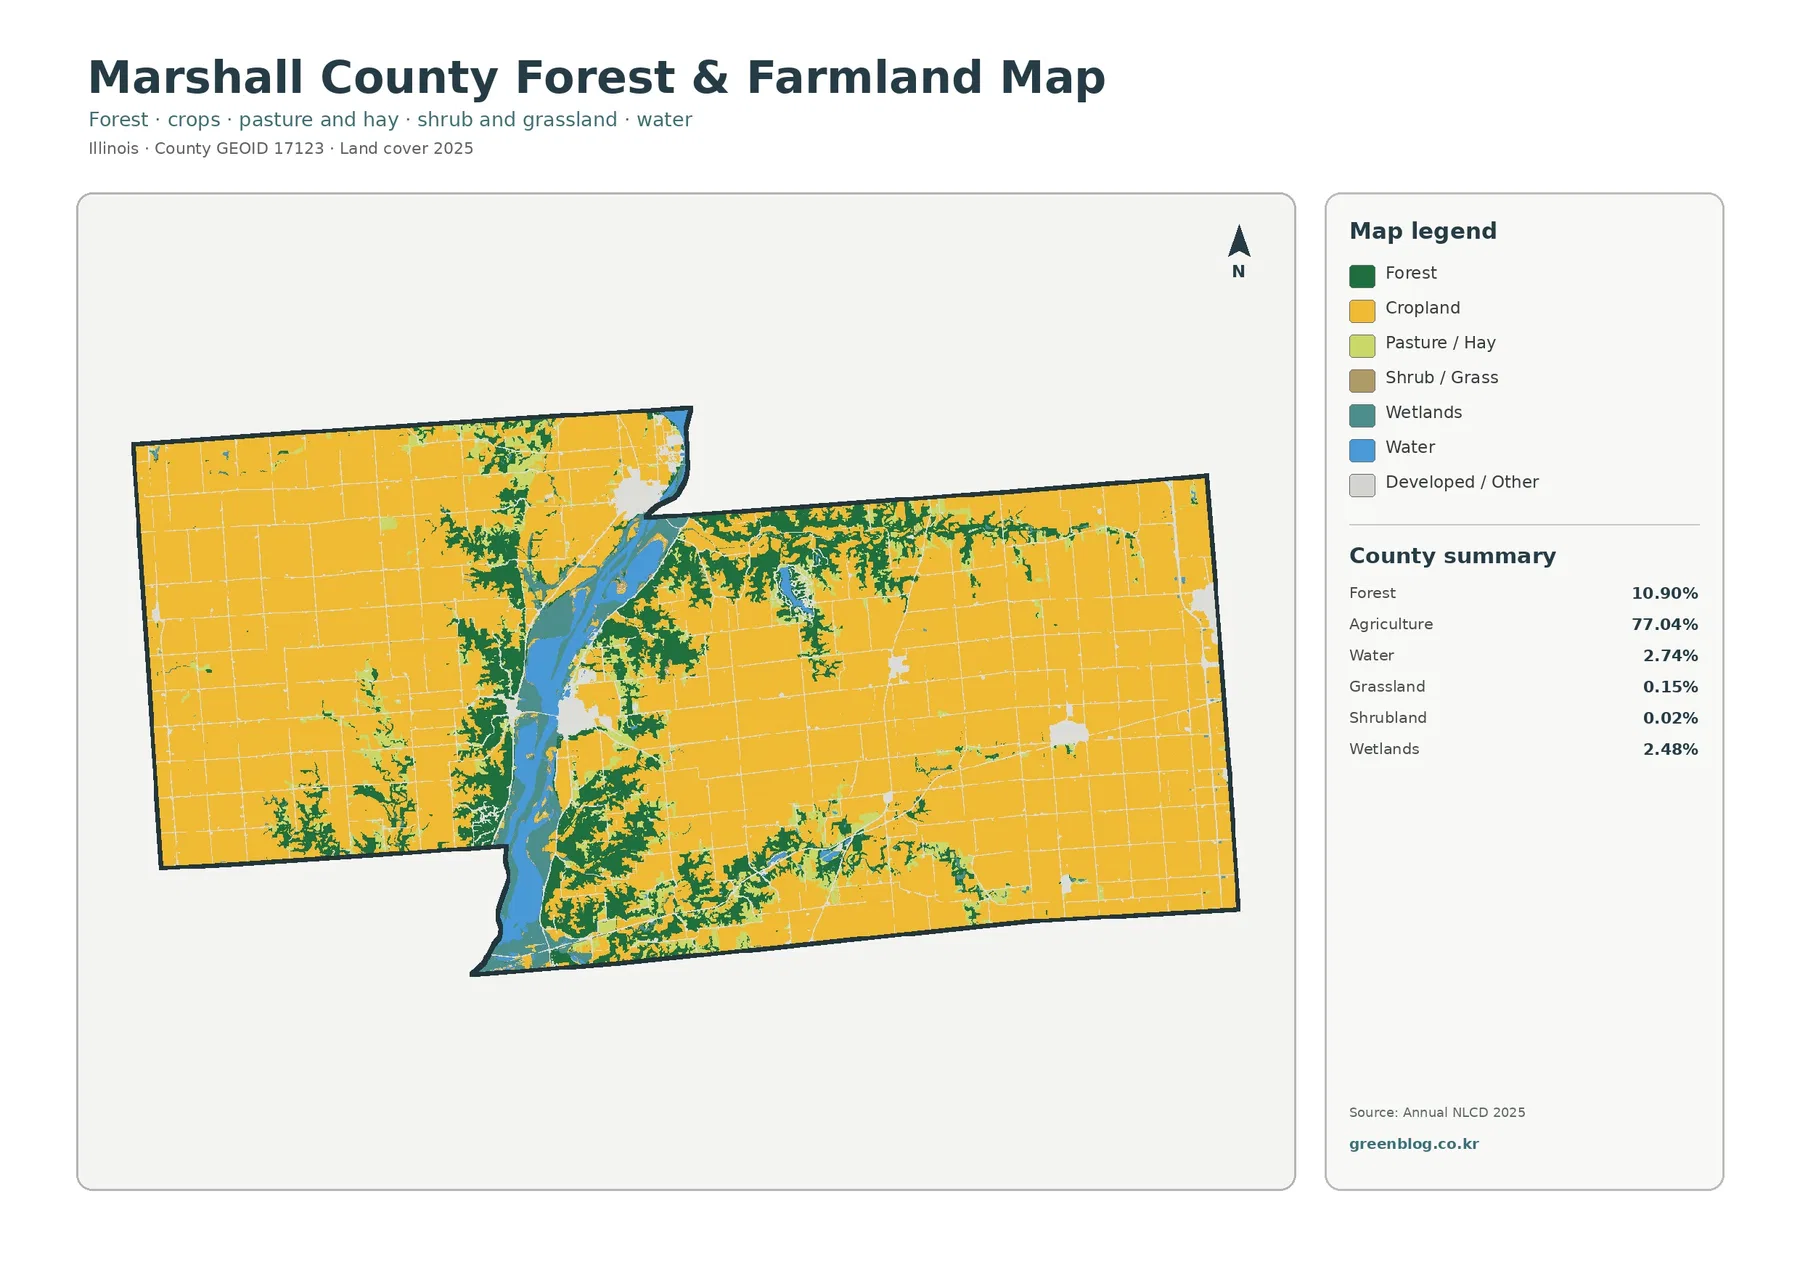
The general 2025 map shows large agricultural areas on both sides of the central-western water corridor. Yellow cover extends across most of the east and much of the west, giving the county a strong farm-grid appearance. The broad blue area breaks that continuity, and dark green forest frequently hugs its edges. Teal wetland patches are mixed with the water and wooded margins, so the middle of the map has a much more varied appearance than the outer agricultural blocks.
Forest is not limited to the immediate water edge. Green cover spreads outward in irregular branches in the southwest and appears in smaller strips through the north-central part of the county. The eastern half contains broad farm areas with fewer large wooded blocks, though smaller forest traces still interrupt the yellow background. This uneven distribution matters: the 10.90% forest share is modest compared with agriculture, yet its concentration in connected-looking bands makes it easy to recognize at county scale.
Developed land, at 6.47%, is more fragmented. Red clusters appear near several points along or close to the central corridor, with additional compact areas in the north-central and eastern portions of the county. Thin red lines also follow parts of the road grid. Water and wetlands together occupy only a small share of total area, but the broad central feature gives them a clear geographic role. Reading the percentages beside the visible distribution is therefore more informative than judging importance by color alone.
Impervious surface separates compact built centers from the wider developed class
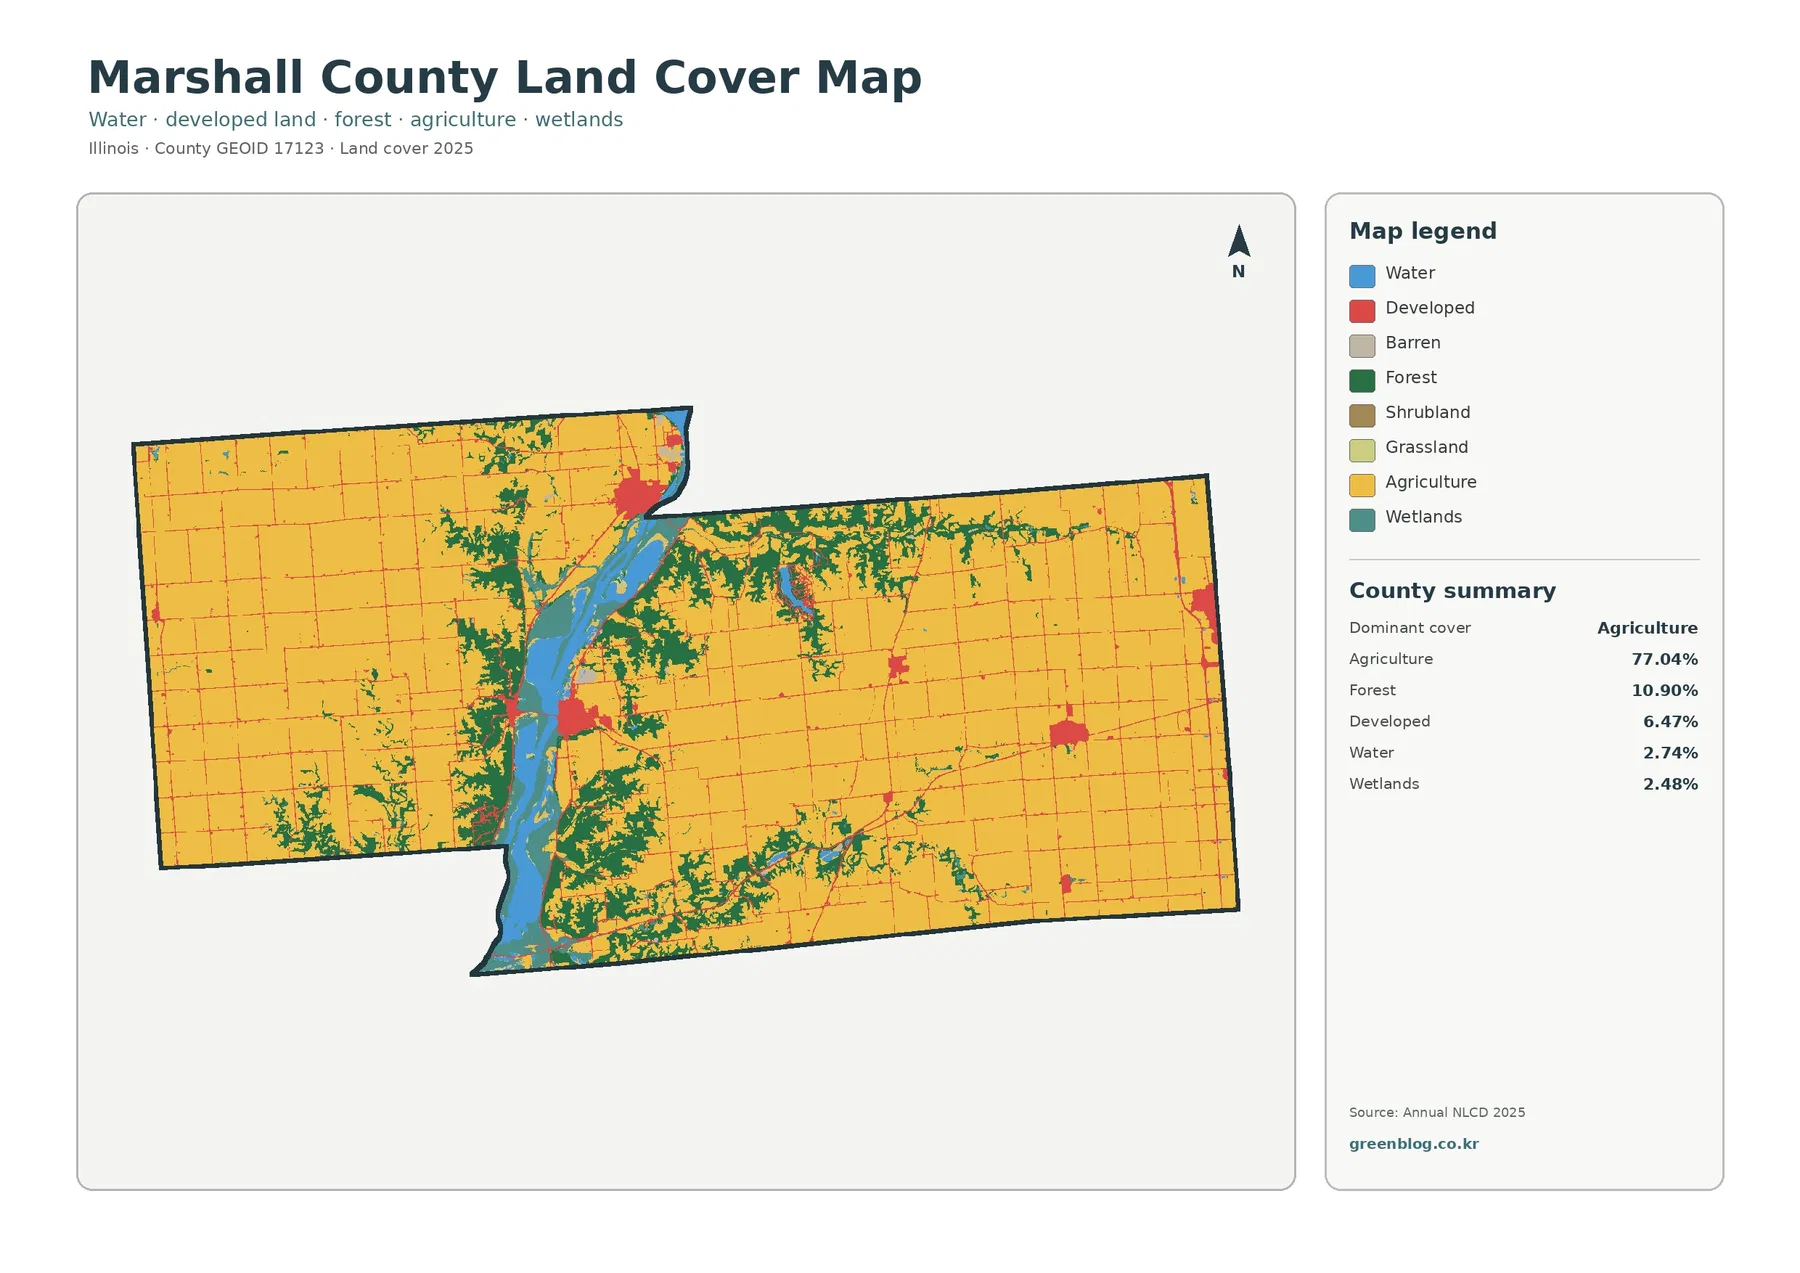
Impervious surface answers a narrower question than the general land-cover map. On this page, impervious surface means pavement, rooftops, parking areas, and other surfaces that do not readily absorb water. Most of Marshall County is nearly white on this map, consistent with the large agricultural share. Higher values gather in several compact clusters, and lighter linear traces extend along parts of the road network. The strongest concentrations are limited rather than forming a continuous urban field.
The county summary reports mean impervious surface of 1.51%. Only 0.58% of the county is mapped above 50% impervious, even though developed cover occupies 6.47%. Those figures are not contradictory because a developed land-cover class can include lawns, trees, soil, and other permeable surfaces. A cell can therefore be developed without being mostly pavement or roof. For locating concentrations of hard surface within developed land, this separate layer is more useful than the broader developed category.
A few darker centers sit near the water corridor, while other small concentrations appear toward the north-central area, the middle of the eastern half, and near the far eastern edge. The map also reveals thin routes between some clusters, but the supplied material does not name individual roads, so those lines should not be assigned specific route identities from the image alone. For stormwater context or a broad comparison of built intensity, the map gives a useful first view. Site design and drainage decisions still require finer local information.
The forest-and-farmland view clarifies why the water corridor feels greener than the rest of the county
When the developed and miscellaneous classes are muted, the relationship among farmland, forest, water, and wetlands becomes much easier to follow. Cropland dominates both outer portions of the county. Along the broad blue water feature, however, green forest forms repeated margins and wider patches. The southwest contains several wooded extensions reaching into the agricultural area, while the northern side of the corridor also carries a noticeable belt of forest.
In a simplified summary, agriculture accounts for 77.04% and forest for 10.90%. Water accounts for 2.74%, wetlands 2.48%, grassland 0.15%, and shrubland 0.02%. Grass and shrub classes are so small that they do not define the countywide picture. The stronger contrast comes from large farm blocks meeting the water-and-forest corridor. This map is particularly helpful when a reader wants to trace those boundaries without the red developed class competing for attention.
These colors should remain tied to land-cover meaning. Agricultural cover does not identify a crop, farm operator, field ownership, or current cultivation decision. Forest does not indicate public land, conservation status, or a management plan. Wetland classification is likewise not a regulatory wetland determination. The value of the map is that every part of the county is classified with a consistent surface-cover scheme, allowing broad distribution to be compared before more specialized records are consulted.
The 1985–2025 comparison marks a 5.38% class difference rather than a single type of conversion
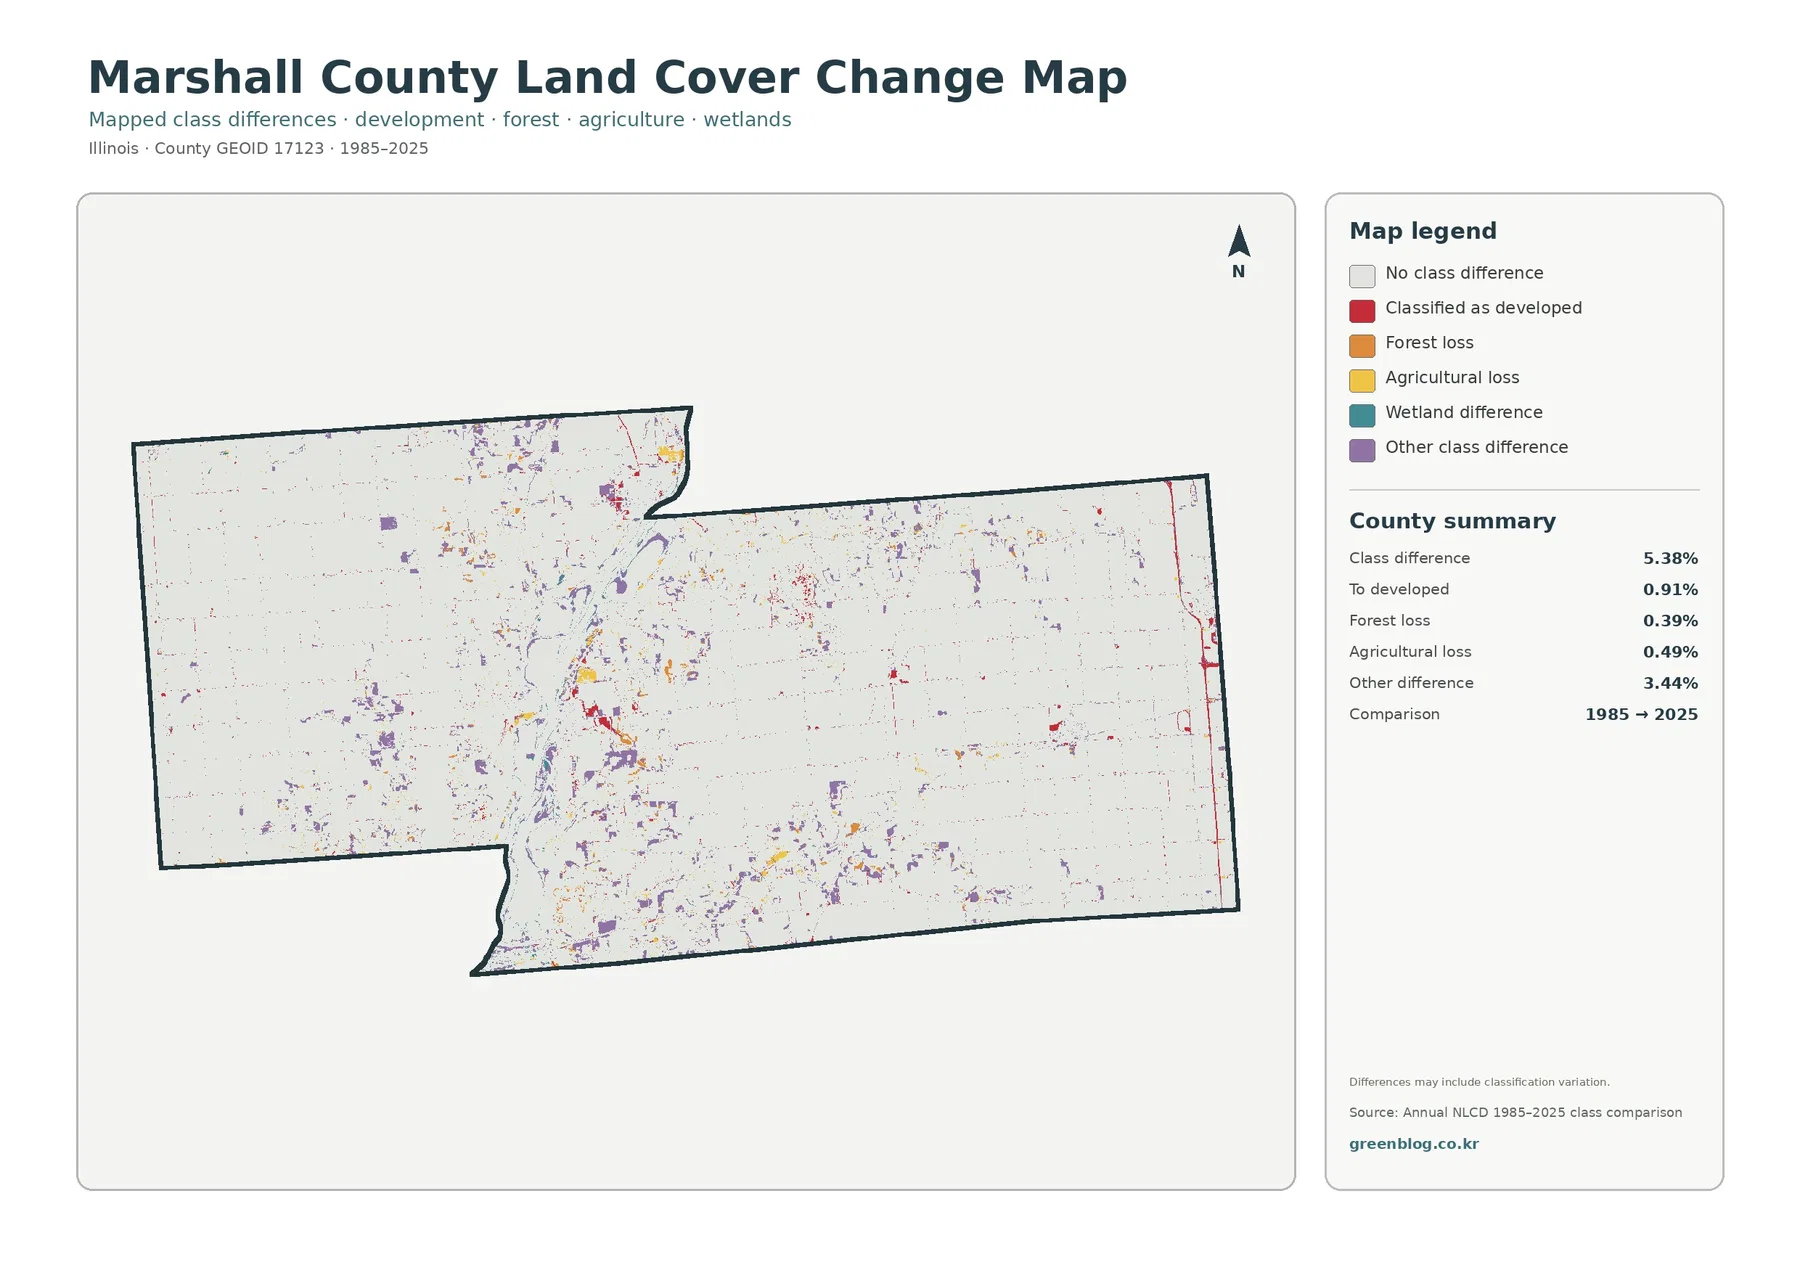
The historical comparison does not repaint the current landscape. It highlights cells whose representative land-cover class differs between 1985 and 2025. Marshall County’s total class difference is 5.38%. Within that figure, 0.91% is summarized as change to developed, 0.39% as forest loss, and 0.49% as agricultural loss. The largest named portion is the 3.44% grouped as other class difference, which is an important reason not to describe the entire 5.38% as development or farmland conversion.
Purple other-difference cells are scattered through several parts of the county, with many appearing around the central corridor and across portions of the south and north. Red change-to-developed cells tend to be small and are often near present developed clusters or thin linear features. Orange forest-loss and yellow agricultural-loss cells are also dispersed rather than forming one broad continuous zone. Against the current map’s extensive agricultural background, the comparison reads as many localized differences rather than a countywide replacement of one cover by another.
The map itself warns that mapped differences may include classification variation. That caution matters along complicated edges where water, wetlands, forest, roads, and fields meet within a small area. A raster cell may be assigned a different dominant class because of mixed surface conditions or classification differences, even when the physical change is subtle. The reverse is also possible: a place that changed during an intermediate year and later returned to a similar class may not stand out in an endpoint-only comparison.
Cross-checking the same location prevents current cover from being confused with built intensity or change
The broad water corridor provides the clearest place to compare all four images. On the general map, water, wetlands, forest, agriculture, and developed land appear together. Removing much of the developed visual detail in the forest-and-farmland view makes the green margins along the water more obvious. Switching to an impervious-surface layer strips the picture down further, leaving only compact concentrations of hard surface and thin routes. None of these versions replaces the others because each is describing a different property of the same ground.
Read the change map last when making that comparison. A present-day developed cluster is not automatically a place that became developed after 1985. Only the red cells in the change image represent the supplied change-to-developed category between the two endpoints. Likewise, a current forest patch does not reveal whether the surrounding cells changed classification during the period. Keeping the current maps beside the historical comparison makes these distinctions visible without requiring a long technical explanation.
The large eastern agricultural blocks illustrate the same principle from a different setting. They look almost continuous on the general map, become even simpler on the forest-and-farmland map, and fade to near-white on the hard-surface view except for small built centers and roads. Within the same area, the change map selects scattered cells rather than coloring the entire agricultural surface. For classroom graphics or comparative county work, this side-by-side approach is more reliable than trying to summarize four measurements with one image.
Thirty-meter raster cells generalize narrow shorelines, wooded edges, and small developed features
Annual NLCD land cover is raster data. In simple terms, the land is represented as a grid of cells, and each cell receives a representative class rather than following surveyed parcel lines. Under the supplied interpretation rules, the relevant land-cover grid is generalized at 30 meters. A single cell near the Marshall County water corridor can contain part of a field, trees, a wet edge, a road, or a developed surface. The mapped color is therefore a summary of that cell, not a centimeter-by-centimeter outline.
This limitation is most noticeable where classes meet along complicated boundaries. Forest and wetlands wrap around water in narrow places, and small wooded strips extend into surrounding agriculture. At 30-meter scale, a thin feature may appear wider, narrower, interrupted, or shifted depending on which class dominates a cell. The same caution applies to small roads and compact developed patches. The maps are appropriate for county-scale comparison, but they are not parcel surveys and should not be used to measure a property boundary.
The mapped dates set another boundary. The current land-cover, forest-and-farmland, and impervious views in this package represent 2025. The comparison image uses 1985 and 2025 endpoints. It does not show the sequence of every change between those years, and it cannot include development, tree cover changes, shoreline differences, or agricultural changes after 2025. A present-day project that depends on the latest conditions should be checked against newer imagery or local records.
It also should not be substituted for land use. A developed cell does not say whether the site is residential, commercial, industrial, or institutional. Agriculture does not identify the crop or ownership, and forest does not establish public access or protection. Wetland cover on this map is a classification, not a legal wetland delineation. These distinctions keep the maps useful as consistent geographic references without making claims that the supplied data cannot support.
Frequently Asked Questions
Why do water, forest, and wetlands look so prominent if agriculture covers 77.04% of Marshall County?
The smaller classes are concentrated rather than evenly scattered. Water covers 2.74%, wetlands 2.48%, and forest 10.90%, but much of that blue, teal, and green cover gathers around the broad central-western water corridor. A long connected-looking feature can dominate the visual impression of a county map even when its total area is smaller than the farm blocks on both sides. The percentages confirm that agriculture remains dominant, while the map explains why the natural corridor is still visually strong.
How can developed land be 6.47% when mean impervious surface is only 1.51%?
Developed land and impervious surface measure different properties. A developed setting can contain grass, trees, soil, and other surfaces that still absorb water, while impervious percentage focuses on pavement, rooftops, and similar hard surfaces. Marshall County’s impervious summary also shows that only 0.58% of the county is above 50% impervious. The broader developed class is therefore expected to occupy more area than the highly paved or roofed portion of the landscape.
Does the 5.38% 1985–2025 class difference mean that 5.38% of the county was physically converted?
No. The 5.38% value is the share of cells whose representative class differs between the two endpoint maps. The supplied summary separates 0.91% as change to developed, 0.39% as forest loss, 0.49% as agricultural loss, and 3.44% as other class difference. The map also notes that classification variation may be included. Determining a precise physical conversion, year of change, or cause requires additional historical imagery or local evidence.
Keep the four JPGs together, then choose the view that matches the comparison
The download contains separate JPG files for general land cover, forest and farmland, impervious surface and developed land, and the 1985–2025 class comparison. The general map is the most complete single image for present conditions. For an agriculture-versus-forest comparison, the forest-and-farmland version is easier to read. For hard-surface intensity, use that dedicated image; the change image should be reserved for comparing the two supplied dates.
Each original JPG is listed in the asset manifest at 2480×1754 pixels. The package does not mark those source files as meeting its A3 high-resolution reference, so a large-format print should be tested before it is used as a final display piece. For screen comparison, ordinary print reference, lessons, and presentation graphics, the four files offer a convenient way to move between current land cover, dominant farm-and-forest patterns, built intensity, and historical class difference.
Keep the legends and dates with the images when they are reused. The three current views are labeled for 2025, while the change map compares 1985 with 2025. Agriculture at 77.04% and total class difference at 5.38% are both percentages, but they describe completely different measures. Storing the four maps as a set helps preserve that context and makes it easier to select the correct image without turning one percentage into a claim about another map.
Map File Information
Download the map files associated with this page for reference, printing, and compatible visual projects.
- Included Files: Use only the versions confirmed in the article and supplied images
- File Type: Use the confirmed download contents
- Intended Use: Printing, education, presentations, and map-based projects
Related Maps
Sources and Reference Data
The percentages, impervious summary, and 1985–2025 class-difference values in this article come from the supplied Marshall County maps and their legends. The official resources below provide background for Annual NLCD data, the land-cover classification system, and county boundary reference data. They support county-scale interpretation but do not replace parcel, zoning, ownership, engineering, permit, or regulatory records.
- MRLC Annual NLCD Data – official access and information for Annual NLCD products
- USGS Annual NLCD Land Cover Classification – classification categories and interpretation guidance
- U.S. Census Bureau TIGER/Line Shapefiles – county boundary and geographic reference data
Green Map creates custom-edited map images using open geographic data sources such as geoBoundaries, Natural Earth, OpenStreetMap, and government open data.
These maps are edited visual materials, not raw data files, and are provided for education, documents, presentations, and graphic reference.