Knox County, Illinois is primarily agricultural in the 2025 land-cover summary, but the county’s interior is more varied than the 74.67% agriculture share might suggest. Forest covers 15.08%, developed land 8.82%, water 0.79%, and wetlands 0.37%. A large built-up concentration in the west-central area, broad wooded tracts through the middle and east, and several small water features break up the surrounding farm grid.
This page provides four separate views of that pattern and a download containing all four original JPG maps. The general land-cover map works best for an overall county comparison. The forest-and-farmland map simplifies the relationship between fields and wooded cover, the impervious layer shows where hard surfaces are concentrated, and the 1985–2025 map identifies cells whose classifications differ between the two years.
Table of Contents
The west-central built area is the strongest local break in a 74.67% agricultural landscape
Agriculture dominates the northern half and extends across much of the southeast. Large yellow field blocks are crossed by a regular road network, with small developed nodes and forest patches scattered between them. The west-central part of the county looks very different. A large red developed cluster occupies a broad area and connects to several road corridors that extend outward through the farm landscape.
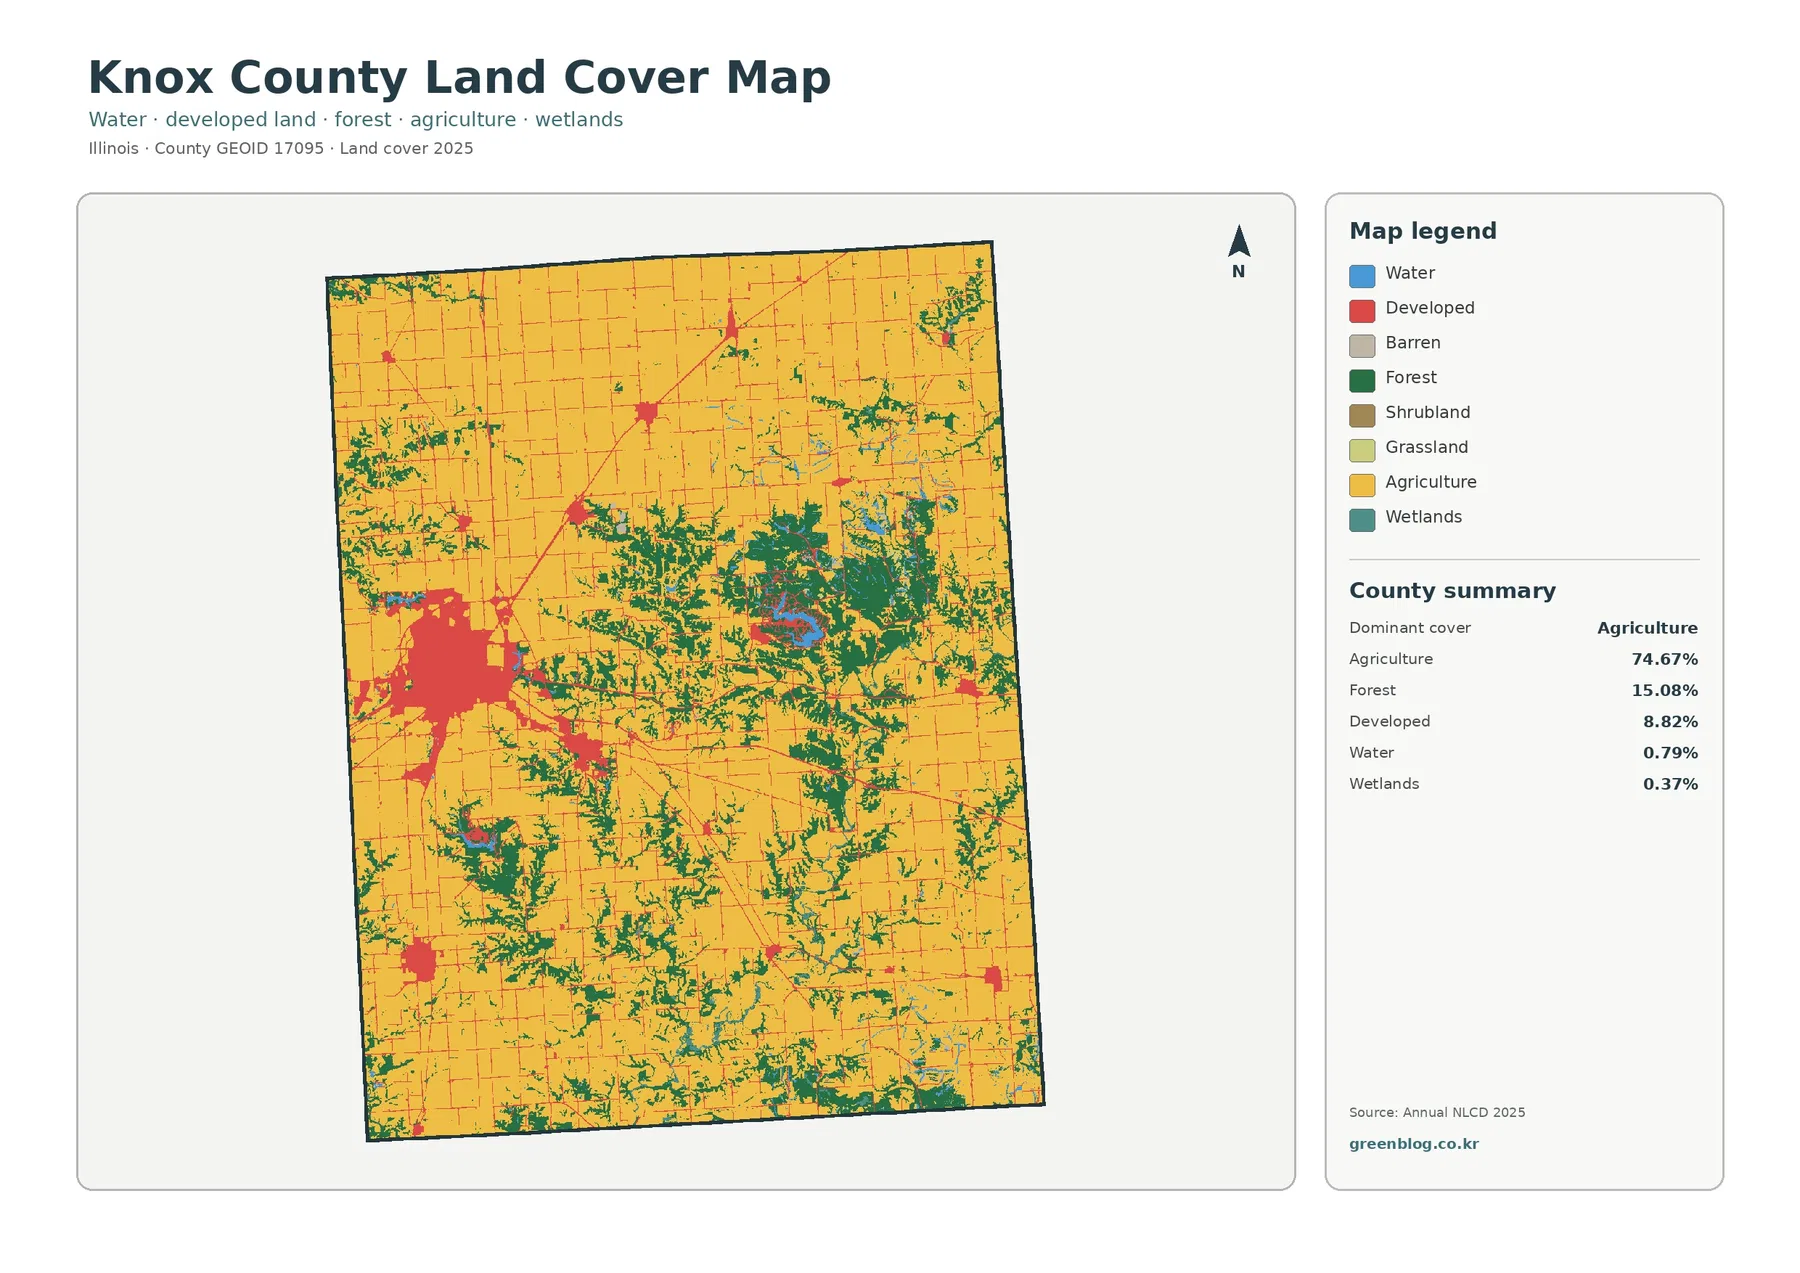
The main developed cluster is not isolated. A diagonal corridor runs northeast from it toward smaller built nodes, and other road-linked developed patches appear toward the center, south, and east. None approaches the size of the west-central core. This pattern helps explain why developed land occupies less than one-tenth of the county but still stands out strongly on the map.
Forest is most concentrated across the interior rather than along one simple edge. Large and branching green patches stretch through the central and east-central portions, with additional wooded areas in the southwest and along the southern part of the county. Several forest groups contain or border small blue water features. The result is a middle belt where fields, woods, water, and development are much more interwoven than in the broad agricultural north.
Forest corridors and water features become clearer when development is removed from the visual foreground
The forest-and-farmland view reduces developed areas to a neutral tone and makes the two largest covers easier to compare. Agriculture remains broad across the north, southeast, and many outer sections of the county. Forest is concentrated through the middle, east-central area, southwest, and southern interior, where it often forms irregular branches rather than isolated square patches.
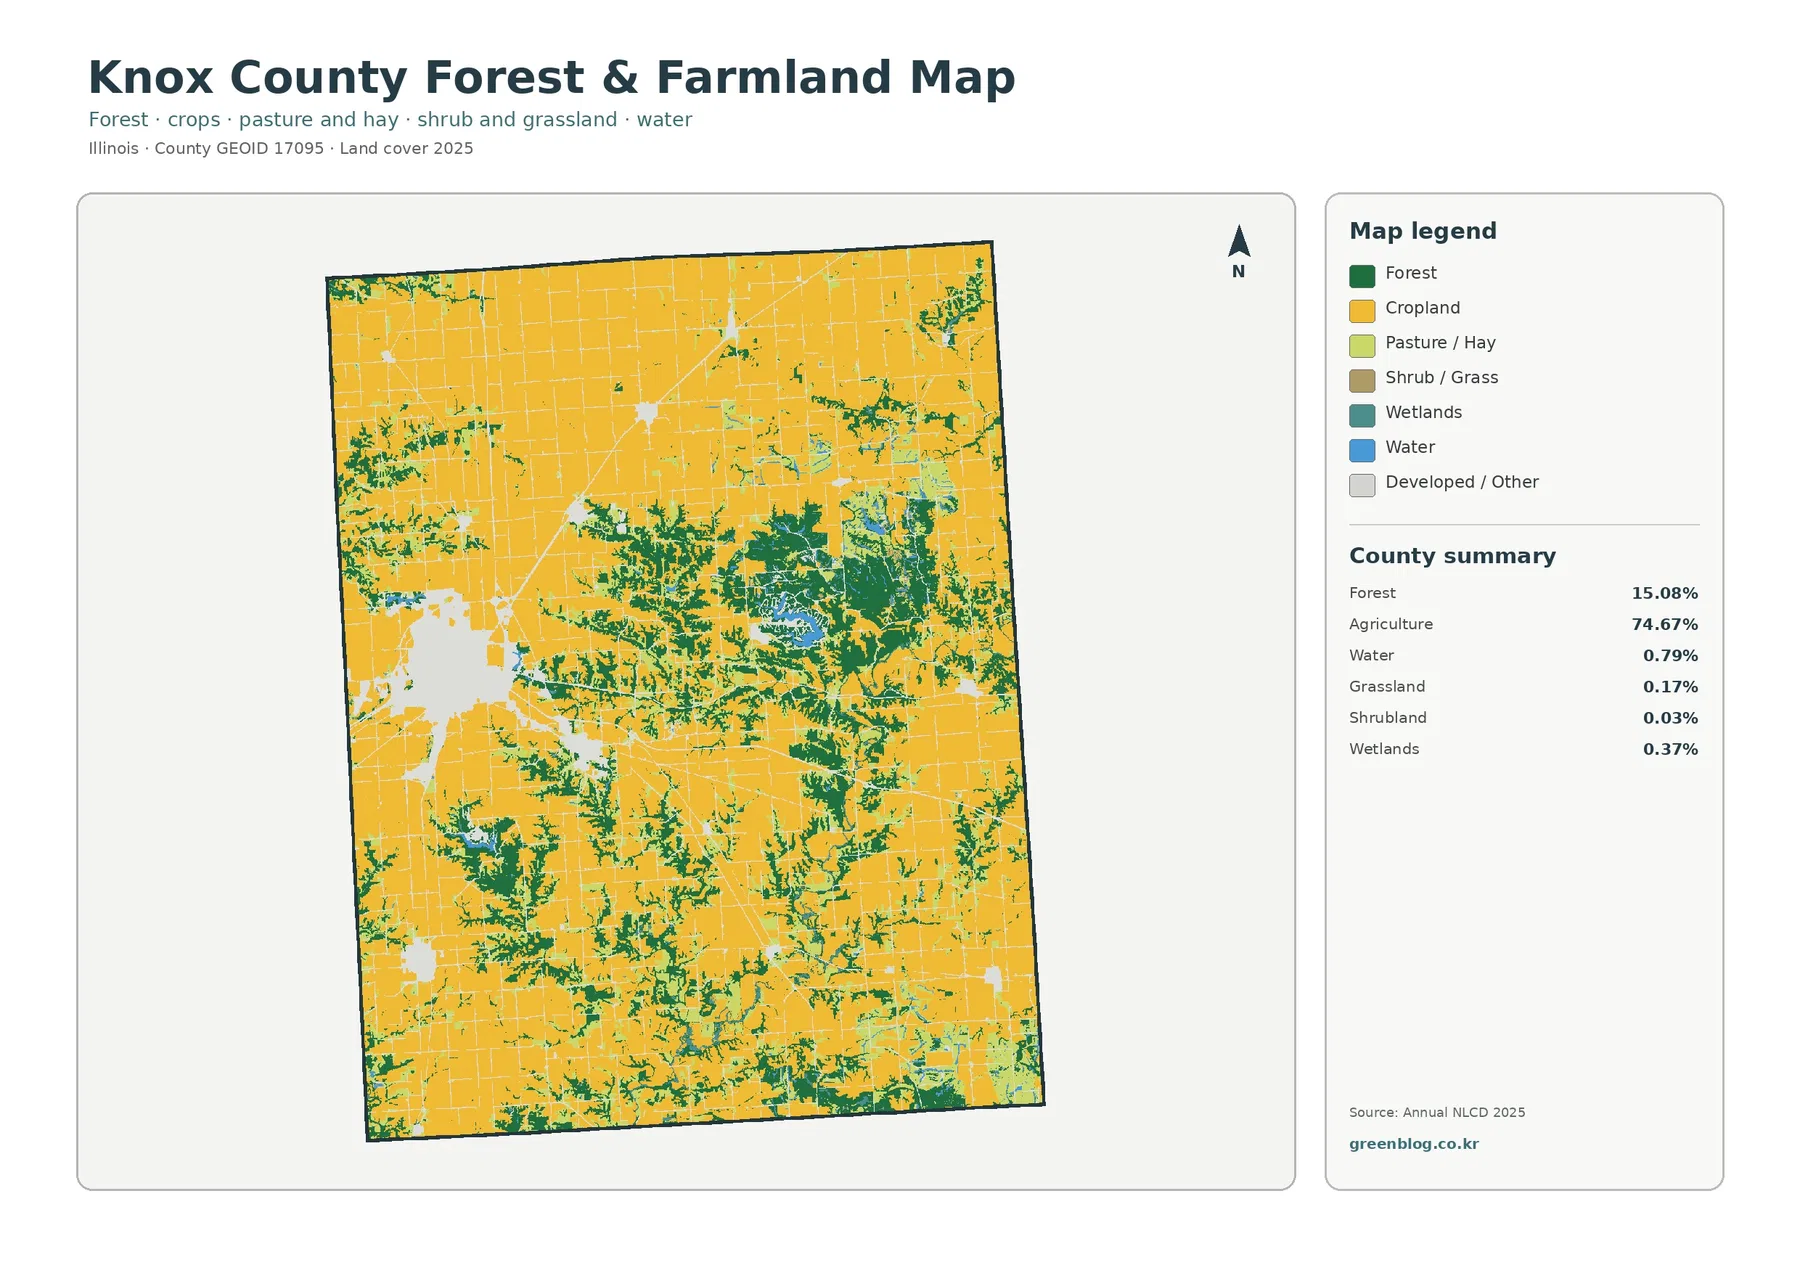
The central part of Knox County has the most complicated field-forest pattern. Wide wooded bands repeatedly divide cropland, and a water feature sits inside a larger forest complex in the east-central area. Another smaller water-and-forest group appears in the southwest. By comparison, many northern field blocks are larger and more continuous, with only thin wooded interruptions.
Grassland accounts for 0.17% and shrubland for only 0.03%, so neither should be treated as a defining countywide cover. Wetlands are also limited at 0.37%. Their small patches are useful when examining local edges, especially near water or forest, but the overall visual structure is still shaped mainly by agriculture, forest, and the separated developed areas.
A 2.40% mean impervious value shows that hard surfaces are concentrated rather than widespread
Impervious surface means pavement, parking areas, rooftops, and other hard materials that water does not readily soak through. Knox County has a mean impervious value of 2.40%, and 1.24% of the county reaches 50% impervious or greater. These figures are much lower than the 8.82% developed-land share because developed land-cover classes can include lawns, trees, soil, and other permeable surfaces.
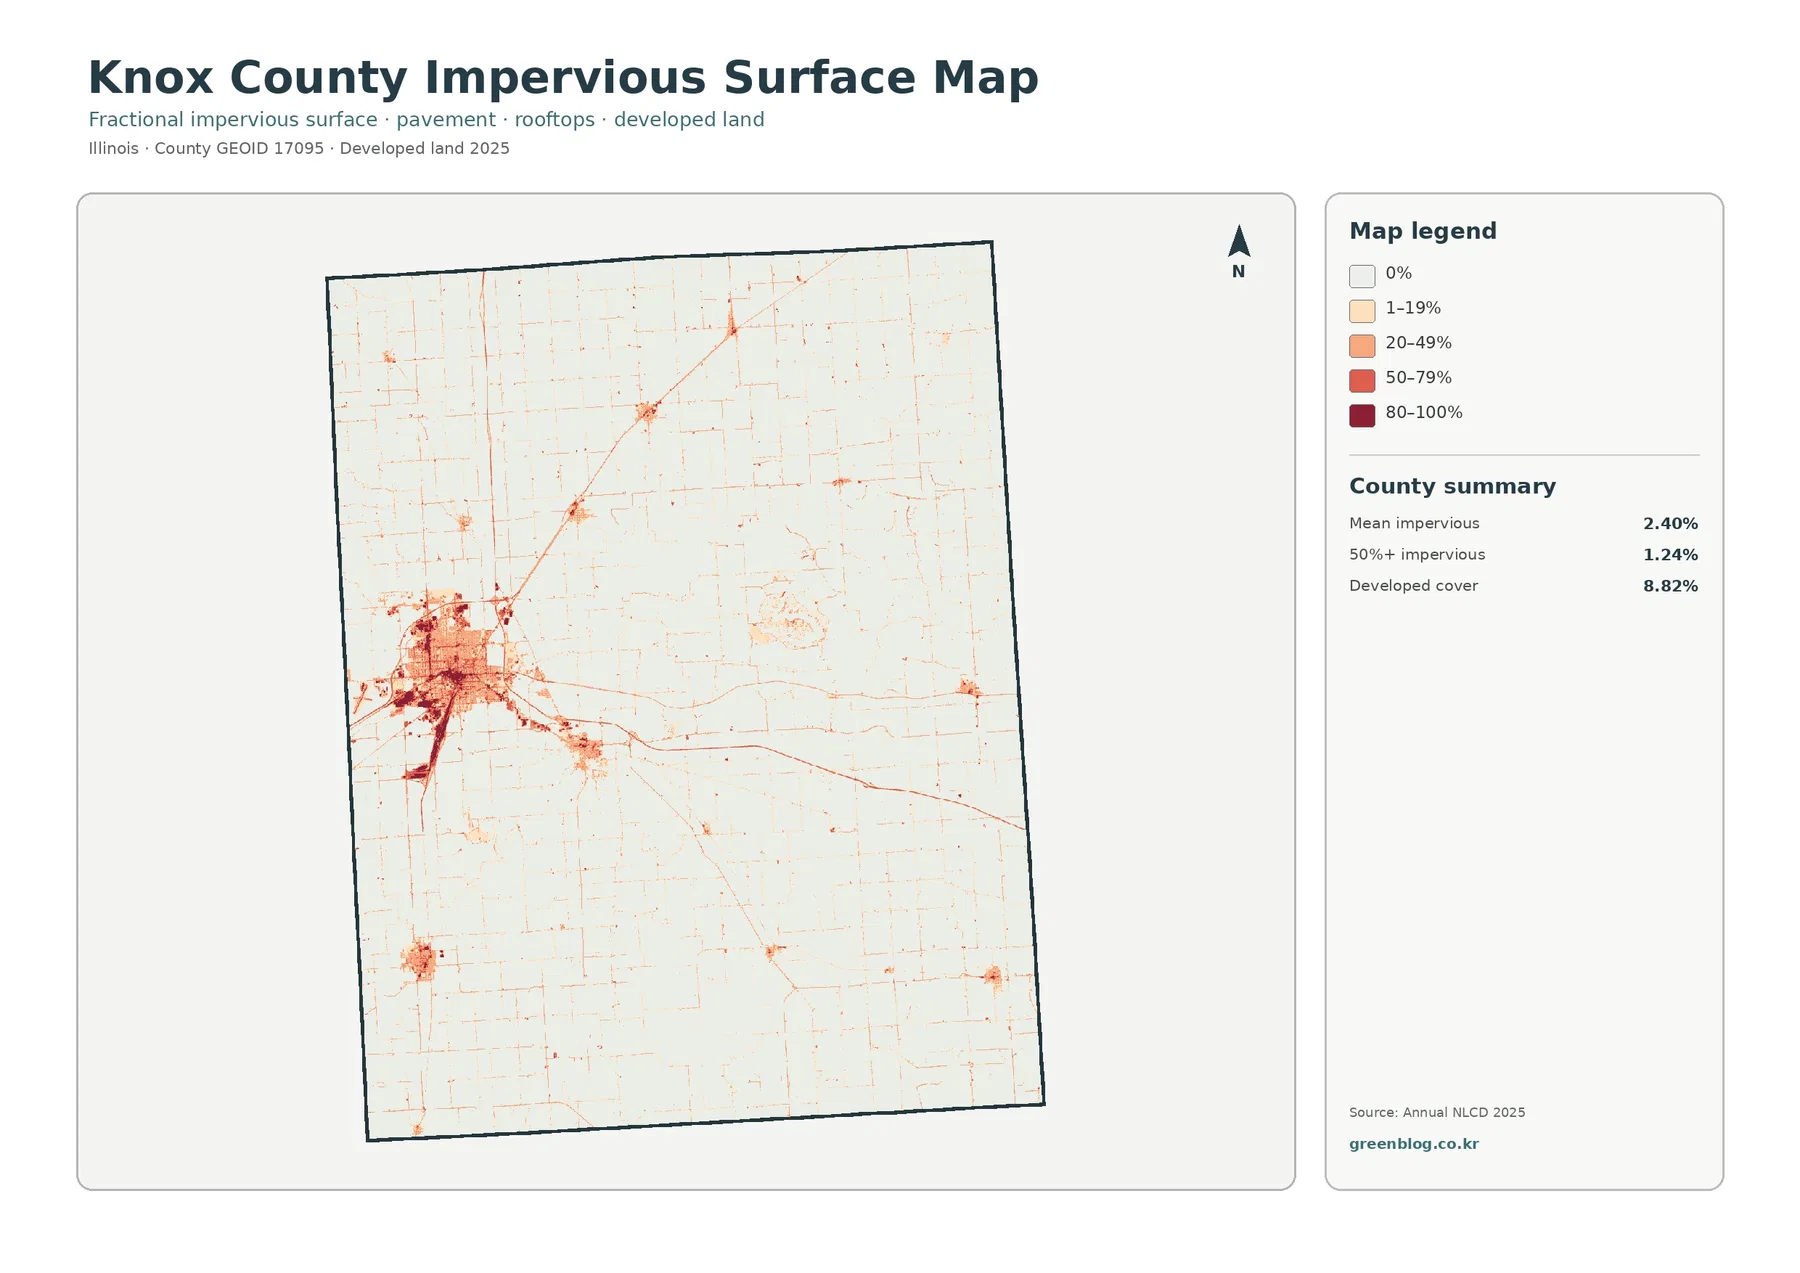
The west-central settlement contains the darkest and most continuous impervious values. Small 80–100% patches sit inside broader zones of lower hard-surface cover, while roads extend east, northeast, south, and west from the core. Smaller settlement nodes appear farther north, near the center, in the southwest, and toward the southeast. Most agricultural and forested land remains very pale.
The 1985–2025 comparison is dominated by “other” class differences rather than one conversion type
Knox County has a 10.01% overall class-difference value between 1985 and 2025. The summary identifies 0.82% as classified as developed in 2025, 0.91% as forest loss, 0.86% as agricultural loss, and 7.37% as other class difference. Because the other category is by far the largest component, the countywide total should not be read as a direct measure of urban growth, forest clearing, or farmland loss.
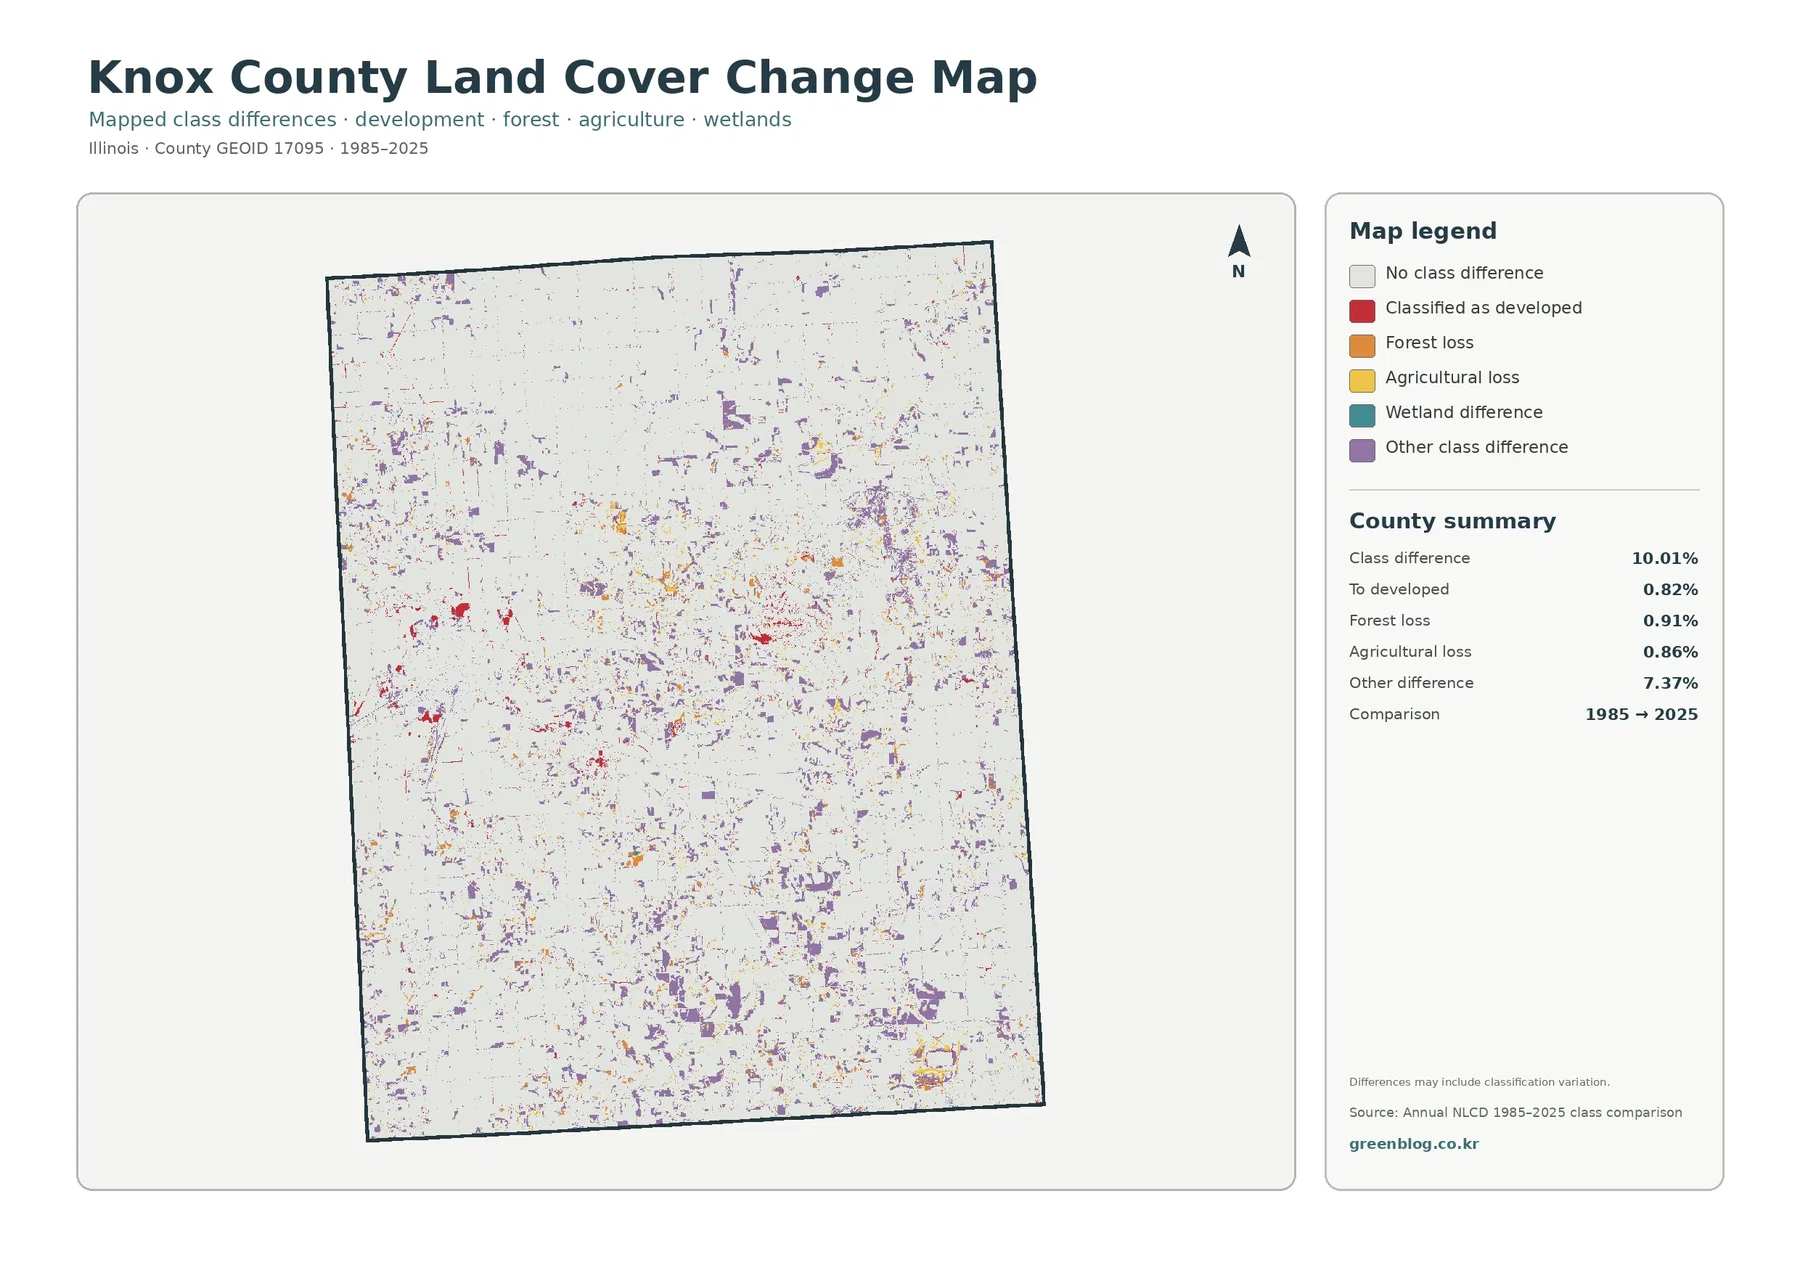
Purple other-class differences are scattered across the entire county and form several larger groups in the central, southern, and northeastern areas. Red developed differences are more visible around the west-central built core and along nearby road corridors. Forest-loss and agricultural-loss colors occur in many small patches rather than forming one continuous band of change.
A changed classification can include real surface change, but it can also reflect imagery conditions, vegetation, moisture, classification methods, or mixed pixels. The change map notes that classification variation may be included. For a specific site, this layer is best used to identify an area for follow-up rather than as proof that one particular land-use event occurred there.
Different questions call for different Knox County maps
The general land-cover map is the most useful single map for a countywide overview. It places the large agricultural areas, the west-central developed core, central forest, water features, and wetlands in one frame. The forest-and-farmland version is better when the goal is to see how wooded cover divides the farm landscape without the visual weight of developed colors.
Use the impervious map when you need to compare the density of pavement and rooftops within the developed areas. The change map belongs to a different category because it compares 1985 and 2025 classifications rather than showing current land cover. Keeping that distinction clear prevents a historical difference color from being mistaken for a present-day surface class.
Thirty-meter raster cells simplify narrow roads, small water edges, and mixed field-forest boundaries
Annual NLCD products are commonly represented with roughly 30-meter raster cells. A raster divides the ground into a grid and assigns each cell a representative class or value. Where one cell contains several surfaces—such as cropland beside a road, forest beside water, or development beside lawns—the mapped result may simplify that mixed ground into one category.
This matters in Knox County because many forest features are narrow and branching, roads cross the agricultural grid, and several small water features have irregular edges. The maps are not parcel surveys. Forest colors do not identify ownership or protected status, developed classes do not define zoning or building rights, and wetland colors do not establish legal wetland boundaries.
The 2025 maps are also snapshots of one classification year, while the change map compares the 1985 and 2025 endpoints. Construction, crop changes, water levels, or vegetation management in other years are not reconstructed step by step. These maps are most useful for county-scale pattern comparison and for identifying locations where more detailed or newer information may be needed.
Frequently Asked Questions
What is the largest 2025 land-cover class in Knox County?
Agriculture is the largest at 74.67%, followed by forest at 15.08% and developed land at 8.82%. Agriculture is broadest across the north and southeast, while forest is more concentrated through the interior and south.
Why is developed land 8.82% while mean impervious cover is only 2.40%?
Developed land-cover classes can include lawns, trees, soil, and other permeable surfaces. The highest hard-surface values are concentrated in the west-central built area and along major connecting roads.
Does the 10.01% 1985–2025 class difference equal physical land-use change?
Not necessarily. Real change may be included, but imagery, vegetation, moisture, classification methods, and mixed pixels can also affect the comparison. Other class difference accounts for 7.37%.
Map File Information
The download combines four original JPG maps for Knox County: 2025 land cover, forest and farmland, impervious/developed land, and the 1985–2025 land-cover class comparison.
- Included Versions: Land Cover Map, Forest & Farmland Map, Impervious/Developed Land Map, and 1985–2025 Land Cover Change Map
- File Type: One ZIP containing four JPG files
- Intended Use: agriculture/forest comparison, developed-area review, impervious-surface patterns, water and wetland context, class-change reference, printing, teaching, and presentations
Related Maps
- Adams County Illinois Land Cover Map
- Alexander County Illinois Land Cover Map
- Bond County Illinois Land Cover Map
Sources and references
- MRLC Annual NLCD Data – official access point for Annual NLCD land-cover and impervious-surface products.
- USGS Annual NLCD Land Cover Classification – official documentation for land-cover classes and raster interpretation.
- U.S. Census Bureau TIGER/Line Shapefiles – official geographic boundary source for Knox County.
Green Map creates custom-edited map images using open geographic data sources such as geoBoundaries, Natural Earth, OpenStreetMap, and government open data.
These maps are edited visual materials, not raw data files, and are provided for education, documents, presentations, and graphic reference.