Iroquois County, Illinois is overwhelmingly agricultural in the 2025 land-cover summary, but the map is more varied than the 88.93% agriculture figure suggests. A broad farm grid dominates the county, while narrow wetland and water corridors cut through the interior and several compact developed centers interrupt the fields. The four maps on this page separate those patterns into current land cover, forest and farmland, impervious surface, and 1985–2025 class differences.
The original four JPG maps are available together in one ZIP download. Start with the land-cover map for the countywide pattern; the other views isolate wooded and wet areas, hard surfaces around settlements, and differences between the two comparison years.
Table of Contents
Watseka stands out inside an otherwise extensive agricultural matrix
The most obvious feature of the general map is the uninterrupted yellow agricultural cover across nearly every part of Iroquois County. Roads form a fine grid through that background, and most developed areas appear as compact red clusters rather than a continuous urban belt. The county’s official website places the county seat, Watseka, a few miles east of the county center. That location corresponds closely with the largest developed concentration visible on the map.
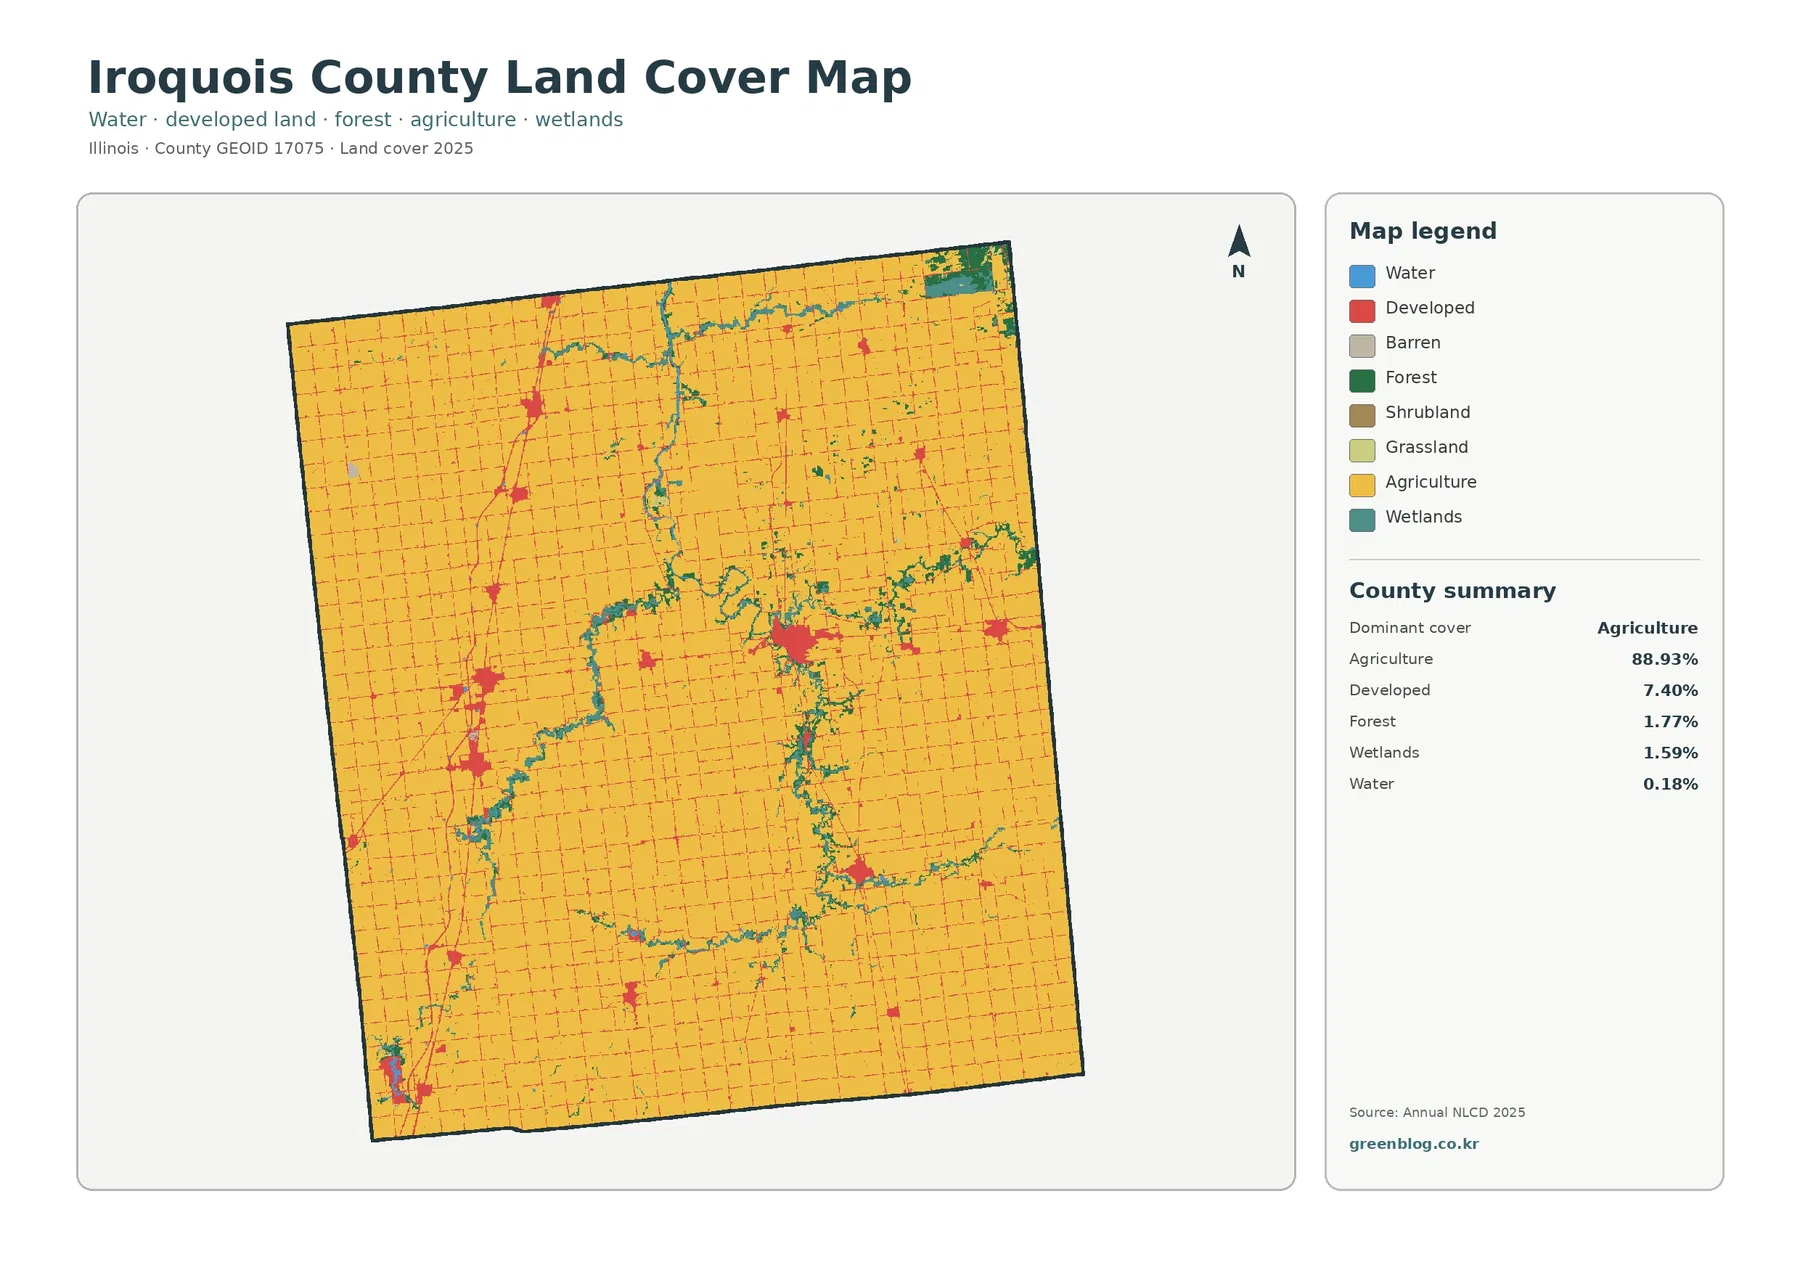
Several smaller developed nodes lie west and southwest of Watseka, and thin red lines connect some of them through the farm grid. Even so, developed land accounts for only 7.40% of the county. The visual balance remains strongly rural: built-up clusters are easy to locate precisely because the spaces between them are so consistently agricultural.
The county is not uniformly yellow. A branching band of wetlands and small water features runs through the central portion and extends toward the east and south. Small forest patches frequently sit beside those wetter corridors, and a larger green-and-teal patch appears near the northeastern corner. These interruptions give the map a recognizable internal structure that would be missed by reading the county percentages alone.
Wetland corridors are visually important even though they cover only 1.59%
Wetlands occupy a modest share of Iroquois County, but their shape makes them unusually visible. Instead of forming one large block, much of the teal cover follows narrow, curving corridors through the agricultural interior. Water itself accounts for just 0.18%, so blue areas are small, yet the combination of water, wetlands, and nearby forest provides a clear contrast with the rectangular farm pattern.
Near the middle of the county, wetland cover follows a north–south route before branching into several directions. Other wet patches occur in the northeast and along smaller drainage features. These mapped classes are useful for identifying where wetter surface cover is concentrated, but they are not legal wetland boundaries. Regulatory status, ownership, and site-specific conditions require separate official information.
A simplified forest-and-farmland view shows how little breaks the farm pattern
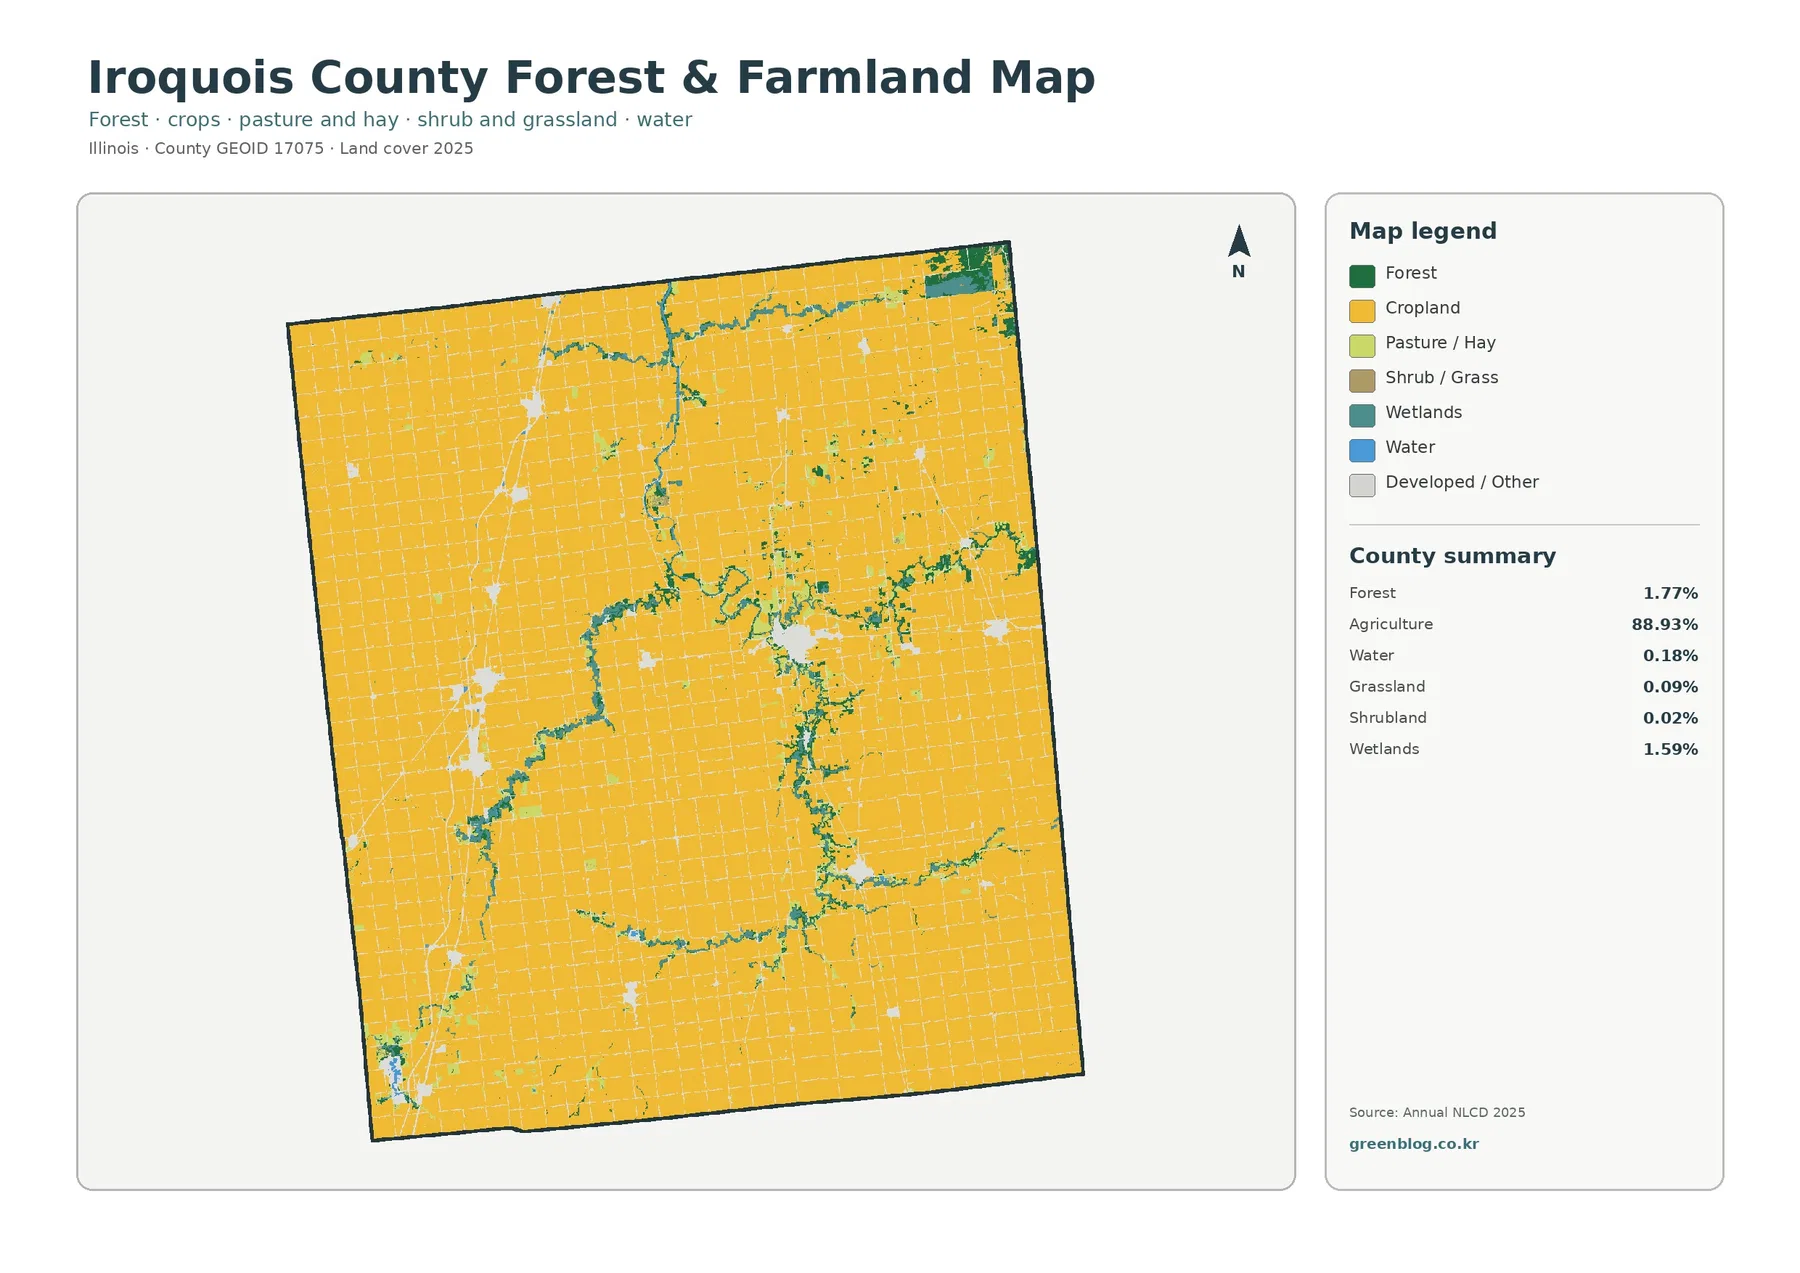
The forest-and-farmland map removes much of the visual competition from developed classes and makes the agricultural dominance even clearer. Agriculture remains 88.93% of the summary, while forest is only 1.77%. The largest forest pieces occur near wet corridors, in the northeast, and in scattered central and eastern locations. Elsewhere, wooded cover is often narrow or fragmented within the field grid.
USDA’s 2022 Census of Agriculture county profile provides a separate source of context for the same rural character. It reports extensive land in farms and cropland in Iroquois County. Those agricultural statistics are not the same measurement as the Annual NLCD land-cover percentage, so the two should not be combined as if they were one dataset. Used side by side, however, they reinforce why agriculture is the central landscape theme of the county.
Impervious cover is concentrated in a few settlements and road corridors
Impervious surface means hard cover such as pavement, parking areas, and rooftops that does not readily absorb water. The countywide mean is 1.92%, and 0.66% of the mapped area reaches at least 50% impervious cover. Those numbers are far below the 7.40% developed-land share because developed classes can also include lawns, trees, bare soil, and other permeable surfaces within built settings.
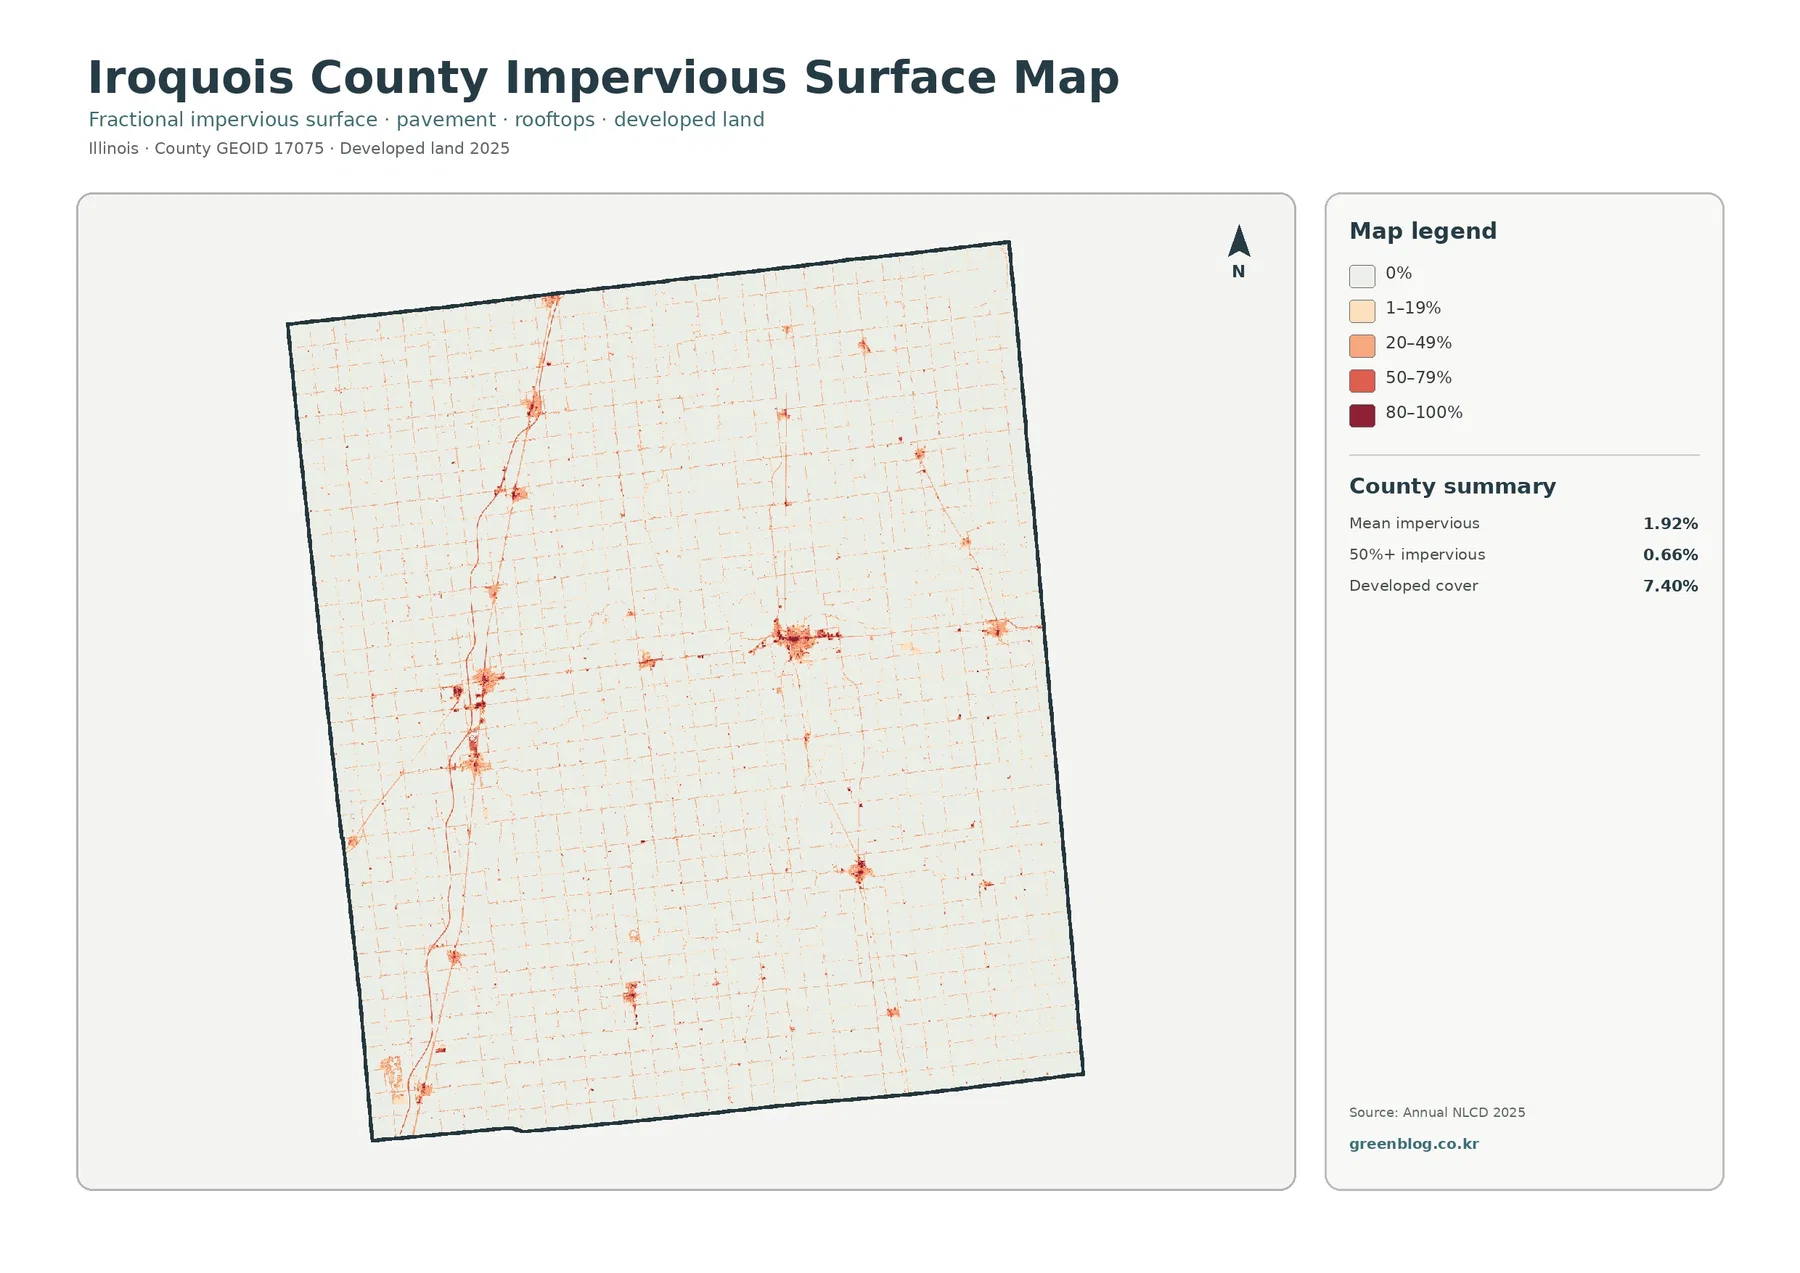
Watseka produces the largest dark cluster on the impervious map. Smaller concentrations appear in western and southwestern settlements, and thin orange or red lines follow portions of the road network. Most of the agricultural interior remains pale, which explains the low county mean. The map makes a useful distinction between an area classified as developed and the fraction of that area actually covered by hard surfaces.
Only 3.67% of cells differ between the 1985 and 2025 classifications
The long-term comparison is relatively quiet at the county scale. The map records a total class difference of 3.67%. Of that amount, 0.73% is classified to developed in 2025, 0.04% is forest loss, 0.31% is agricultural loss, and 2.56% falls into the other-difference category. Most cells therefore retain the same broad class at the two endpoints, although small differences are scattered across the county.
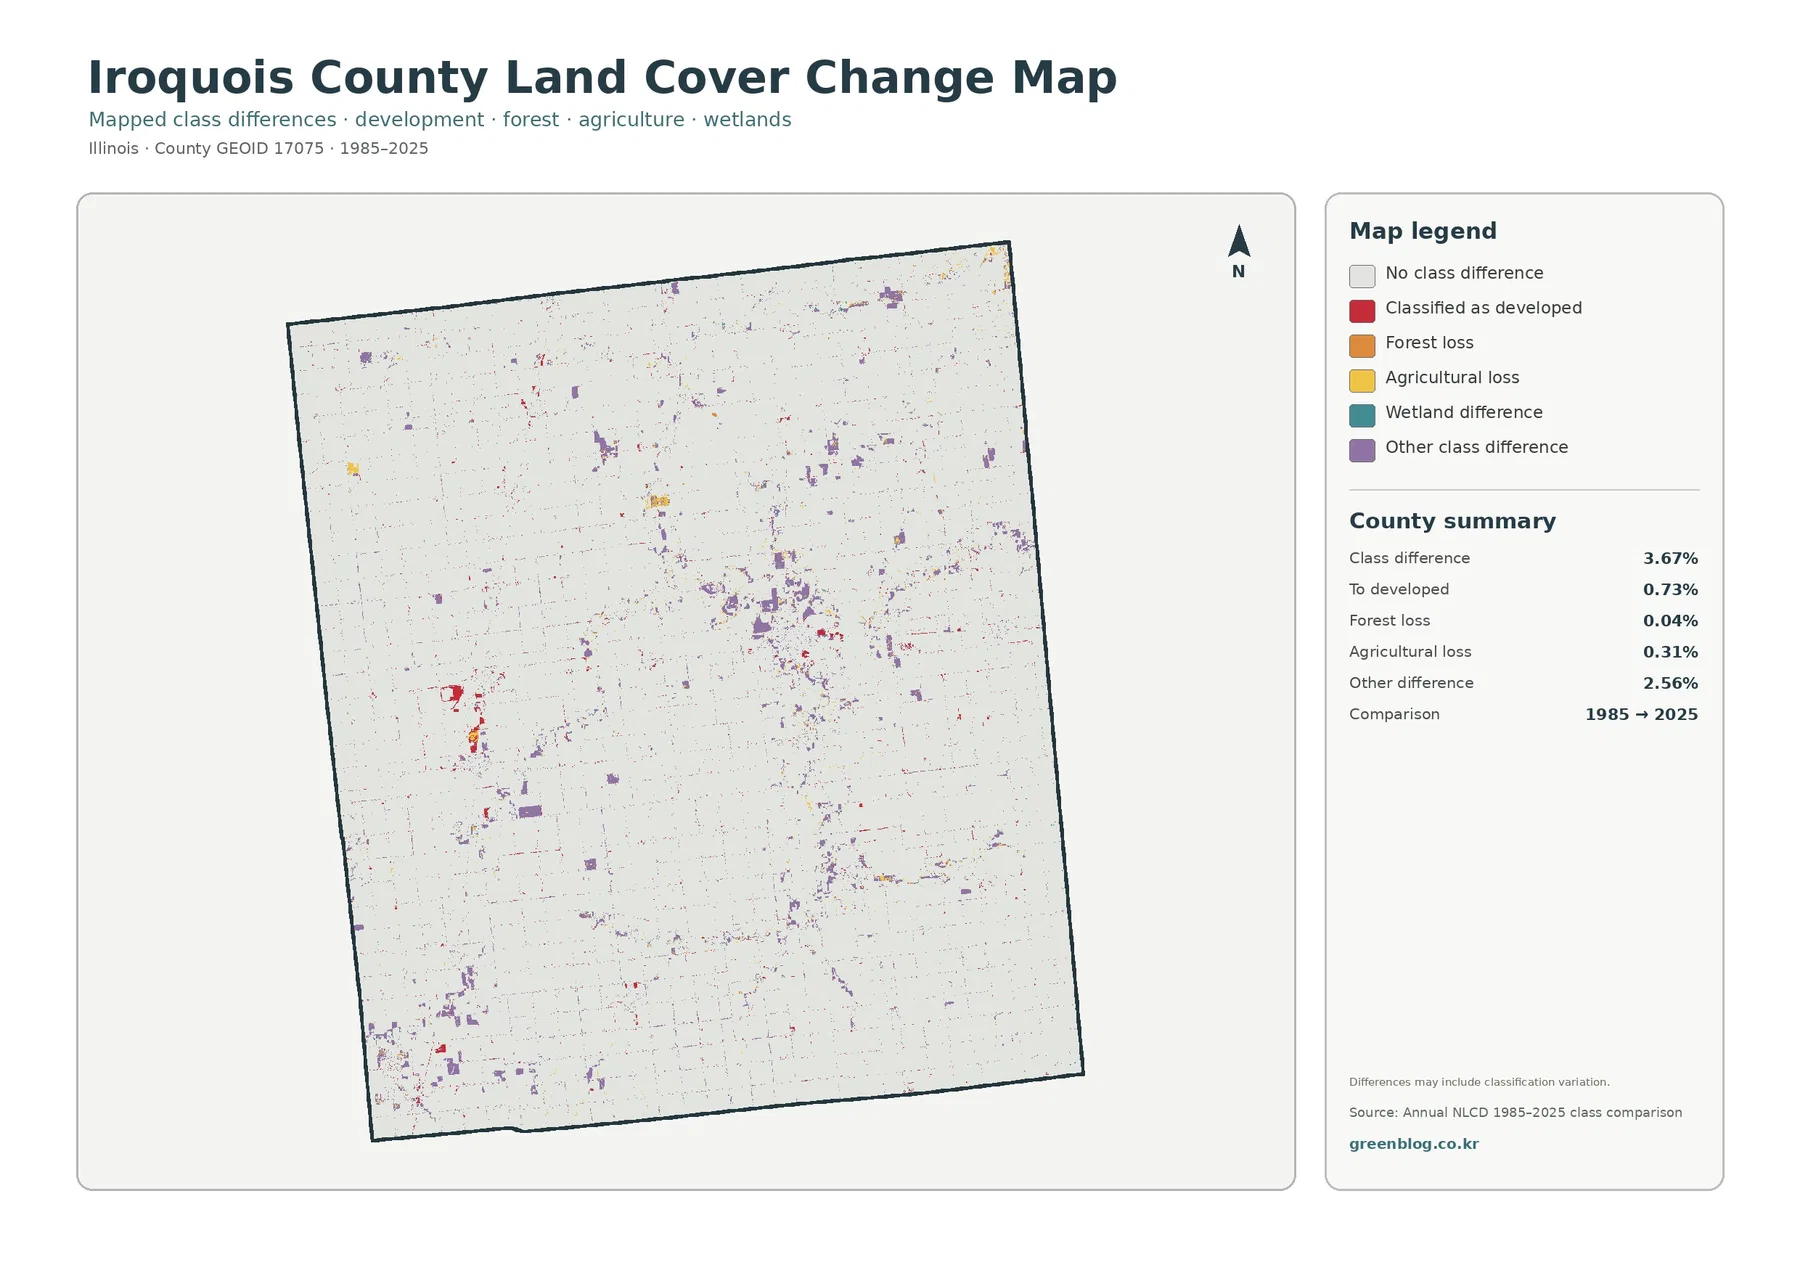
Red developed differences are easiest to spot around existing settlement clusters and selected road corridors. Purple “other” differences occur more broadly, including central, northeastern, and southwestern patches. Forest-loss cells are sparse, consistent with the very small 0.04% summary. Agricultural-loss cells also appear as small pieces rather than a single large conversion zone.
A different classification does not automatically prove a specific land-use conversion. Image conditions, vegetation or moisture at the observation date, classification methods, and mixed pixels can all affect the mapped result. The change map itself notes that differences may include classification variation. For a site-level conclusion, the colored cells should be checked against additional imagery or local records.
The four maps answer different questions about the same farm-dominated county
For a quick overview, the general land-cover map is the most useful because it places fields, settlements, wetlands, forest, and water in one frame. The forest-and-farmland version is better when the goal is to emphasize how uninterrupted the agricultural surface is and where wooded or wet corridors break that pattern. The impervious layer isolates hard surfaces, while the change map moves away from the present-day picture and compares two classification years.
Thirty-meter raster cells simplify narrow roads, drainage features, and field edges
Annual NLCD products are commonly represented with roughly 30-meter raster cells. A raster divides the surface into a grid and assigns a representative class or value to each cell. If one cell contains a road beside cropland, a wetland edge beside forest, or a house surrounded by lawn, the map must simplify those mixed surfaces into one classification or impervious percentage.
That generalization is especially relevant in Iroquois County because many of the features that differ from agriculture are narrow. Roads form thin lines, wetland cover often follows drainage corridors, and forest patches can be small or irregular. Their mapped shapes are suitable for county-scale comparison but should not be treated as surveyed parcel boundaries or exact site delineations.
Frequently Asked Questions
Why does Iroquois County look so uniform on the forest-and-farmland map?
Agriculture accounts for 88.93% of the 2025 land-cover summary. Forest is only 1.77%, while wetlands are 1.59%, so most nonagricultural features appear as narrow corridors or small patches rather than broad blocks.
What does the impervious map add beyond the 7.40% developed-land figure?
It separates hard surfaces from the broader developed class. Mean impervious cover is 1.92%, and 0.66% of the county reaches at least 50% impervious cover. The highest values cluster around Watseka and smaller settlements.
Does the 3.67% 1985–2025 class difference equal physical land-use change?
Not exactly. Real surface change may contribute, but imagery, classification methods, vegetation or moisture conditions, and mixed pixels can also produce different classifications. Site-level conclusions need additional evidence. Map File Information The download contains four original JPG maps for Iroquois County: 2025 land cover, forest and farmland, impervious/developed land, and the 1985–2025 land-cover class comparison.
Map File Information
Download the map files associated with this page for reference, printing, and compatible visual projects.
- Included Files: Use only the versions confirmed in the article and supplied images
- File Type: Use the confirmed download contents
- Intended Use: Printing, education, presentations, and map-based projects
Related Maps
- Adams County Illinois Land Cover Map
- Alexander County Illinois Land Cover Map
- Bond County Illinois Land Cover Map
Sources and references
- MRLC Annual NLCD Data – official access to Annual NLCD land-cover and impervious-surface products.
- USGS Annual NLCD Land Cover Classification – official documentation for land-cover classes and raster interpretation.
- Iroquois County, Illinois – the official county website, including county location and Watseka county-seat information.
- USDA NASS 2022 Census of Agriculture – Iroquois County Profile – official county-level agricultural statistics.
- U.S. Census Bureau TIGER/Line Shapefiles – official geographic boundary data used for county identification.
Green Map creates custom-edited map images using open geographic data sources such as geoBoundaries, Natural Earth, OpenStreetMap, and government open data.
These maps are edited visual materials, not raw data files, and are provided for education, documents, presentations, and graphic reference.