Hancock County, Illinois has a strongly agricultural 2025 land-cover pattern, but the western edge changes the picture. Agriculture covers 75.10% of the county, while forest accounts for 14.57%, developed land 6.28%, water 2.43%, and wetlands 1.39%. A broad water boundary and wooded margins in the west contrast with the large farm blocks farther inland, while branching forest patches become more noticeable again toward the eastern half.
This page pairs four map views so those differences can be read separately rather than compressed into one image. The four original JPG maps are available in one download. The general map shows the countywide mix, the forest-and-farmland map simplifies the agricultural pattern, the impervious map isolates hard surfaces and roads, and the 1985–2025 map highlights cells whose classifications differ between the two years.
Table of Contents
Three quarters agriculture does not make the county visually uniform
The 75.10% agricultural share dominates the interior of Hancock County. Large yellow blocks fill much of the center, north-central area, and southeast. Straight, thin developed lines cut across these fields, giving the interior a road-grid appearance. Forest is present throughout the same landscape, but it is usually broken into smaller pieces until the map approaches the western edge or several more wooded parts of the east.
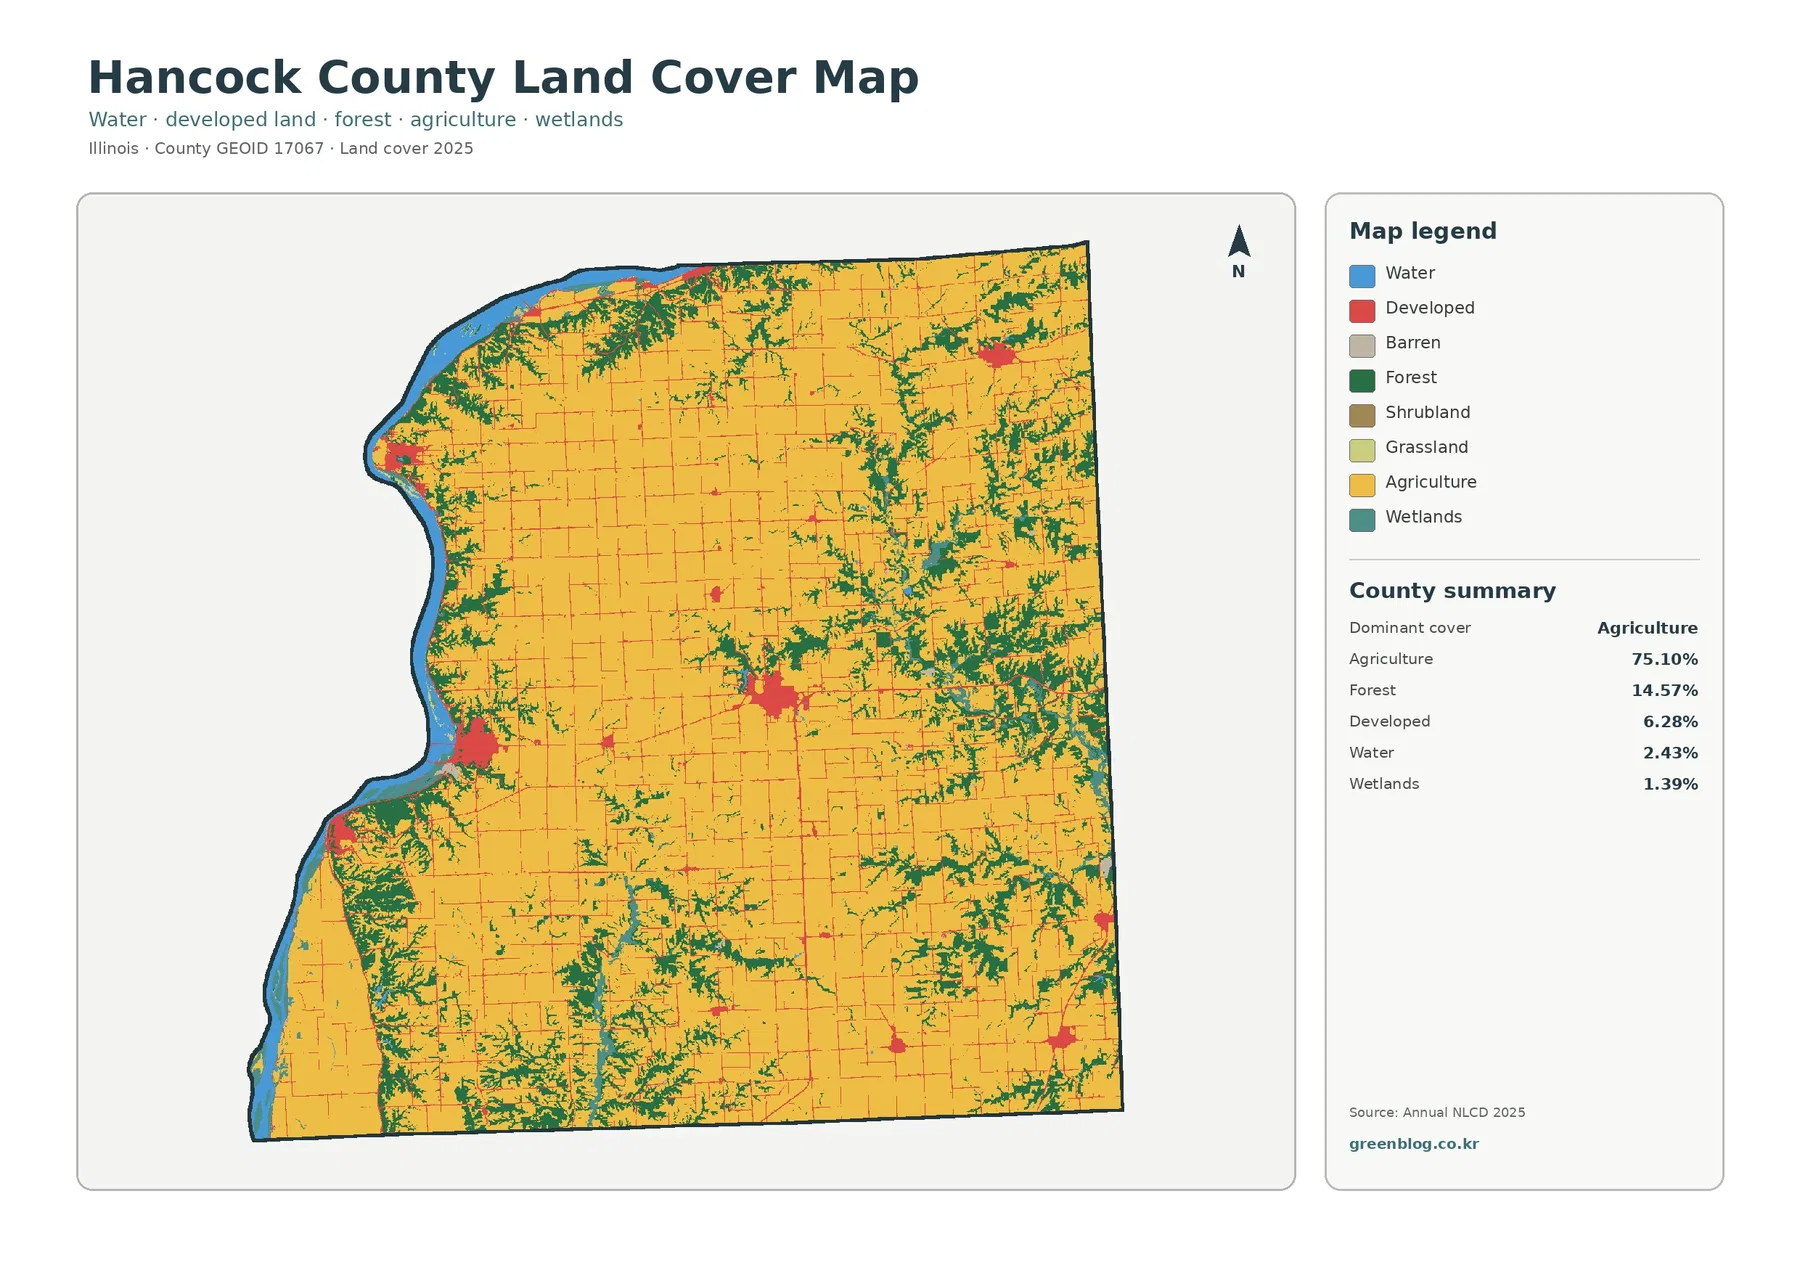
The strongest interruption to that farm pattern sits along the west. Blue water follows a long, irregular boundary rather than appearing only as isolated inland ponds. Hancock County’s official website describes the county as lying along the Mississippi River, which matches the map’s broad western water edge. Wooded cover becomes more frequent just inland from this boundary, and a few developed clusters sit close to the same side of the county.
Farther east, forest appears in another form. Green patches split into branching shapes that enter the agricultural blocks from several directions, particularly in the northeastern and east-central parts of the county. Larger forest pieces also occur in the south and southwest. The 14.57% forest share therefore consists of river-edge woods, branching interior strips, and scattered blocks rather than one continuous forest region.
The western water edge brings forest, wetlands, and development into a tighter mix
Water covers 2.43% of the mapped county. That share is larger than in many farm-dominated inland landscapes because a substantial blue band occupies the western boundary. The water edge curves around several broad bends, and the land immediately beside it often contains a more complicated mix of forest, agriculture, wetlands, and developed cover than the interior grid of fields.
Forest-and-farmland mapping reveals two different wooded patterns
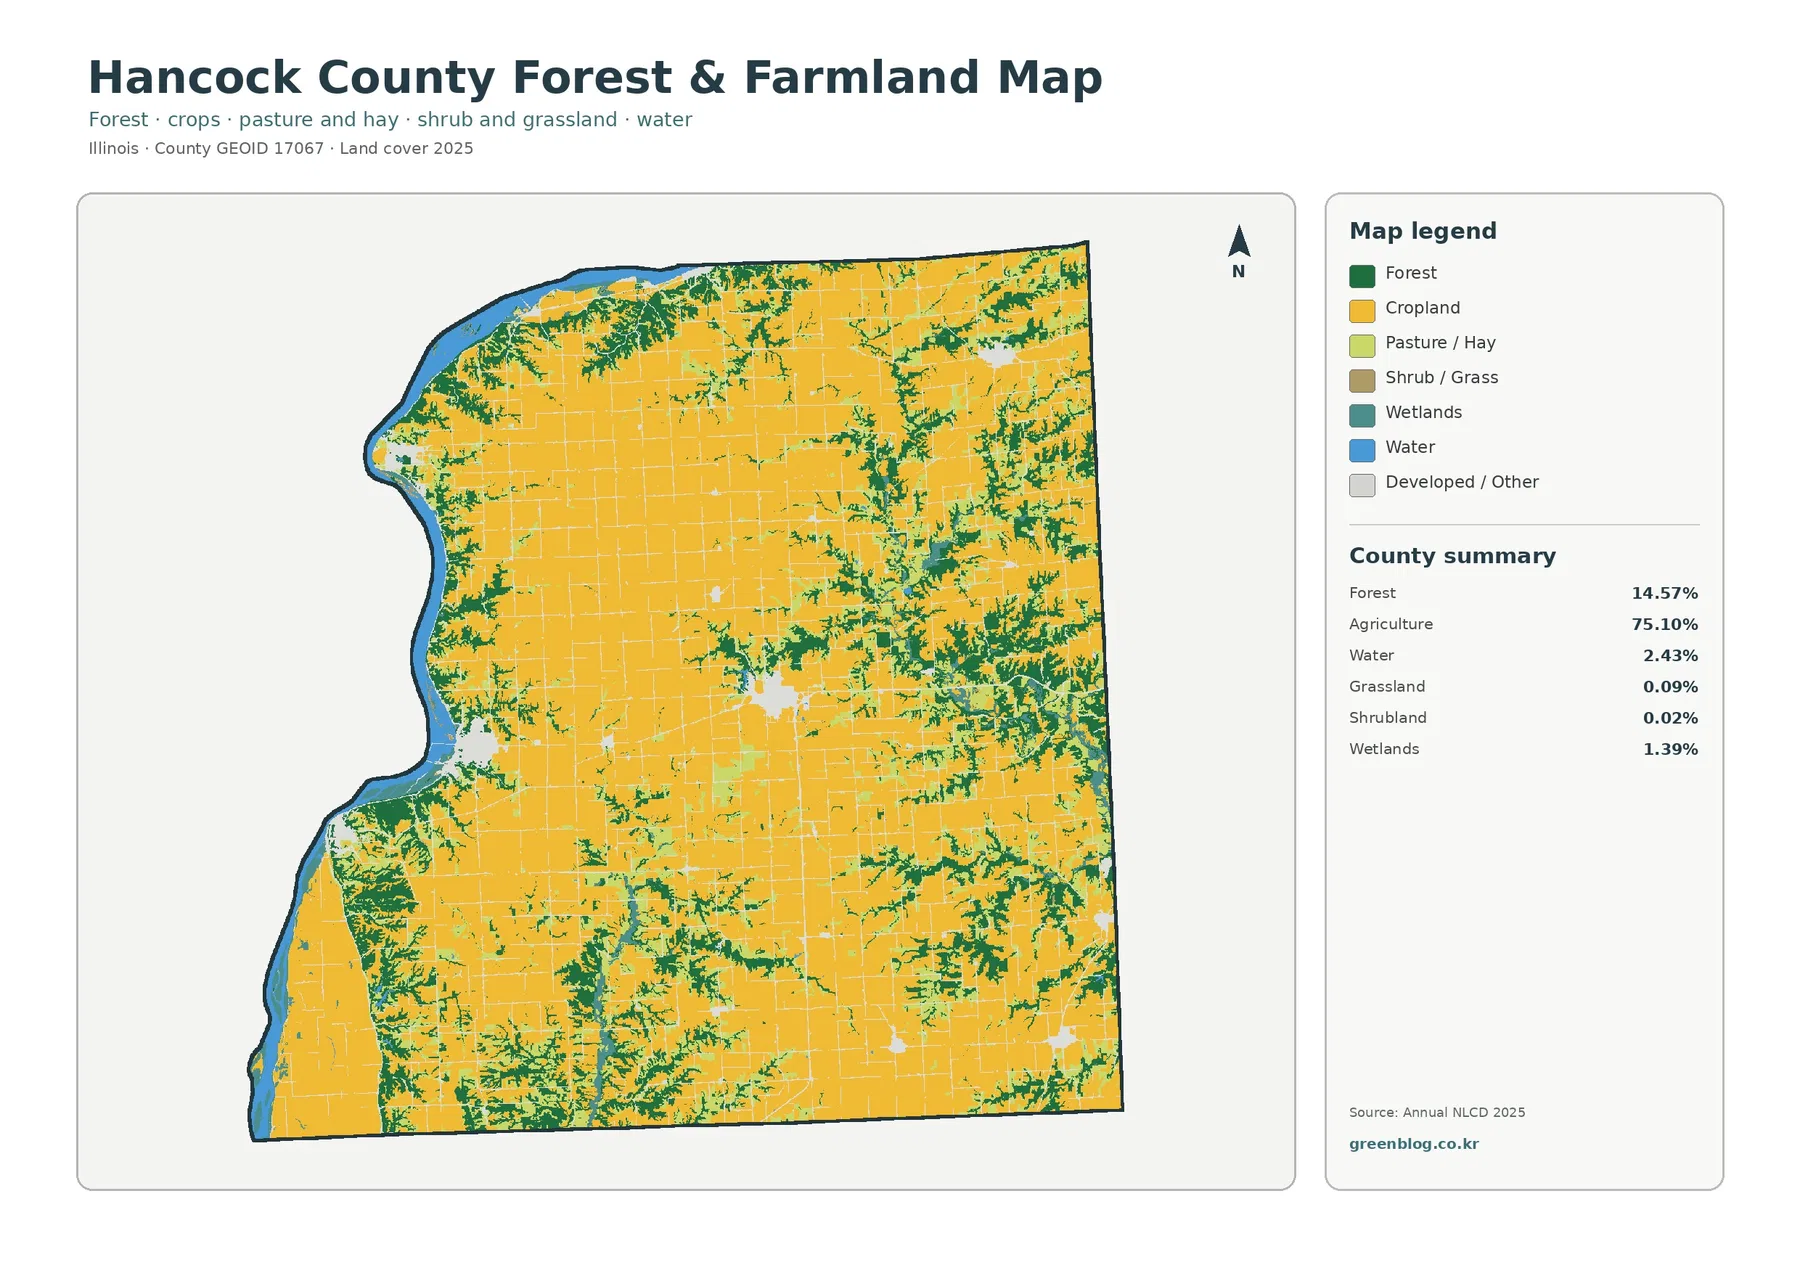
When developed cover is de-emphasized, the county’s agricultural majority becomes even clearer. Cropland and related agricultural classes form broad yellow areas across the center and much of the north and southeast. Forest stands out most strongly near the western river side and in the eastern half, where green strips divide farm blocks in irregular, branching shapes.
Hard surfaces gather in separate centers instead of forming one urban field
Developed land accounts for 6.28% of the 2025 land-cover summary. On the impervious map, the most obvious concentrations appear as several separate clusters: a strong central node, multiple western clusters close to the river side, a northeastern node, and smaller concentrations toward the eastern and southeastern edges. Thin lines between them trace the road network across otherwise pale agricultural areas.
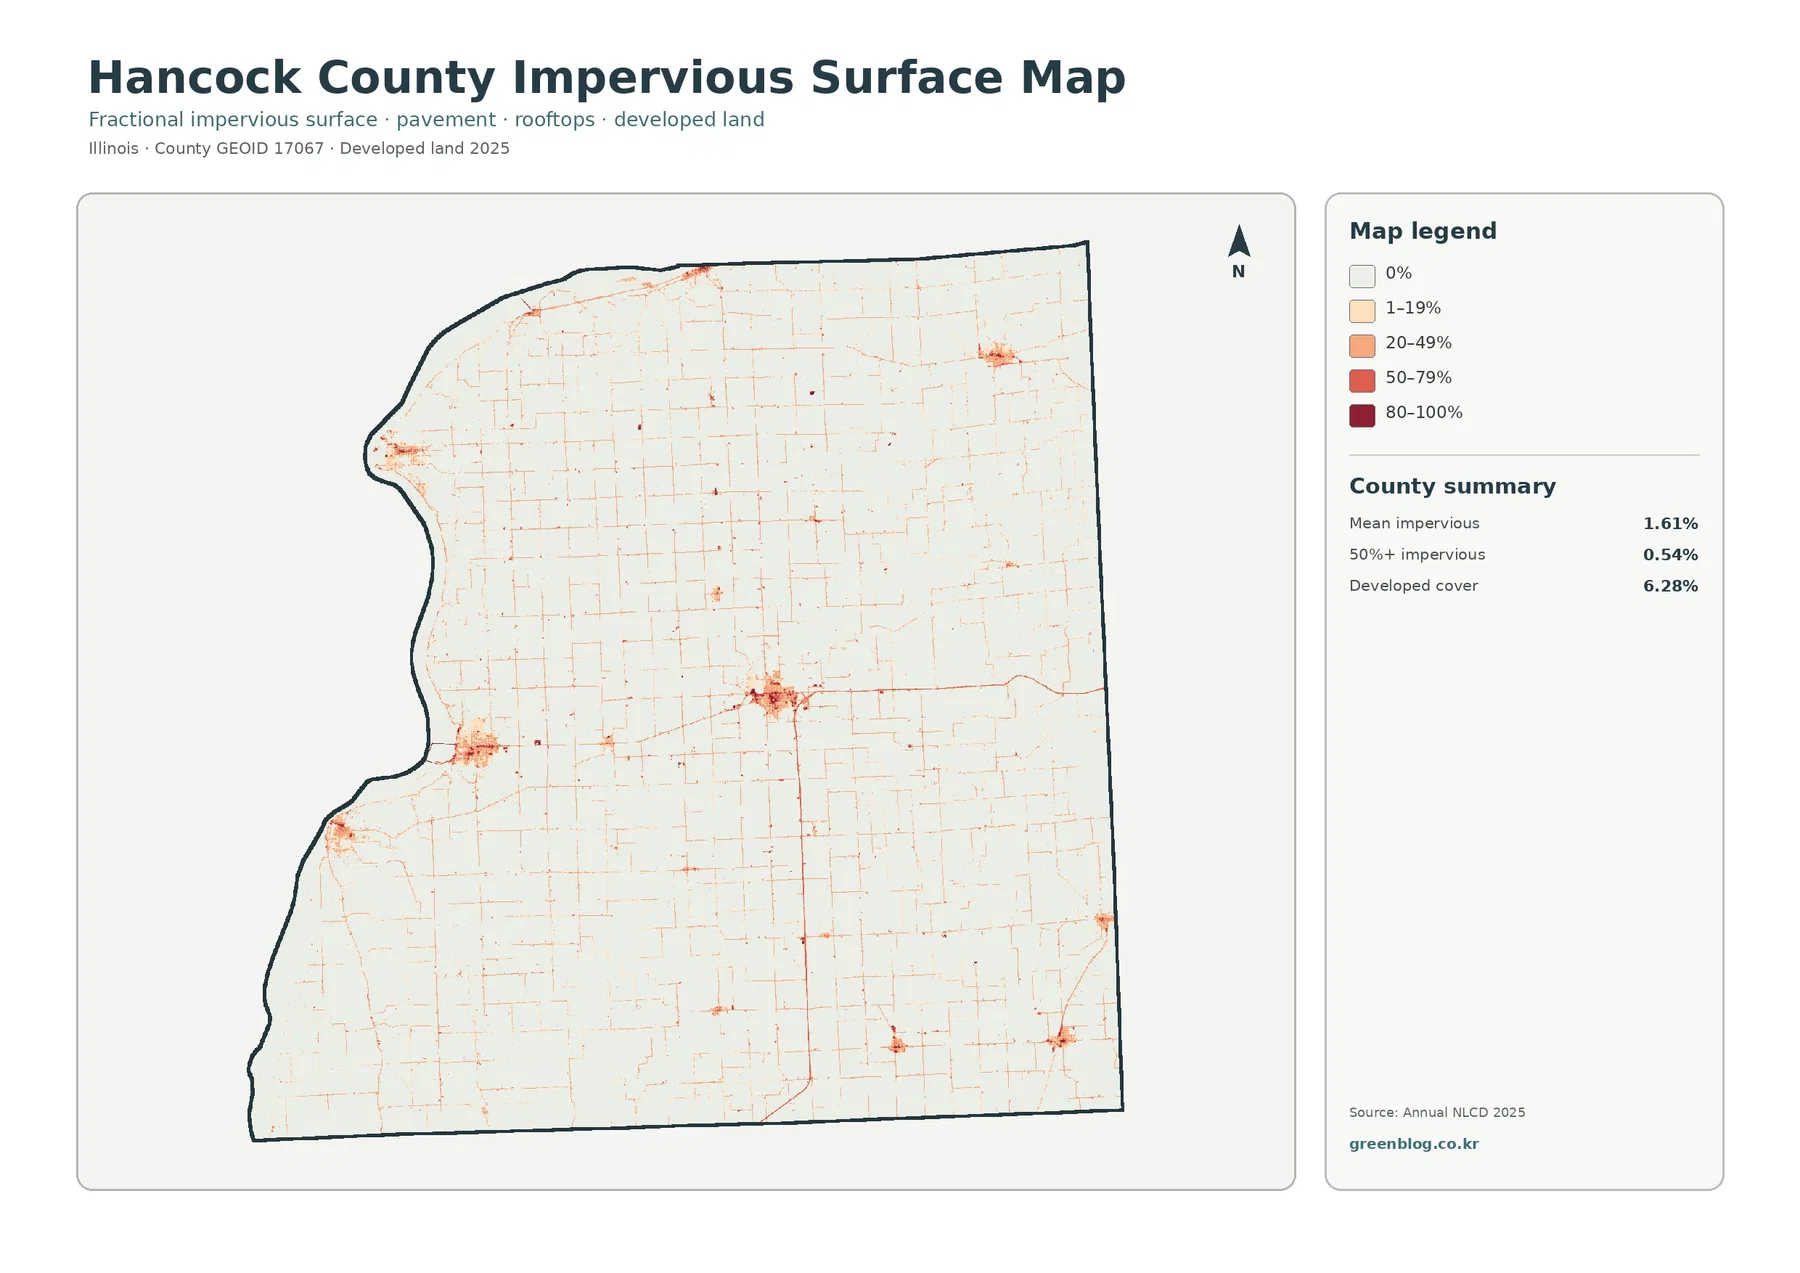
Mean impervious cover is only 1.61%, and 0.54% of the mapped area reaches 50% impervious or higher. Impervious surface means hard material such as pavement and rooftops that does not readily absorb water. The countywide average stays low because most of Hancock County is field, forest, water, or other permeable cover even though a number of local centers show much darker values.
The 8.73% class difference is dominated by changes outside the three named loss categories
The 1985–2025 map marks cells whose land-cover classes are different at the two endpoints. Hancock County has an overall class-difference value of 8.73%. The summary separates 0.75% as classified to developed, 0.64% as forest loss, 0.46% as agricultural loss, and 6.77% as other class difference. The last category is by far the largest component of the total.
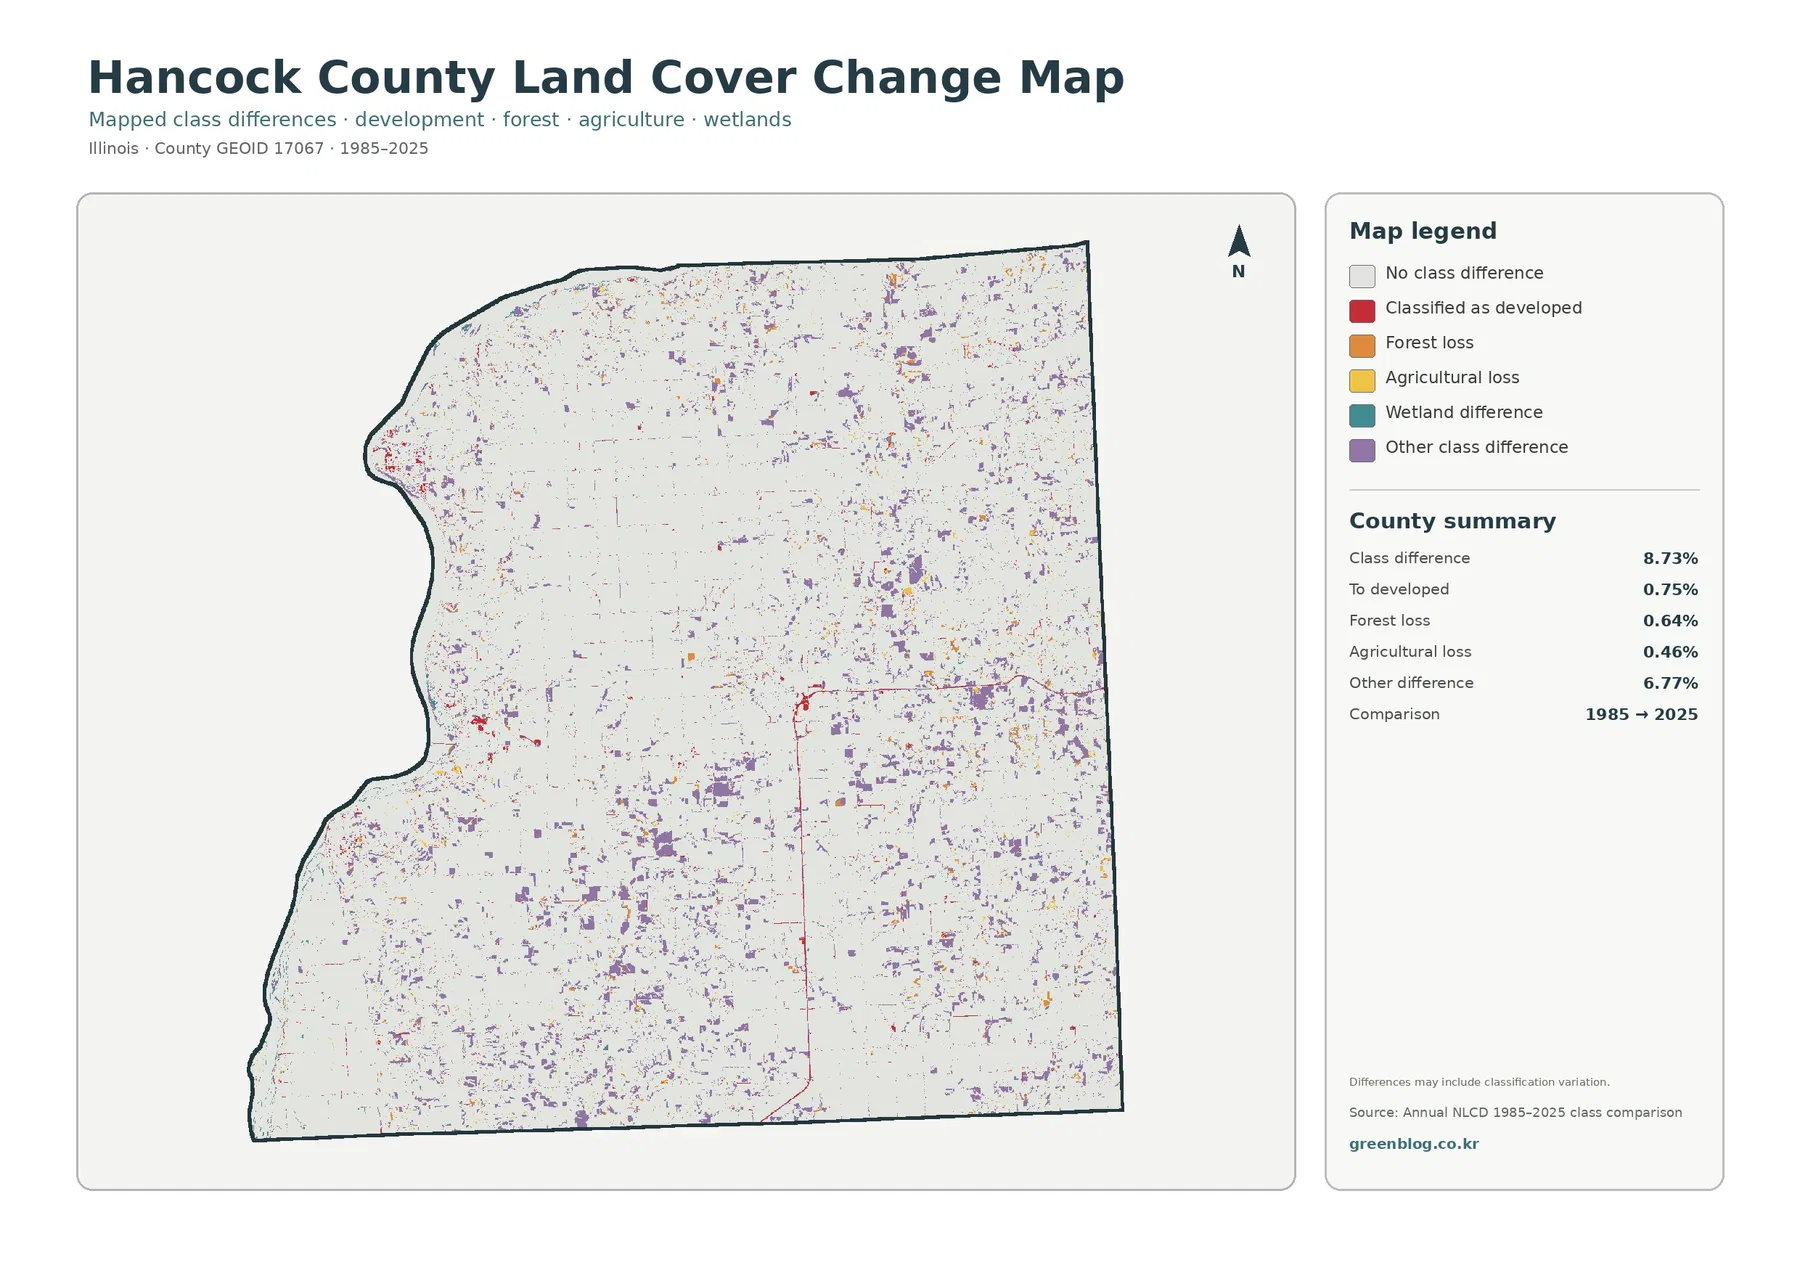
Purple “other” differences are scattered widely across the county, with many small patches in the east and south as well as near wooded/agricultural boundaries elsewhere. Red developed differences appear around several settlement nodes and along a few road segments. Orange forest-loss and yellow agricultural-loss cells are less extensive and occur in small pieces rather than one broad band.
This distribution is why the 8.73% figure should not be described as an 8.73% conversion to development, or as an 8.73% loss of forest or farmland. It simply records different classifications at two dates. Real surface changes may contribute, but imagery, classification methods, vegetation condition, moisture, and mixed pixels can also affect the result. The map itself notes that class differences may include classification variation.
Use the four maps as separate questions about the same county
For a countywide description, the general land-cover map gives the most complete starting point. It places the agricultural interior, western water boundary, wooded areas, wetlands, and developed nodes in a single frame. The forest-and-farmland map is better when the purpose is to show how fields are interrupted by broad western woods and branching eastern forest without giving equal visual weight to smaller developed features.
The impervious map answers a narrower question: where are hard surfaces concentrated? Its pale background across most of the county and darker separated clusters make the low 1.61% mean easier to understand than the number alone. The change map addresses time rather than present condition. Placing it beside the 2025 map makes it clear that purple, red, orange, and yellow cells represent endpoint differences rather than a second current land-cover legend.
Raster scale matters most along curved shorelines, narrow roads, and fragmented woods
Annual NLCD products are commonly represented at roughly 30-meter raster resolution. A raster divides the surface into grid cells and gives each cell a representative class or value. Where a cell contains more than one surface—field and road, forest and water, wetland and soil—the mapped result simplifies that mixture.
Hancock County contains several places where this matters. The western water edge is curved and irregular, many roads are narrower than a raster cell, and branching forest strips in the east can be thinner than nearby farm blocks. Enlarging the map does not turn those cell boundaries into surveyed parcel lines. Forest colors do not define ownership or protected land, wetland colors do not establish a legal wetland boundary, and developed classes do not define zoning.
Frequently Asked Questions
What is the largest 2025 land-cover class in Hancock County?
Agriculture is the largest class at 75.10%. Forest follows at 14.57%, developed land at 6.28%, water at 2.43%, and wetlands at 1.39%. The broad western water edge and nearby woods create the strongest contrast with the agricultural interior.
What is the large water feature along the western side of the county map?
The supplied map shows a broad water boundary along the west. Hancock County’s official website describes the county as lying along the Mississippi River. The land-cover map, however, is not a navigation or legal boundary map.
Does the 8.73% 1985–2025 class difference represent development growth?
No. Only 0.75% is summarized as classified to developed. Forest loss is 0.64%, agricultural loss 0.46%, and other class difference 6.77%. Real change may be included, but classification variation and mixed pixels can also affect the result. Map File Information The download contains four original JPG maps for Hancock County: 2025 land cover, forest and farmland, impervious/developed land, and the 1985–2025 land-cover class comparison.
Map File Information
Download the map files associated with this page for reference, printing, and compatible visual projects.
- Included Files: Use only the versions confirmed in the article and supplied images
- File Type: Use the confirmed download contents
- Intended Use: Printing, education, presentations, and map-based projects
Related Maps
- Adams County Illinois Land Cover Map
- Alexander County Illinois Land Cover Map
- Bond County Illinois Land Cover Map
Sources and references
- MRLC Annual NLCD Data – official access to the Annual NLCD land-cover and impervious-surface products used for the mapped categories.
- USGS Annual NLCD Land Cover Classification – official documentation for land-cover classes and raster interpretation.
- Hancock County, Illinois official website – county information noting Hancock County’s location along the Mississippi River.
- U.S. Census Bureau TIGER/Line Shapefiles – official geographic boundary source for Hancock County.
Green Map creates custom-edited map images using open geographic data sources such as geoBoundaries, Natural Earth, OpenStreetMap, and government open data.
These maps are edited visual materials, not raw data files, and are provided for education, documents, presentations, and graphic reference.