Grundy County combines a broad agricultural landscape with a much more complex northern river corridor. The 2025 summary lists agriculture at 73.88%, developed land at 12.78%, forest at 5.96%, wetlands at 3.01%, and water at 2.83%. The four maps on this page separate those patterns into general land cover, forest and farmland, impervious surface, and a 1985–2025 class comparison.
The WebP maps can be compared directly on the page, and the four original JPG maps are available together in one download. A useful way to begin is to contrast the farm-dominated southern half with the Illinois River corridor and concentrated built-up areas in the north, where water, wetlands, forest, roads, and developed land occur much closer together.
Table of Contents
Impervious cover reveals where development is concentrated instead of simply measuring the countywide developed class
The impervious-surface map gives the clearest view of built-up concentration. Grundy County has a mean impervious value of 4.58%, while areas with at least 50% impervious cover account for 3.26% of the county. Those figures are lower than the 12.78% developed-land share because a developed land-cover cell can still contain lawns, trees, bare soil, or other surfaces that absorb water.
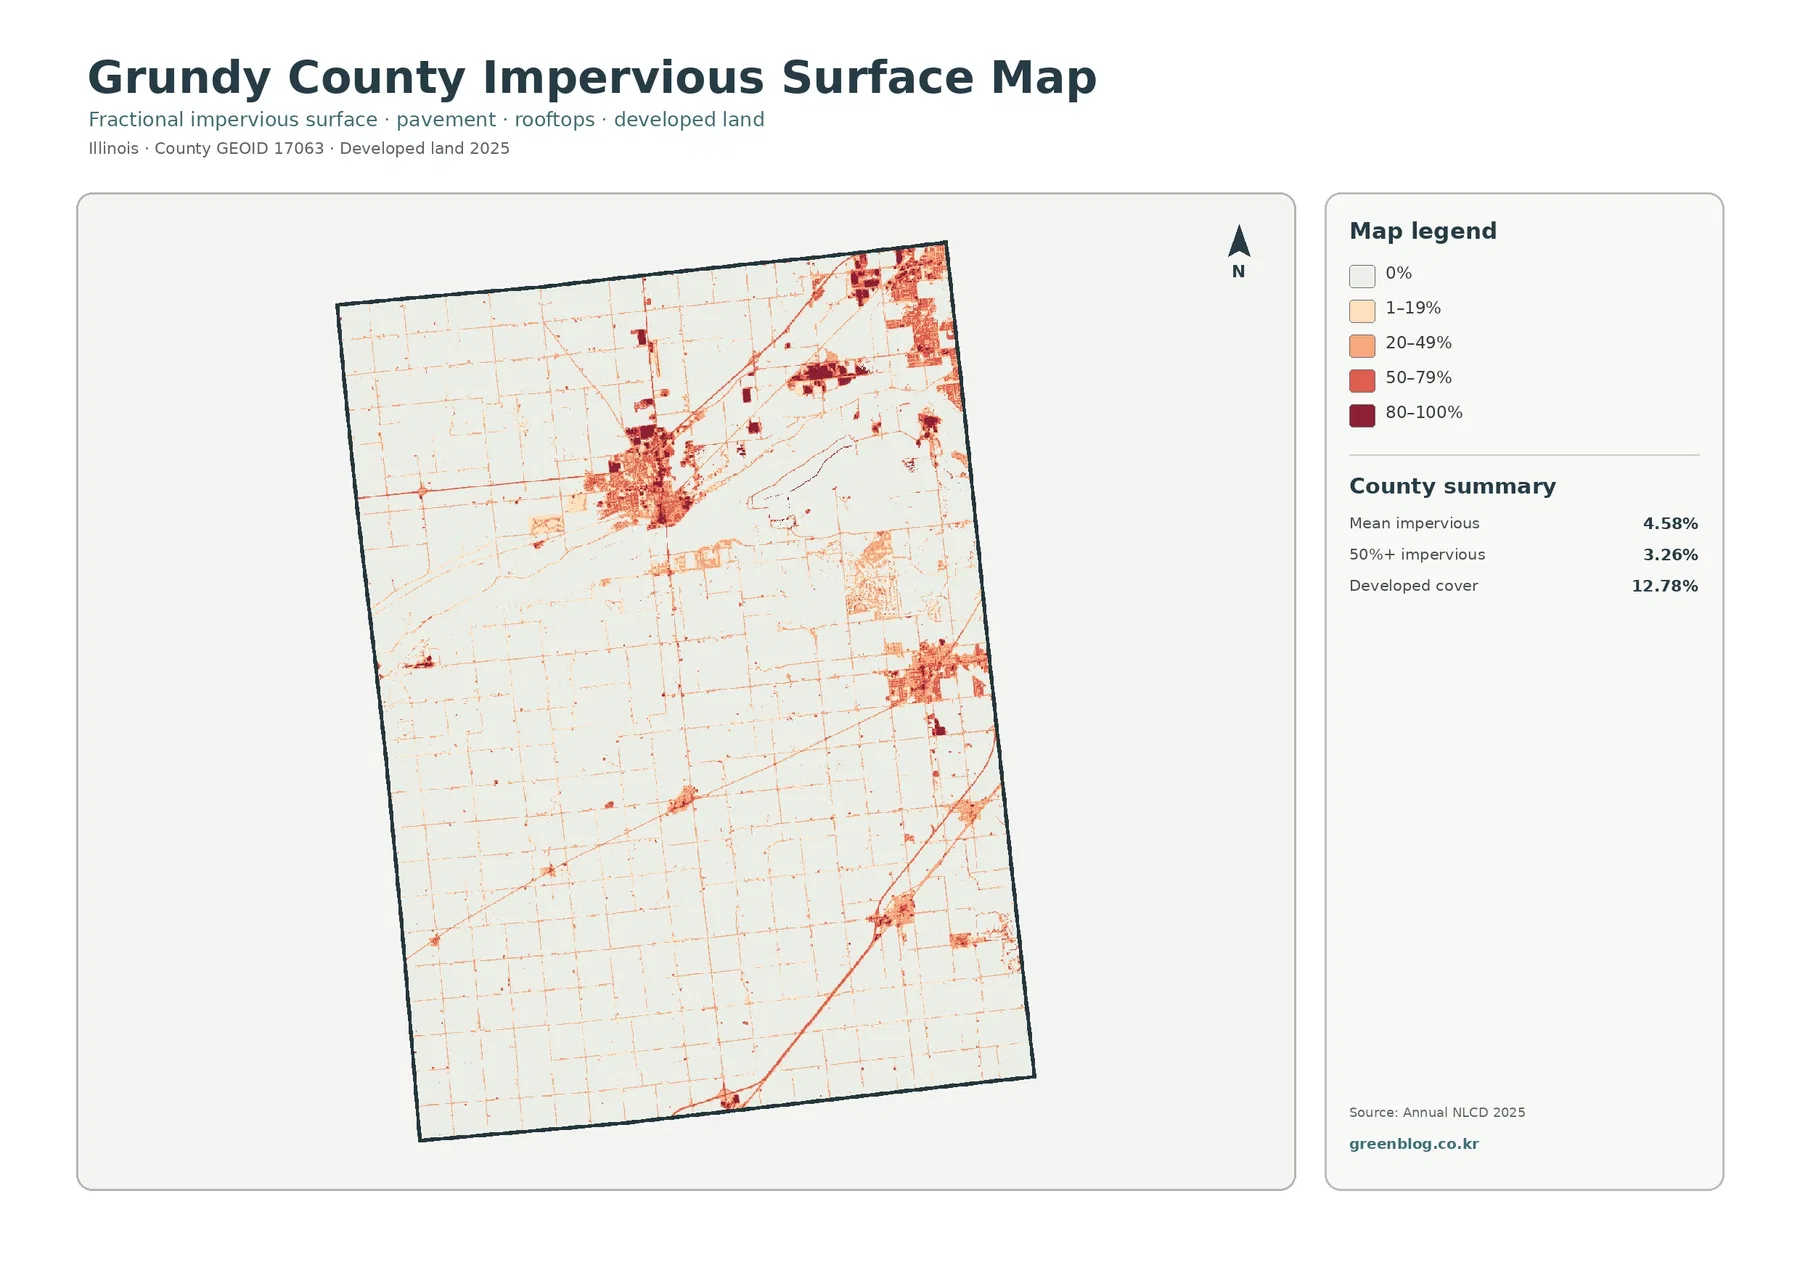
The darkest values form a large north-central cluster and separate concentrations near the northeastern and eastern parts of the county. Thin lines extend between those centers along roads, while most of the southern agricultural area remains pale. This contrast makes the map useful for showing where hard surfaces are concentrated without suggesting that the entire developed class is fully paved or built over.
The north-central concentration corresponds to the Morris area near the Illinois River, a relationship that is also consistent with Grundy County’s official comprehensive plan. The plan describes the Illinois River as an east–west transportation corridor through the county and identifies Morris as the location of the county’s roadway bridge crossing. The land-cover map does not explain why development is located where it is, but it clearly shows built surfaces and the river corridor occupying the same broad part of the county.
The 2025 land-cover map places 73.88% agriculture beside a river-and-wetland corridor that looks very different from the south
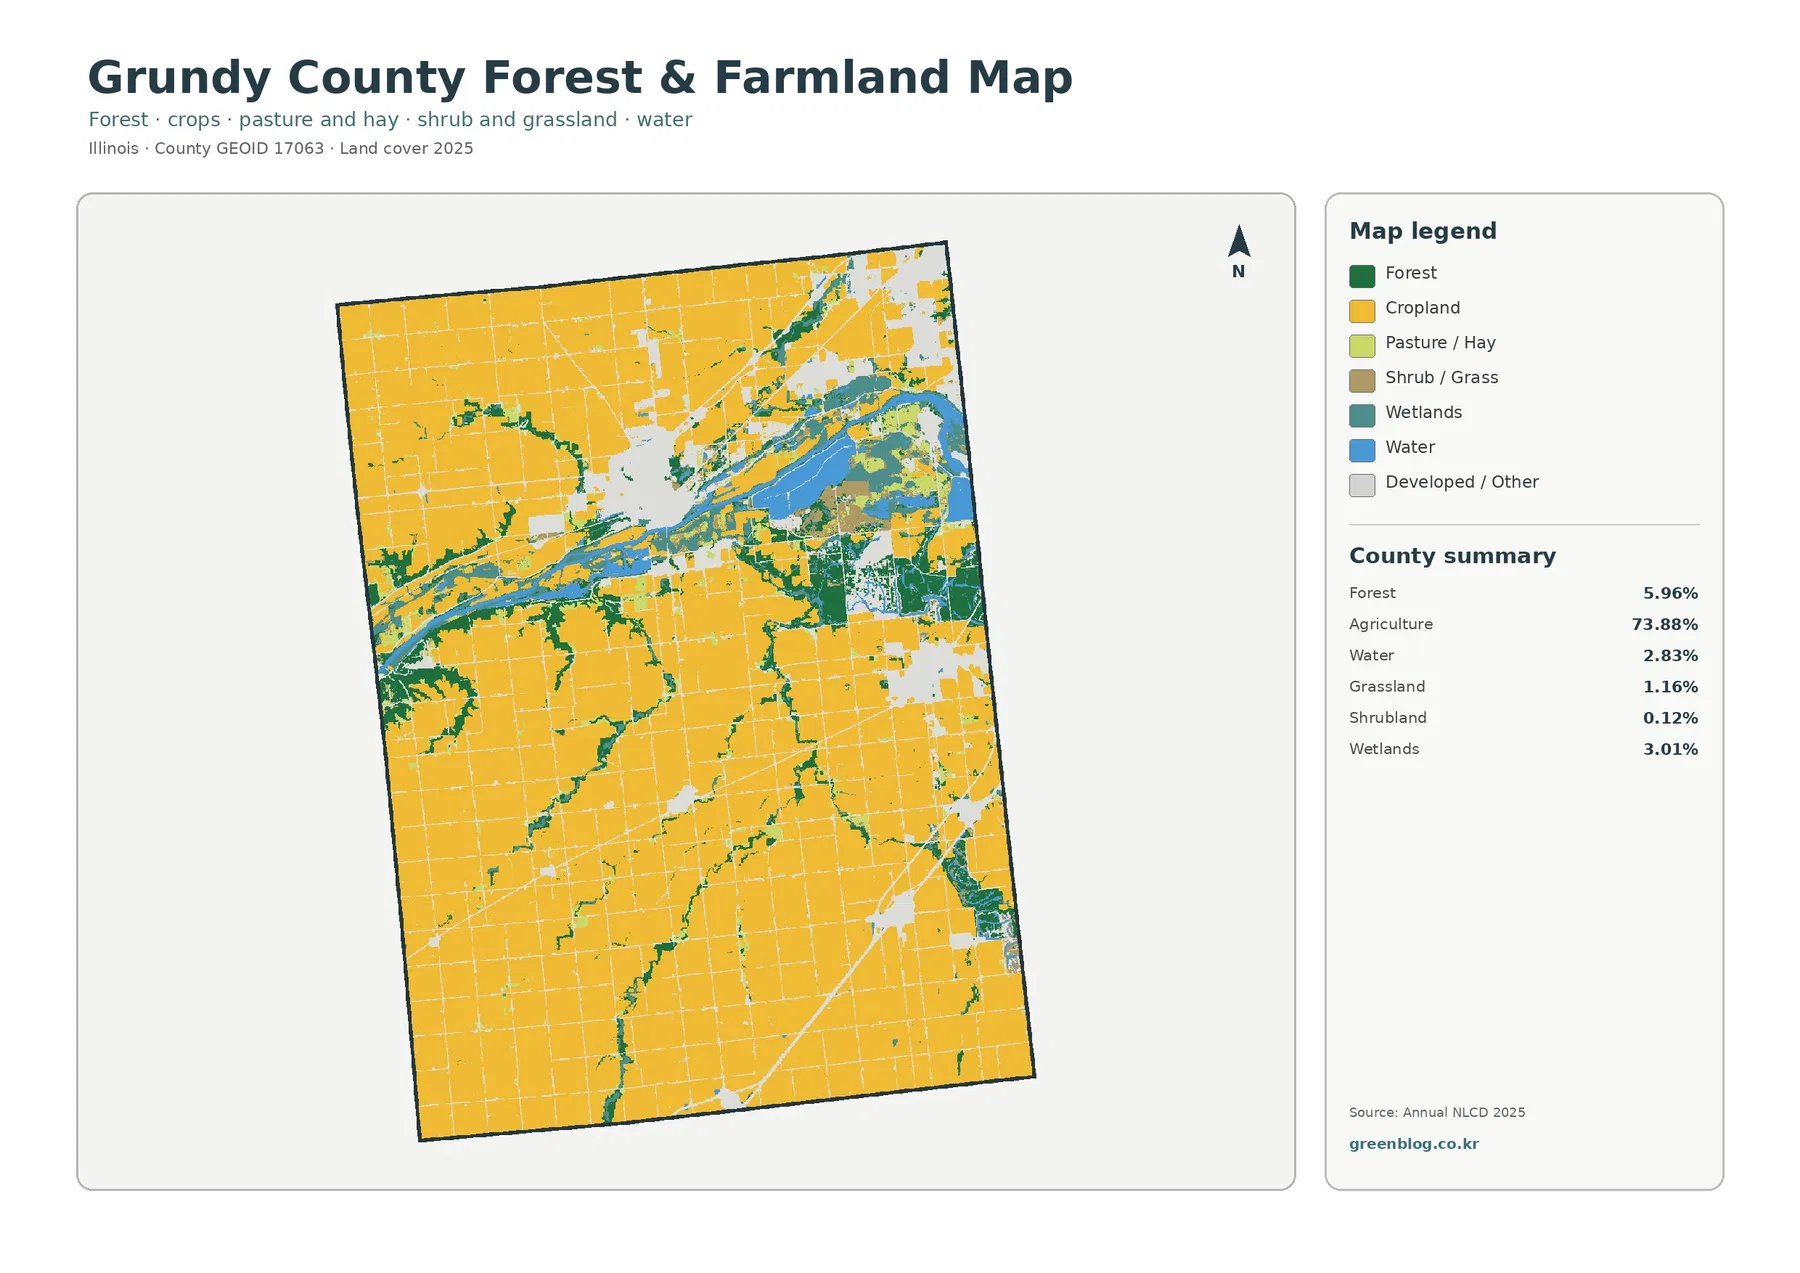
Agriculture dominates the general map. Large yellow blocks cover most of the south, west, and northwest, and a grid of narrow developed lines follows the road network across those fields. The northern third is more varied: broad blue water, teal wetlands, green forest, and red developed areas interrupt the agricultural pattern and create a dense mixture of classes.
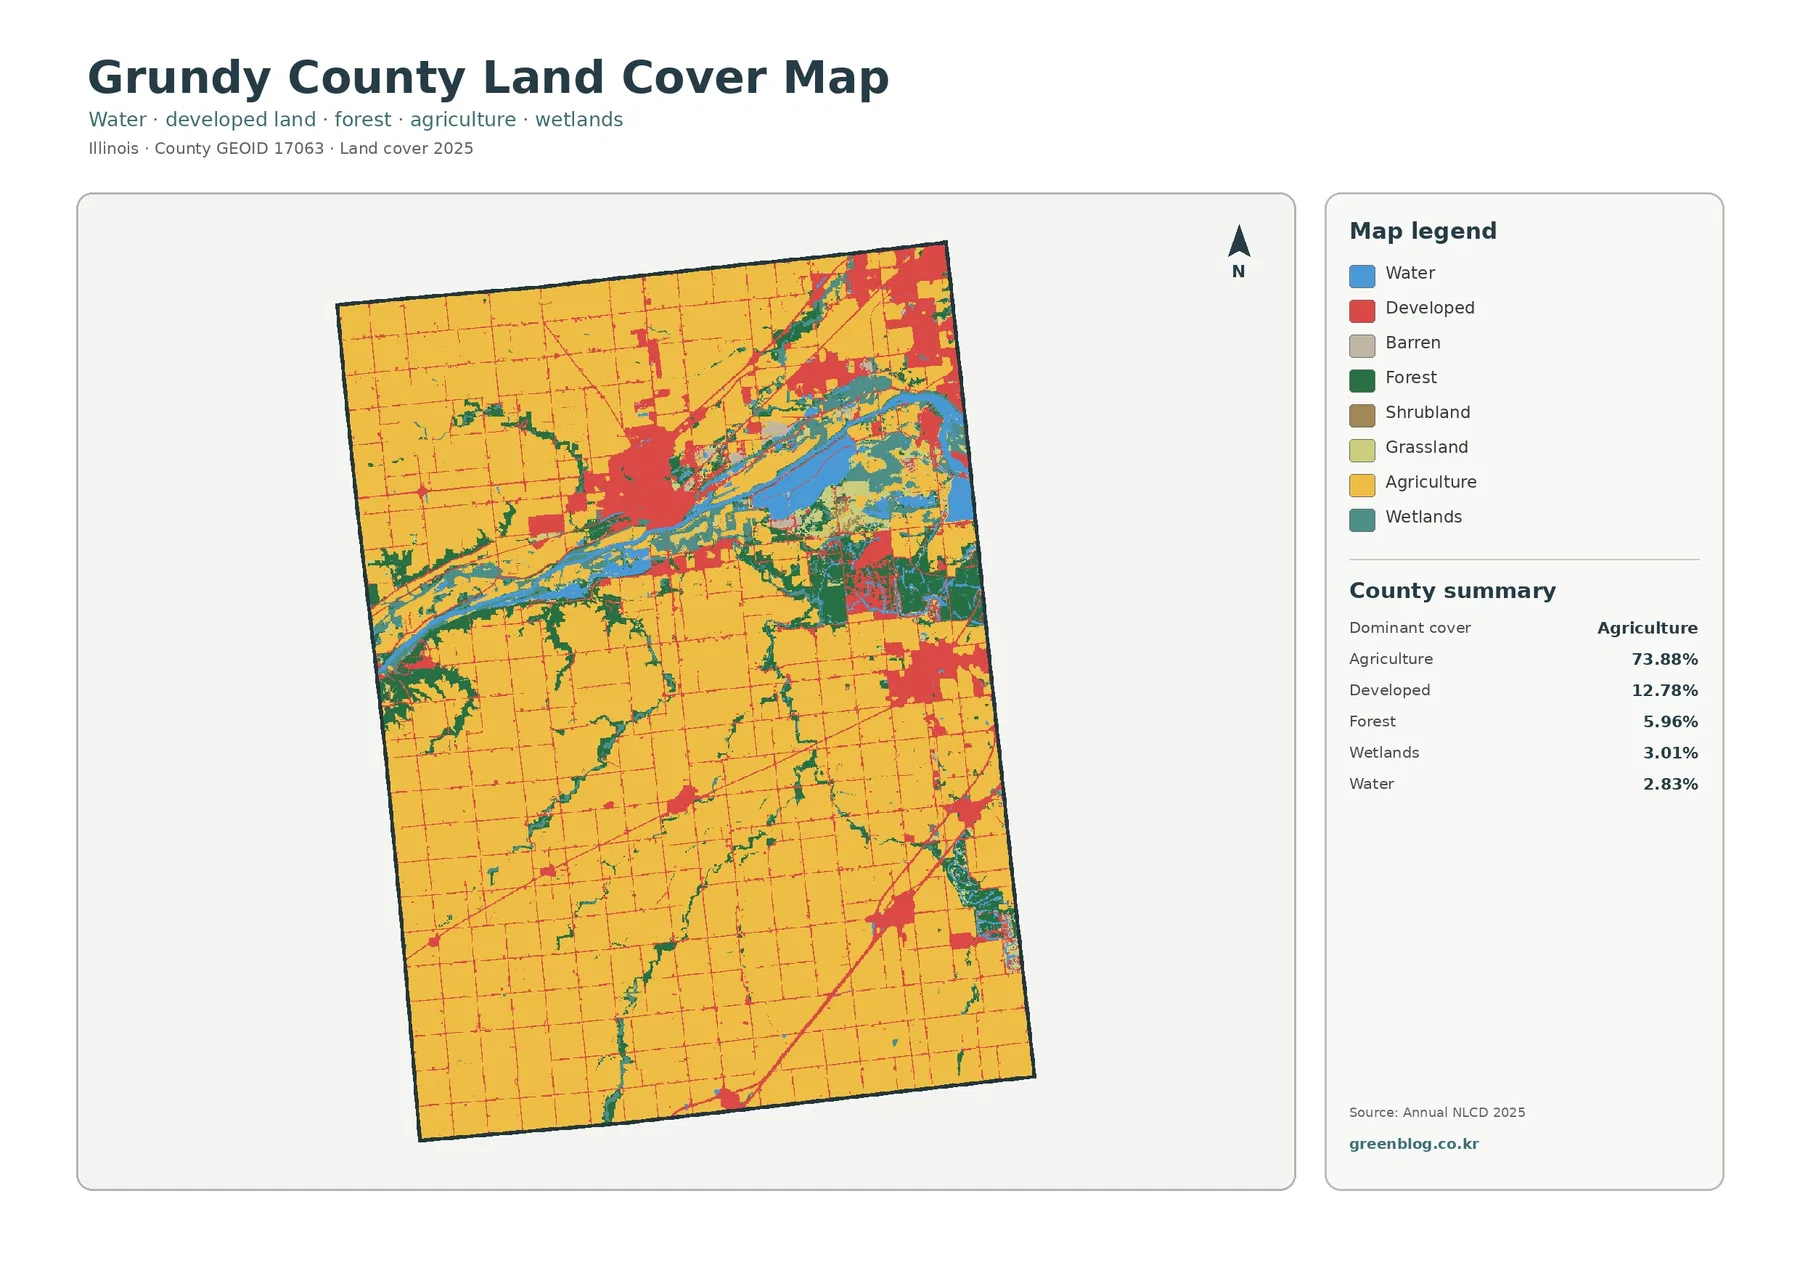
Developed land is the second-largest listed class at 12.78%. Rather than forming one continuous urban surface, it appears as several stronger concentrations linked by narrow road corridors. The main north-central cluster is visually dominant, while additional built-up areas appear near the northeastern edge, east-central area, and smaller southern settlements. The map therefore represents a county where extensive farmland and concentrated development coexist.
Water and wetlands are modest percentages countywide but become major visual features along the Illinois River
Water accounts for 2.83% and wetlands for 3.01%, yet both classes stand out because they are concentrated rather than evenly scattered. The broad water feature across the northern part of the map is the Illinois River corridor. Teal wetland areas sit beside and around portions of the water, and forest often appears nearby, producing a landscape that is much more varied than the large agricultural blocks farther south.
The forest-and-farmland view removes much of the urban detail so field blocks and wooded strips are easier to compare
The forest-and-farmland map simplifies the county by emphasizing cropland, forest, pasture or hay, shrub and grass, wetlands, and water while muting developed and other surfaces. Agriculture still covers 73.88%, so broad field blocks remain the dominant feature. The northern water corridor cuts through that pattern, and wooded strips become easier to follow where they extend away from the river or along smaller drainage features.
The 1985–2025 comparison records an 8.73% class difference, including 3.53% classified as developed
The change map compares the 1985 and 2025 classifications rather than showing a continuous forty-year timeline. Grundy County has an 8.73% total class difference. The summary identifies 3.53% classified as developed, 0.14% forest loss, 1.08% agricultural loss, and 3.79% other class difference. Wetland-difference cells are mapped separately, but the image does not provide a standalone percentage for that category.
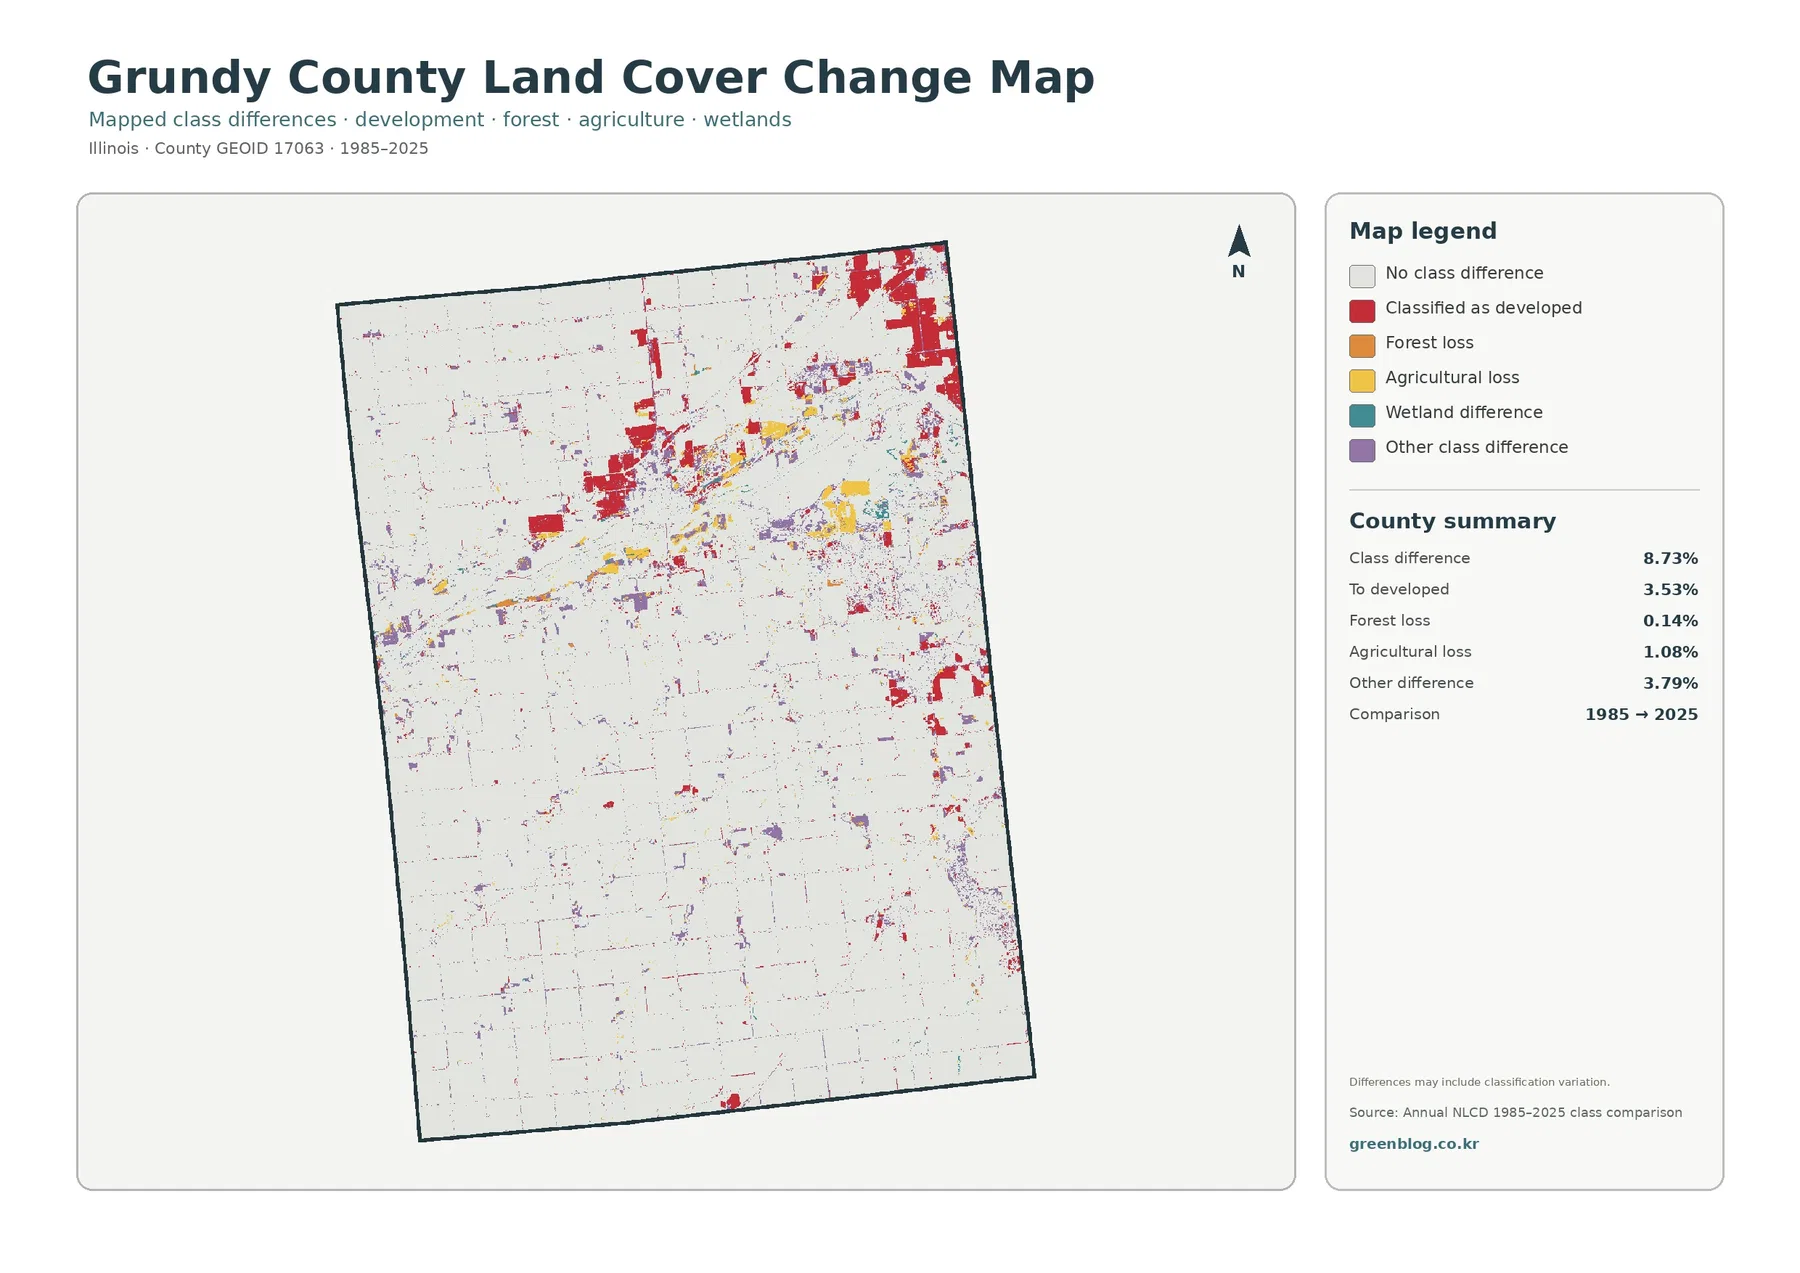
Red cells associated with developed classification are most noticeable around the stronger northern development clusters and in several road-linked areas. Yellow agricultural-loss and purple other-difference cells appear in smaller patches through the river corridor and elsewhere. The pattern does not support treating the full 8.73% as one type of development change, because several class-difference categories contribute to the total.
The 3.79% other-difference category is especially important for cautious interpretation. A different classification at the two endpoints can reflect genuine surface change, but it can also be influenced by imagery, classification procedures, seasonal conditions, water levels, or mixed pixels. The map is most useful for screening locations that deserve closer review with newer aerial imagery or other records.
Different map views are useful for planning context, watershed study, education, and presentation graphics
For a broad county overview, the general land-cover map is the strongest starting point because it keeps agriculture, development, forest, wetland, and water on one page. A watershed or environmental lesson can focus on the northern Illinois River corridor and compare water, wetlands, and wooded edges. An agricultural presentation can use the forest-and-farmland view to show how extensive field blocks differ from the more fragmented northern landscape.
Thirty-meter raster cells generalize narrow roads, stream edges, and mixed surfaces
Annual NLCD commonly uses 30-meter raster cells. A raster cell is a grid unit that summarizes the surface within a small square area. Roads beside fields, wooded strips along water, or wetland vegetation next to open water can fall within the same cell, creating what is often called a mixed pixel. The resulting classification is useful at county scale but is not a parcel survey.
This limitation matters along the Illinois River corridor, where water, wetlands, forest, and developed surfaces occur close together. Narrow features may look wider, narrower, or more simplified than they are on the ground. Forest color does not identify ownership, wetland color is not a legal delineation, and developed land does not show zoning or building eligibility.
Frequently Asked Questions
What is the largest 2025 land-cover class in Grundy County?
Agriculture is the largest class at 73.88%. Developed land is 12.78%, forest 5.96%, wetlands 3.01%, and water 2.83%. The county is farm-dominated overall, but the northern Illinois River corridor contains a much more varied mix of water, wetlands, forest, and development.
Why is developed land 12.78% while mean impervious cover is 4.58%?
A developed land-cover cell can still contain lawns, trees, soil, and other permeable surfaces. Impervious cover estimates the harder portion such as pavement, parking areas, and rooftops, so the two percentages measure different characteristics.
Does the 8.73% 1985–2025 class difference mean that the same share definitely changed land use?
No. It is the share of cells whose endpoint classifications differ. Genuine surface change may be included, but imagery, classification procedures, water levels, seasonal conditions, and mixed pixels can also contribute. The summary lists 3.53% classified as developed.
Map File Information
The ZIP contains the four original JPG maps for Grundy County: 2025 land cover, forest and farmland, impervious/developed land, and the 1985–2025 land-cover class comparison.
- File Type: one ZIP containing four JPG files
- Intended Use: county landscape comparison, river and wetland study, agricultural context, impervious-surface review, change screening, classes, and presentations
Related Maps
- Adams County Illinois Land Cover Map
- Alexander County Illinois Land Cover Map
- Bond County Illinois Land Cover Map
Sources and references
- MRLC Annual NLCD Data – official access to Annual NLCD land-cover and impervious-surface datasets.
- USGS Annual NLCD Land Cover Classification – official explanation of land-cover classes and classification methods.
- U.S. Census Bureau TIGER/Line Shapefiles – official county boundary data for geographic reference.
- Grundy County Comprehensive Plan – official county context for the Illinois River, Morris, natural resources, and land-use planning.
Green Map creates custom-edited map images using open geographic data sources such as geoBoundaries, Natural Earth, OpenStreetMap, and government open data.
These maps are edited visual materials, not raw data files, and are provided for education, documents, presentations, and graphic reference.